Transcription
Version 7Quick Reference Guide
Table of Contents1Starting OPUS . . . . . . . . . . . . . . . . . . . 11.11.21.31.4OPUS Login . . . . . . . . . . . . . . . . . . . . . . . . . . . 2About OPUS . . . . . . . . . . . . . . . . . . . . . . . . . . . 2OPUS Access Control . . . . . . . . . . . . . . . . . . . . 5Registering OPUS . . . . . . . . . . . . . . . . . . . . . . . 62Working with OPUS . . . . . . . . . . . . . . 72.12.22.32.42.52.62.7Acquiring a spectrum . . . . . . . . . . . . . . . . . . . . 7Baseline Correction . . . . . . . . . . . . . . . . . . . . . 15Data File History . . . . . . . . . . . . . . . . . . . . . . . 20Save File . . . . . . . . . . . . . . . . . . . . . . . . . . . . . 21Save File As . . . . . . . . . . . . . . . . . . . . . . . . . . . 22Load File . . . . . . . . . . . . . . . . . . . . . . . . . . . . . 24Print Spectra . . . . . . . . . . . . . . . . . . . . . . . . . . 273Analysis Report . . . . . . . . . . . . . . . . . 293.13.23.33.43.53.6Report Layout . . . . . . . . . . . . . . . . . . . . . . . . . 29Report Structure . . . . . . . . . . . . . . . . . . . . . . . . 29Standard Template . . . . . . . . . . . . . . . . . . . . . . 30Report Output . . . . . . . . . . . . . . . . . . . . . . . . . 30Generating Report . . . . . . . . . . . . . . . . . . . . . . 30Example of analysis report . . . . . . . . . . . . . . . 33
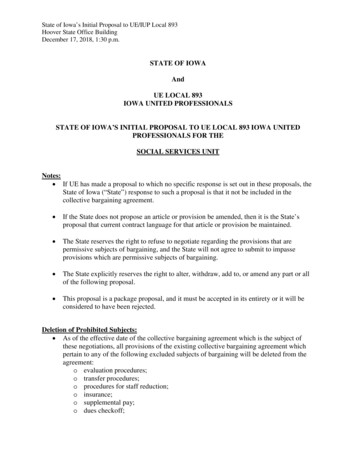
1Starting OPUS1. Insert the OPUS stick into the USB port of your PC. Normally, the installation starts automatically. If the Windows Autostart option is disabled, youhave to start the installation manually by running the Setup program fromthe stick.2. Follow the on-screen installation instructions.3. Restart the PC at the end of the installation procedureNote: You may be prompted to restart your computer when you install different program components. In such a case do not restart until the OPUS setup hasbeen completed.4. On the Windows Start menu, click the OPUS icon when the installation hasbeen finished.Figure 1: Windows Start MenuThe Login dialog box opens.Bruker Optik GmbHOPUS Quick Reference Guide1
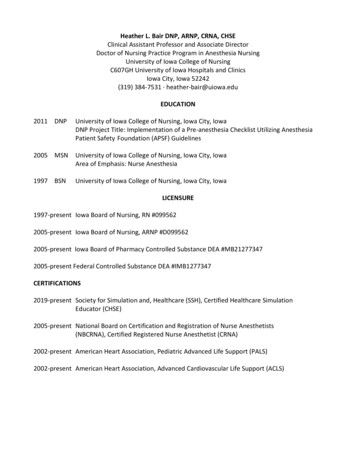
Starting OPUS1.1 OPUS LoginFigure 2: OPUS Login1. Select your User ID from the drop-down list.2. Enter OPUS in the Password entry field. The password is case sensitive.Once you have assigned yourself a user record in OPUS, it is possible todetermine your own user ID and password.3. Select the assigned workspace. You can always select those workspacesfrom the drop-down list which have been defined for your user ID. Whenyou use OPUS for the first time, we recommend not to change the standarddefault.ows workspace. For more detailed information on the user accountsystem refer to the OPUS Reference Manual.4. Click the Login button. The About OPUS dialog opens.1.2 About OPUSThis dialog contains: 2serial number of the OPUS versionname of the licenseelist of available OPUS packagesOPUS Quick Reference GuideBruker Optik GmbH
About OPUSFigure 3: About OPUSClick the OK button.The OPUS user interface opens.Bruker Optik GmbHOPUS Quick Reference Guide3
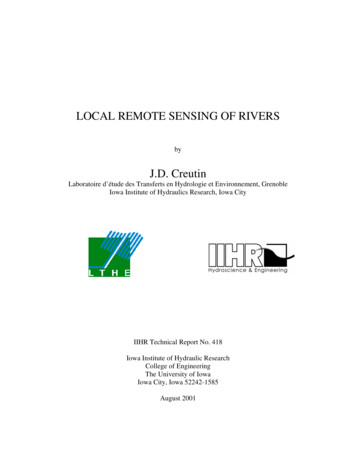
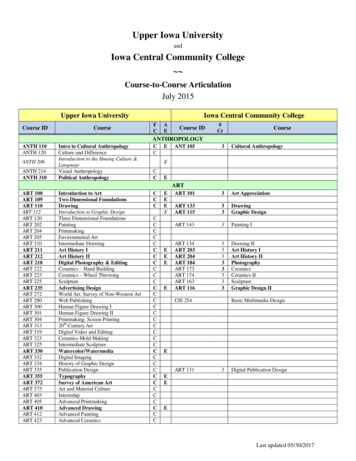
Starting OPUSABCDEHIFFigure 4: OPUS user interfaceGThe OPUS user interface header shows the type and status of the operator currentlylogged in.A)B)C)D)E)F)G)H)I)Menu barToolbarBrowser windowSpectrum windowOverview windowOPUS viewInstrument statusStatus barOnline helpAll settings (menus or icons) are individually configurable and will be reloadedwhen you start OPUS next time.For detailed information on the OPUS user interface refer to the OPUS ReferenceManual.4OPUS Quick Reference GuideBruker Optik GmbH
Acquiring a spectrum2Working with OPUS2.1 Acquiring a spectrumDuring normal daily work you may frequently measure a single-channel referencespectrum (open-beam spectrum without any sample in the optical path). This spectrum is also called background spectra.In case of routine measurements you just have to change the samples, start measurement and evaluate the results. If you turn on the spectrometer for the first time, or ifyou have changed the hardware (e.g. beamsplitter or detector), you have to checkthe instrument settings before starting the measurement.The measurement dialogs depend on the current spectrometer configuration. Therefore, the following dialogs may be slightly different from the ones displayed on yourscreen.2.1.1 Setting up spectrometer components1. On the Measure menu, click the Optic Setup and Service command or usetheicon from the toolbar. The Optic Setup and Service dialog opens.2. Click the Optical Bench tab.3. Select the spectrometer from the Configuration drop-down list.4. Click the Save Settings button.Bruker Optik GmbHOPUS Quick Reference Guide7
Working with OPUSFigure 7: Optic Setup and Service - Optical Bench tabThe spectrometer is connected as soon as the spectrometer name and firmware version are displayed.2.1.2 Setting up measurement parametersBefore starting a measurement, you have to define certain parameters.On the Measure menu, click the Measurement command. Or use thethe toolbar. The Measurement dialog opens:8OPUS Quick Reference Guideicon fromBruker Optik GmbH
Acquiring a spectrumABCFigure 8: Erroneous setting on tabIf you open the Measure menu for the first time, some tabs may indicate erroneoussettings by signs such as .A) Ifappears or is displayed, you have to correct the erroneous settingsfirst before being able to continue. In case ofit is still possible to savethe configuration.B) If the entry field is marked red, the requested parameter does not fit to thehardware used. For example, if an experiment requires an MCT detector,but a DTGS detector has been installed according to the optics configuration. In such a case, click the small arrow to have the possible setting(s) displayed. Make sure that you correct potential errors before saving thesettings.C) If an entry field is marked red, the current value for that parameter is beyondits specified range, or the value is missing completely. If you point the cursor onto a red entry field, a tooltip opens and gives an explanation.Figure 9: Error tooltipBruker Optik GmbHOPUS Quick Reference Guide9
Working with OPUSIf properly configured, the Measurement dialog box is displayed without any warnings:Figure 10: Measurement menu tabs without any warnings2.1.3 Calibrating interferogram peakBefore you start the first measurement you have to determine and store the exactinterferogram peak position.You only have to repeat the peak position determination if there have been madechanges in the hardware.1. On the Measurement dialog, click the Check Signal tab. Make sure that theInterferogram option button is activated.10OPUS Quick Reference GuideBruker Optik GmbH
Acquiring a spectrumFigure 11: Check Signal tab - Select interferogram2. If no interferogram peak is displayed, move the scan region to the left orright using the arrow buttons to find the peak.Figure 12: Measurement - Interferogram calibration3. Once the interferogram peak has been found, click the Save Peak Positionbutton. The exact peak position is required to perform Fourier Transformation.Bruker Optik GmbHOPUS Quick Reference Guide11
Working with OPUS2.1.4 Storing experiment file1. On the Measurement dialog, click the Advanced tab.Figure 13: Measurement - Advanced tab2. Define the number of scans in the Sample/Background Scan Time entryfields.3. Enter the data path to automatically store the measurement. If you want tochange this path, select the new path by thebutton.4. Determine the data type for the result spectrum. It is recommended toselect Absorbance as a common result spectrum type.Figure 14: Measurement - Select result spectrum typeIf you later want to work with a different kind of data type for the resultspectrum, you can change the type of result spectrum at any time.5. Click the Save and Exit button. Define an appropriate file name. It is recommended to repeatedly use the experiment files. They are essential whenworking with macros.12OPUS Quick Reference GuideBruker Optik GmbH
Acquiring a spectrum2.1.5 Background MeasurementExcept for emission, Raman, and single-channel measurements, it is always necessary to acquire a background spectrum before measuring the sample. This spectrumreflects the effects that the spectrometer itself has on measured spectra.For example, the performance of the light source varies at some frequencies, or theoptics absorbs light stronger at a certain wavelength.1. On the Optic tab, set the aperture to the same value used to acquire a sample spectrum.2. To start the background measurement select the Basic tab and click theBackground Single Channel button.Figure 15: Measurement - Basic tabThe status bar below the OPUS spectrum window indicates the measurement progress, the number of scans performed by the optical bench and the OPUS applicationwhich is currently running:Right click on the status bar to interrupt measurement. If the data acquisition hasbeen finished, the status bar indicates that No Active Task is performed.Bruker Optik GmbHOPUS Quick Reference Guide13
Working with OPUS2.1.6 Sample Measurement1. Having measured the background spectrum, place the sample into the optical path of the spectrometer. This procedure depends on your specific hardware setup.2. On the Basic tab, enter the sample name and define the sample form. Thisinformation is stored together with the spectrum.3. Click the Sample Single Channel button to start measurement.The Measurement dialog closes and the spectrum window opens.You can monitorthe progress of the measurement on the status bar at the bottom of the OPUS window.If the measurement has been finished, the measured spectrum is displayed in thespectrum window.Figure 16: Spectrum Window - Showing the spectrum measuredStrictly speaking, the spectrometer measures an interferogram rather than a spectrum. Using Fourier Transformation this interferogram is transferred into a singlechannel spectrum. On the basis of this single-channel spectrum and the backgroundspectrum measured, a result transmission spectrum is calculated.14OPUS Quick Reference GuideBruker Optik GmbH
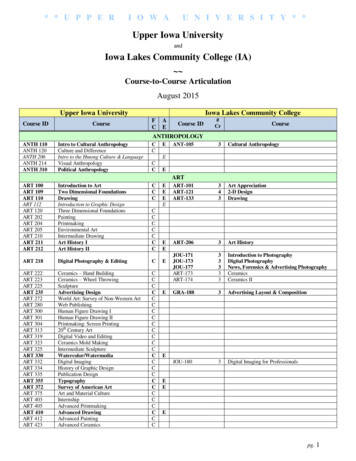
Baseline CorrectionThis is done automatically and apart from short descriptions in the status bar youcannot see any of these steps.To get an idea of the different types of spectra, figure 17 shows the single-channelspectrum, background spectrum and the calculated transmission spectrum. Eachdata block is displayed in the browser. For further details on the data blocks, referto the OPUS Reference Manual.TransmissionSpectrumSample Spectrum(single channel)Background Spectrum(single channel)Figure 17: Spectrum Window - Showing different types of spectra2.2 Baseline CorrectionIf the baseline of your spectrum is sloped, curved or significantly below 100% transmission, the sample preparation might have been insufficient. Instead of measuringthe sample again, perform a baseline correction. In many cases, this will solve theproblem.The baseline correction is useful to manipulate spectra which could not have beenmeasured very well due to the sample material.Bruker Optik GmbHOPUS Quick Reference Guide15
Working with OPUSHowever, you should always try to prepare the samples properly to get good spectra,instead of correcting them later.Figure 18 shows an example of a baseline correction: the second spectrum is theoriginal, whereas the first one is baseline corrected.Figure 18: Spectrum Window - Baseline correction resultsHow to perform baseline correction?1. On the Manipulate menu, click the Baseline Correction command, or usethe16icon from the toolbar. The following dialog box opens:OPUS Quick Reference GuideBruker Optik GmbH
Baseline CorrectionFigure 19: Baseline Correction - Select Files tab2. On the browser, select the spectrum block (AB or TR) and drag it to theFile(s) to correct selection field while pressing the left mouse button.Alternatively, double click on the spectrum block. If you release the leftmouse button, the file selected will be displayed in the selection field:Figure 20: Baseline Correction - File selected3. To define a particular baseline correction method, click on the SelectMethod tab.Bruker Optik GmbHOPUS Quick Reference Guide17
Working with OPUSFigure 21: Baseline Correction - Select Method tab4. Select a method type. For detailed information on the different methodtypes refer to the OPUS Reference Manual.5. Set the number of baseline points manually. Click the corresponding entryfield and change the number. A value of 64 is generally recommended.6. To exclude the CO2 range during baseline correction, activate the ExcludeCO2 Bands check box.7. Click the Correct button to immediately start baseline correction.Now, the OPUS browser window shows a red document symbol which indicatesthat the file has been manipulated. The red symbol is on top of the blue one (rawdata).18OPUS Quick Reference GuideBruker Optik GmbH
Baseline CorrectionFigure 22: Spectrum file displayed in browser after baseline correctionAfter baseline correction is complete. the spectrum has not yet been saved to disk and exists only as a temporary file.Store the file on the disk as a separate file to prevent the original file from beingoverwritten.To undo baseline correction.1. On the OPUS browser, right click the red document symbol. A menu popsup.Figure 23: Pop-up menu used to undo function2. Select the Undo all Manipulations command. The following dialog opens:Bruker Optik GmbHOPUS Quick Reference Guide19
Working with OPUSFigure 24: Undo changes - Select Files tab3. Click the Undo button. The red document symbol disappears in the OPUSbrowser and the original data are available again.2.3 Data File HistoryAny spectrum manipulations and measurement parameter changes are recorded ina non-editable, non-deletable history data block ().Figure 25 shows a file of a spectrum with several types of manipulations performed:20OPUS Quick Reference GuideBruker Optik GmbH
Save FileFigure 25: Report window showing the data file historyThe first line of the data file history contains the user ID, OPUS version and thespectrum name. All manipulations and their parameters are listed in the order of performance.Data information is always stored in the data block in one single spectrum file, together with the processed spectrum. This ensures that all data manipulations are recorded, e.g. manipulation method, time and operator.2.4 Save FileThe original spectrum is automatically saved in the path defined in section 2.1.4.1. Right click on the red document symbol in the OPUS browser.2. On the pop-up menu, select the Save File command. Alternatively, clickthe Save iconBruker Optik GmbHor select Save File from the File menu.OPUS Quick Reference Guide21
Working with OPUSFigure 26: Save File - Select Files tab3. The spectrum file has to be listed in the File(s) to save selection field.4. Click the Save button. The original file is overwritten and cannot berestored anymore.2.5 Save File AsUse this command if you want to save the spectrum files by a different file name, orin a different directory.1. Click the Save File As icon, or select the File menu and click the SaveFile As command. The Save File As dialog opens.22OPUS Quick Reference GuideBruker Optik GmbH
Save File AsFigure 27: Save Spectrum - Select File tab2. Enter the new file name into the File name entry field. OPUS always suggests a file name.3. Enter the new path directly into the Path entry field. Alternatively, you canbrowse the directories by clicking on the Change Path button.4. Activate the Overwrite check box, if you want to overwrite a previous file.Otherwise, an increment will be added to the file name. The Overwriteoption is not available in validation mode.5. Click the Save button.The spectrum file is normally saved in OPUS format. However, the Mode and DataPoint Table tabs allow to save the file in JCAMP-DX or XML format, as a plain XY data table, in Pirouette (DAT) or in GALACTIC format (SPC).Bruker Optik GmbHOPUS Quick Reference Guide23
Working with OPUSFigure 28: Save Spectrum - Mode tab2.6 Load File1. On the File menu, click the Load File command. Alternatively, click theicon from the toolbar. The Load Spectrum dialog opens.2. Select a spectrum file.3. Click the Open button.24OPUS Quick Reference GuideBruker Optik GmbH
Load FileABFigure 29: Load Spectrum - No file selectedA) The title bar shows the directory in which the spectrum files are located.B) Three parameters of a spectrum file are shown by default. You can selectthe specific parameters from the drop-down lists. As no file has been selected yet in figure 29, only the parameter abbreviations are shown.If you select a spectrum file, the Load Spectrum dialog will change as follows:Figure 30: Load Spectrum - Active previewBruker Optik GmbHOPUS Quick Reference Guide25
Working with OPUSA preview of the spectrum without the axes is displayed. The absorption data block() on the top left corner is displayed as a small icon. The spectrum parametersare now defined.As normally not all parameters have been specified for each spectrum file, some ofthe parameters may be missing.To load the spectrum into the OPUS spectrum window click the Open button.Figure 31: OPUS spectrum and browser windowAs the spectrum cannot be displayed in full size within the spectrum window, youcan scale the spectrum using the Scale icon (26).OPUS Quick Reference GuideBruker Optik GmbH
Print Spectra2.7 Print SpectraOPUS provides two possibilities to quickly and easily print recorded spectra.1. Quick Print icon () from the toolbar:OPUS selects an appropriate plot layout depending on the window typecurrently used. For example, if you work in the spectrum window, thespectrum will be printed within a frame. If you search a spectrum library,the results as well as a hit list, spectral information and the structure of theproduct will be printed. For details on default layout plots available, referto the OPUS Reference Manual.2. Print Spectra command on the Print menu:using this command allows to define further basic printout options, e.g.frames and frequency range.Figure 32: Print Spectra - Select Files tabFor details on printing data refer to chapter 3.Bruker Optik GmbHOPUS Quick Reference Guide27
Report Layout3Analysis ReportOPUS allows to depict sample parameters and evaluation results for one or severalspectrum files in an analysis report. The spectra files need to contain the data blockof the respective evaluation. Evaluation data blocks are e.g. PEAK, INTEG,QUANT, IDENT, SEARCH, CT.Figure 33: Example of a spectrum file withdata blocks of different types of evaluation3.1 Report LayoutTo generate the report there are three different types of layout options available: Single sample report: one report for each spectrum file Multi sample report: one report for all spectrum files Paper strip report: one report for each spectrum file, with fewer report datathan with the single sample reportTo generate a single sample or paper strip report you can use several spectra files atonce. In this case, a separate report is generated for each spectrum file separately.A multi sample report lists all spectrum files with the respective data in one report.3.2 Report StructureThe structure of an analysis report is similar with all three report types. The reportcan contain: general report data sample-specific data spectrum frame of each sampleBruker Optik GmbHOPUS Quick Reference Guide29
Analysis Report3.2.1 Spectrum FrameThe spectrum frame is displayed below the general report data and product-specificdata. This kind of report data is optional and displayed either always, never or onlyif the evaluation result is not ok.3.3 Standard TemplateWhen generating an analysis report for the very first time OPUS uses the Default.artstandard template. The data provided in this template considers the typical settingoptions available for the three different report layouts, with regard to e.g. sample parameters and evaluation results.The standard template is stored in the Program Files\OPUS directory and can beedited. Detailed information on how to edit the standard template are provided inthe OPUS Reference Manual.3.4 Report OutputThere are different possibilities for the report output: printer file (either as PDF or csv file) clipboard (to integrate the report into other types of documents)3.5 Generating Report1. Load the spectrum file(s).2. On the Print menu, select the Generate Analysis Report command.3. Drag & drop the spectrum file(s) into the File(s) for report generationselection field.30OPUS Quick Reference GuideBruker Optik GmbH
Generating ReportFigure 34: Generate Analysis Report - Select Files4. Select the report layout. The report template file previously used is alwaysdefined.5. Click the Output to tab to define how the report is to be printed.Bruker Optik GmbHOPUS Quick Reference Guide31
Analysis ReportFigure 35: Generate Analysis Report - Output toIf you activate the PDF or csv file option button, the File name and pathentry fields are enabled. To save the report define the file name and path oredit the path, using the Select Path button.6. Click the Generate button.32OPUS Quick Reference GuideBruker Optik GmbH
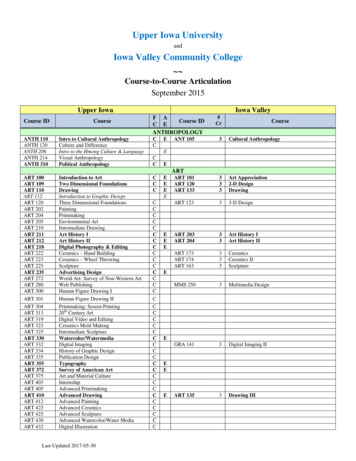
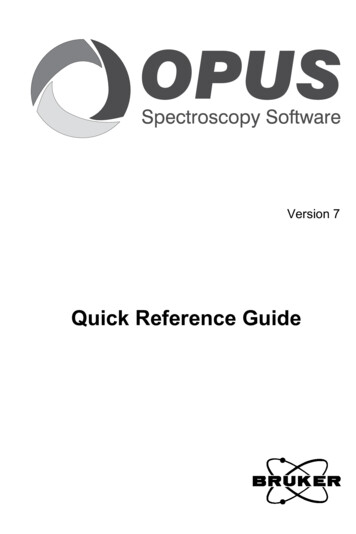
Example of analysis report3.6 Example of analysis reportFigure 36: Example of a single analysis report with 4 componentsBruker Optik GmbHOPUS Quick Reference Guide33
Starting OPUS 2 OPUS Quick Reference Guide Bruker Optik GmbH 1.1 OPUS Login 1. Select your User ID from the drop-down list. 2. Enter OPUS in the Password entry field. The password is case sensitive. Once you have assigned yourself a user record in OPUS, it is possible to determine your own user ID and password. 3. Select the assigned workspace.