Transcription
Other Relevant information in compliance with article 227 of the Consolidated Text of theSpanish Securities Markets Law, notified to the Spanish National Securities Market CommissionQ22022January – June 2022 ResultsJuly 28, 2022Results January – June 20221
Key takeawaysConsistent execution: i) 2022 outlook confirmed in the upper end of the range andii) strong commitment with our strategyConsistent and sustainable organicgrowth c.5.2% new PoPs vs. H1 211,877 site actions in H1 2022 with c. 12Mnassociated annualized lease efficienciesContract with an anchor tenant renewed andextended for a 30-year period and industrialpartnership including FTTT (1)Cooperation with Digi started in PortugalStrong financial performanceRevenues (2) 1,690Mn, 59% vs. H1 2021AdjustedEBITDA (3) 1,282Mn, 59% vs. H1 2021RLFCF (4) 637Mn, 62% vs. H1 2021Cellnex one of the few companies in the sectorkeeping pace with nominal GDPPartnership with Nokia on private networksManagement is fully committed toCellnex’s successful equity storyCellnex among the 5 leading globaltelcos in sustainabilityNew rating of 14 points by Sustainalytics ‘ESG RiskRating’, improving last year’s (c.10%)Cellnex’s updated Board composition exceeds the50% threshold for gender diversity2nd edition of the Cellnex Foundation programaiming at reducing the digital divide andcontributing to environmental sustainabilityCellnex is poised to unlock value inthe European tower landscape2022 financial outlook confirmedCellnex is fully committed to a value accretivedeployment of its remaining firepowerTrending to the upper end of the full year rangeCustomer loyalty to generate sustainable organicgrowthOur ability to crystallize long-term industrialopportunities with European MNOs remains intact(augmented TowerCo, FTTT, Small Cells, DAS )All operational and financial metrics aligned withCredibility – Cellnex has always delivered on itscommitments with the marketOpen to consider further options with allstakeholdersMNOs’ long-term industrial partnerValue accretive strategy through M&A and organicgrowthHutchison UK deal about to be closed2025 financial outlook (medium term guidance)ESG Master Plan on trackCredit quality has always been a key pillar of Cellnex’s decision making process(1) Under the current contract terms, plus agreement to acquire FTTT (fiber to the tower) on up to c.1,800 Cellnex sites and to jointly deploy indoor coverage solutions; (2) Revenues correspond to Operating Income excluding Advances to Customers (following the samemethodology as in note 20a in our Interim Consolidated Financial Statements ended 30 June 2022); (3) Adjusted EBITDA is an alternative performance measure (“APM”) as defined in the guidelines issued by the European Securities and Markets Authority on October 5,2015 on alternative performance measures (the “ESMA Guidelines”). Please see slide 23 for certain information on the limitations of APMs; (4) Recurring Leveraged Free Cash Flow ("RLFCF") is an APM. Please see slide 23 for certain information on the limitations of APMsResults January – June 20222
2022 outlookAll key metrics to increase every quarter due to current operations and the contributionfrom organic growth and change of perimeterRLFCF ( Mn) c.40%EFY22E vs. FY21Adjusted EBITDA ( Mn) 66%vs. Q1 2021 67%vs. Q1 20216342,650 – 2,700 53%vs. Q2 2021 57%vs. Q2 2021 c.40%EFY22E vs. FY216481,350 – 1,380337300Q1 2021Q1 2022Q2 2021Q3 2021Change ofperimeterResults January – June 2022Q4 2021Q3 2022EQ2 2022Q4 2022ETo be closed in Q3 20223
Status of integration processesAll integration processes on trackProjectCKH DKCKH SWPlayDeutscheTelekomCKH ITCyfrowyPolsatSFRResults January – June 2022TakeControlIntegrationAssessmentQ3 2022Industrial ModelIntegration Plan(7 months)Optimization(3 months)TransitionPre-closingClosingCKH UK85%53%4
Consistent strategy executionLeading independent TowerCo in Europe with up to c.138k sites, of which up to c.22k to be deployedthrough BTS programsSignificant footprint expansionGuidance 2025 ( Mn)Up toc.138ksites (1) (2)5,177 SitesRevenues1,881 Sites15,414 Sites20,870 SitesCountries with more than 1anchor tenant4,314 Sites32,003 Sites4,100 – 4,300 c.13%(c.85% contracted)CAGR 21-25(1) (2)2,474 SitesCountries with 1 anchortenantStrong targeted growth, highly contracted(2)4,920 SitesAdjusted EBITDA3,300 – 3,500RLFCF2,000 – 2,200 c.15%CAGR 21-25 c.21%CAGR 21-25Adjusted EBITDA Guidance 2025 (1) (3)6,826 Sites6,153 Sites11,315 SitesCellnex vs. Peers(‘000 ) Including transactions not yet closed (2) Before remediesResults January – June 2022c.5%82Vanatge138CellnexAmTc.80% fromcountries withsovereign rating ofat least Ac.11%c.9%c.29% 3.3Bn – 3.5Bnc.17%c.15%c.14%(3) Management estimate; including progress on BTS programs and 3rd party tenants5
ESG – Evolution of main KPIsAll key ESG initiatives being successfully implementedEBoosting our talent, being diverse and inclusiveGrowing with a long-term sustainableenvironmental approachClimate change (1)Sourcing of renewableelectricity (2)GSPeople202140%202270%2025100%Corporate Governance (4)2022 Q2 2022 2025Women in managementpositions (3)20212025-18%-45%30%20222025Hires of women (3)39%(1)(2)Hires of young talent20212025-8%-21%(3)2022 2022 Q290% 91%(3)2022 2022 Q2Independent directors2022% of appointments ofinternational Directors at HQ% of appointment ofinternational employees at HQ55%Non-executive directors2022 Q2 2022KPIs reported on an annual basis (Q4). Compared to the base year 2020 verified by an externalcertified entityEnergy targets refer to the energy directly managed by Cellnex (Scope 2). Data calculated according toSBT and GHG Protocol methodology applied to FY20 perimeter (new perimeter from M&A will beincluded not longer than 3 years after the integration’s year)Results January – June 202240%50%45%27%Reduction of absolute scope3 GHG emissions frompurchased goods andservices and capital goods2022 2022 Q2Women directors25% 26%2022 Q2Reduction of scope 1 and 2GHG emissions and scope 3GHG emissions from fuel andenergy-related activitiesShowing what we are, acting with integrity202560%45%2022 Q211%202220%30%2022 Q2100%202540%According to FY20 perimeter, excluding Edzcom. Change of perimeter impact will be included 3 yearsafter integration60%Directors with ESGcapabilities and/orexpertise73%20222022 Q225%Different nationalities inthe BoD(4) Data as of Q2 2022 reflect changes in BoD composition as of 18July 2022100%20222022 Q257Target2022 Q2 status6
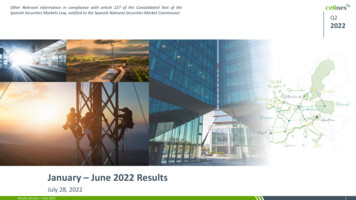
Q2 2022Business PerformanceResults January – June 2022SpainWanda Metropolitano stadium7
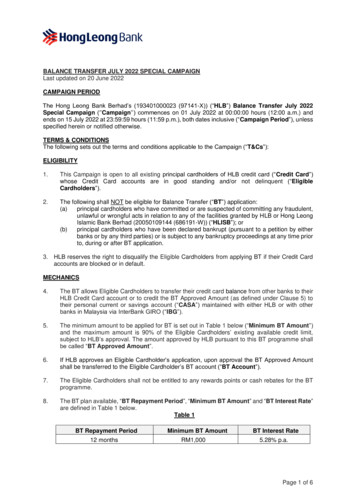
Q2 2022 performanceConsistent and solid organic growth generation, with a significant contribution from theprogress made on BTS programsPoPs – Revenues ( Mn)Results January – June 2022H1 2020H12021114,657H1 2021H1 2022RLFCF ( Mn)1,6906371,0612021H1H12021PoPs – Organic Growth394H1 2021H12022H1 2021H1 20228
Q2 2022 performanceRevenues, Adjusted EBITDA and RLFCFRevenues 59%, Adjusted EBITDA 59% and RLFCF 62%Metrics continue to show a strong performance compared to previous 0611,690Staff costsRepair and maintenanceUtilitiesGeneral and other services-91-32-57-77-122-44-134-108Operating Expenses-257-408Adjusted EBITDA% Margin without pass throughNet payment of lease liabilitiesMaintenance capital expendituresChanges in working capitalNet payment of interestIncome tax paymentNet dividends to non-controlling 140-370 59%Recurring Levered FCF394637 62%RLFCF ( Mn)Telecom Infrastructure ServicesBroadcasting InfrastructureOther Network ServicesRevenues 59% Telecom Infrastructure Services up mainly due to organic growth, BTS programsand acquisitions Revenues up 629Mn, of which c. 95Mn organic growthLike-for-like Opex flat (1), as a result of the efficiencies program in place Controlled impact from rising energy prices due to hedging and pass-throughmechanisms Margin expansion due to operating leverage and change of perimeter Taxes paid according to tax payments scheduleEfficient management of leases despite increased perimeterMaintenance Capex to perform as per guidance throughout the yearInterest paid consistent with capital structure in place and coupons paymentscheduleBackup Excel document available on Cellnex’s website(1) Including the contribution from efficiencies to payment of leases (not accounted for as Opex under IFRS 16) and excluding energy price increases that are passed-through to customersResults January – June 20229
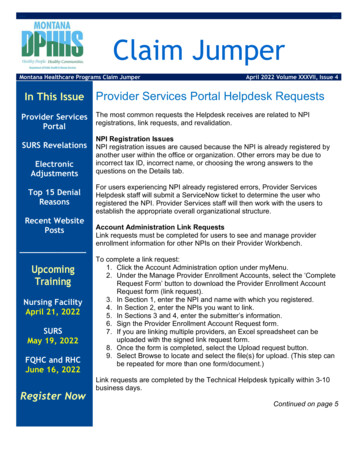
Q2 2022 performanceRecurring Levered Free Cash Flow (RLFCF)Organic growth impact on RLFCF c.25% 392 62%637 c.25%394 98 (1)BTS programs (2): 38MnEscalators/inflation: 28MnEfficiencies/synergies: c. 12MnNew colocations and associatedrevenues: 20MnH1 2021Organic growthChange ofperimeter (3)Mainly leases (4)H1 2022 Mn(1) This figure is different from the c. 95Mn organic growth shown in slide 9 (that corresponds to revenues growth – no conversion to EBITDA nor efficiencies)(2) Including FTTT and MO/CO projects with Bouygues Telecom in France (Nexloop)(3) 1 month CKH Sweden 1 quarter Play 5 months T-Infra 2 quarters CKH Italy, Polkomtel, Hivory, MEO (c.700 additional sites acquired) – group adaptation costs(4) Corresponds to the difference between the remaining RLFCF lines below Adjusted EBITDA (mainly payment of leases due to change of perimeter excluding efficiencies, maintenance Capex, change in WC, cash interest, cash tax and dividends to minorities)Results January – June 202210
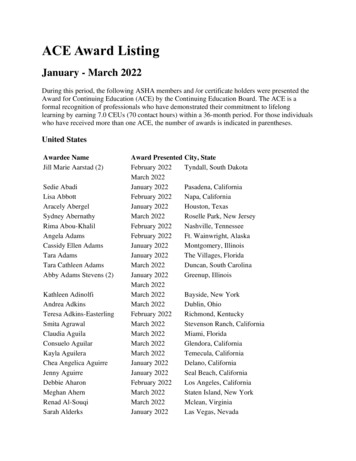
Q2 2022 performance2021 – 2025 plan: optimization of leases and network synergies on trackCellnex’s 2021-2025 efficiencies/synergies plan well on trackExpected to generate c. 90Mn- 100Mn efficiencies by 2025Site actionsEfficiencies/synergies 90Mn- 100Mn1,877c. 33Mn- 35Mn857c. 27Mn1Q12022 2H1202239M20224FY2022H120212022Q1Cumulative efficienciesgenerated during 2021 andH1 2022Q2-Q42021FY 2022ECumulative efficienciesgenerated during 2021 andFY 20222022FY2025ERent renegotiation: ground lease fee reduction with small or none initial paymentsCash advance: lump sum prepayment for long term leasehold contracts with optionally small remaining recurring annual paymentsLand acquisition: purchase of lands or acquisition of freehold rights on landsLeases and Capex reduction thanks to two or more anchor tenant networks allowing for decommissioning of redundant sites and asingle BTS for more than one anchor tenant simultaneouslyResults January – June 202211
Q2 2022 performanceBalance sheet and consolidated income statementBalance Sheet ( Mn)Dec2021Jun2022Non Current Assets36,67636,892GoodwillFixed AssetsRight of UseFinancial Investments & Other Fin. nt Assets5,0853,726InventoriesTrade and Other ReceivablesCash and Cash EquivalentsNon-current assets held for sale31,1563,927051,2522,469243Total Assets41,76140,861Shareholders' Equity15,83014,175ccNon Current LiabilitiesBorrowingsLease LiabilitiesProvisions and Other 5,727aCurrent LiabilitiesBorrowingsLease LiabilitiesProvisions and Other LiabilitiesLiabi assoc with non-current assets held for saleTotal Equity and 6840,861Net Debt (3)14,53616,852Income Statement ( ng Expenses-257-408Non-recurring expensesDepreciation & amortization-49-678-51-1,132Operating Profit7799Net financial profitIncome taxAttributable to non-controlling interests-2549614-3567513Net Profit Attributable to the Parent Company-67-170bPrudent PPA (1) process leads to allocation to fixed assetsGoodwill unrelated to cash paid over the course of M&A activity (2) a b ca dThe adoption of IFRS 16 helps the leverage comparability among peers,as it equalizes the treatment of both land ownership and themanagement of ground leasesStrong liquidity position mainly due to cash generated and the issuanceof debt instrumentsCellnex has made the most from current market conditions and ownshares 1% at 42.5 average price under discretionary Treasury SharesTransactionsNet income mostly reflects: D&A charges (prudent PPA process)Net interest increase due to strengthened liquidity positiond(1) Purchase Price Allocation; (2) The goodwill arising from business combinations primarily corresponds to the net deferred tax liability resulting from the higher fair value attributed to the net assets acquired compared to their tax base. Please see note 6 in ourInterim Consolidated Financial Statements ended 30 June 2022; (3) Net Financial Debt is an alternative performance measure (“APM”) as defined in the guidelines issued by the European Securities and Markets Authority on October 5, 2015 on alternativeperformance measures (the “ESMA Guidelines”). Please see slide 23 for certain information on the limitations of APMsResults January – June 202212
Q2 2022 performanceFinancial structure as of June 2022 – Excluding IFRS 16 impactTotal available and fully contracted liquidity of c. 7.6Bn280151800699584Refinanced60020228075002023EUR Straight Bonds 9.9Bn20241000 NEW 0020252026EUR Conv. Bonds 3.2Bn850186EUR Priv. Bonds 0.3BnEUR Bank Debt 0.7Bn750202910002030GBP Local Bank Debt/Bond (1) 1.2Bn85020312032CHF Local Bank Debt/Bonds 1Bn125057820332041USD Bank Debt/Bonds (2) 0.5BnKey highlights Liquidity of c. 7.6Bn: c. 2.5Bn cash and c. 5.1Bn undrawn credit lines Fixed rate debt 86% Gross debt c. 16.8Bn (Bonds and Other Instruments) Net debt c. 14.3Bn Covenants: Cellnex Finance debt without financial covenants, pledges or guaranteesFigures in Mn(1) Includes EUR bonds swapped to GBP(2) Includes USD bonds swapped to EUR(3) 50% of the issuance has been swapped to a variable rateResults January – June 202213
Frequently AskedQuestionsResults January – June 2022SwitzerlandRural Site14
Frequently Asked QuestionsCellnex’s strategy disciplineCellnex has always remained disciplined when executing M&A, walking away from deals whichdid not fit with its strategy or were based on sub-standard MSA/MLAsMerger with an EUTelco towers divisionOpportunities not crystallizedContract terms notmarket standardMerger with anMNO-captiveTowerCoAcquisition of amid- sized portfoliofrom a local TelcoUnattractive valuationUnattractive valuationUnattractive valuation& contract terms notmarket standardContract terms notmarket standardAcquisition of arelevant portfoliofrom an EU TelcoAcquisition of a smallportfolio from a localTowerCoAcquisition of a midsized portfolio from alocal TelcoUnattractive valuationUnattractive valuationUnattractive valuation20182019Disagreement aroundcorporate governanceAcquisition of a ruralportfolioMerger with an EUTelco towers divisionUnattractive valuation& low organic growthprospects2016Results January – June 20222017Acquisition of arelevant portfoliofrom an EU TelcoAcquisition of anindependentTowerCo20202021Acquisition of GDTowersInability to play anindustrial roleAcquisition of a midsized portfolio from alocal TelcoUnattractive valuation& low organic growthprospects202215
Frequently Asked QuestionsIntangible principles that shape Cellnex’s decisionsICellnex signs NDAs (1) over the course of M&A processes, limiting our capacity to disclosedetails Cellnex has always listened to its investors and honoured its public commitments Cellnex and neutrality have always gone hand in hand: neutrality needs to be preserved tocontinue generating sustainable organic growth from all MNOs Cellnex has publicly committed to strict M&A criteria and all transactions signed have met:(i) 10% equity IRR (project stand-alone basis), (ii) RLFCF per share accretion from year 2/3onwards (consolidated basis) and, (iii) increased de-leveraging capacity post-deal Industrial role and long-term commitment that generates subsequent opportunities Alignment with Cellnex’s governance standards Significant valuation gap between private deals and publicly listed entitiesCredibility and consistencyIIIIIIV ValuationNeutralityFinancial, strategic andgovernance discipline(1) Non-disclosure agreementsResults January – June 202216
Frequently Asked QuestionsWhat is Cellnex’s firepower?Targeted pipeline of up to c. 18Bn (1), of which c. 10.4Bn (2) already committedCrystallization of Identified OpportunitiesTRANSACTIONSTRUCTUREFLEXIBILITYc. 18BnShare DealAdditionalFirepowerc. ormationalDeals (4)CashTowerAdjacentProjects(5)BTSProjectsAsset DealTheAugmentedTowerCoGrowth deals (3)Cellnexshares (6)Polkomtelc. 2.2BnACTIVELY ASSESSING OPPORTUNITIES Hivoryc. 6.1BnNON-BINDINGBINDINGT-Mobile NLEXCLUSIVITY(1) Based on EV and including BTS programs; (2) Taking into account the agreement with Deutsche Telekom in the Netherlands (c. 0.7Bn), the acquisition of Hivory in France (c. 6.1Bn) and Polkomtel Infrastruktura in Poland (c. 2.2Bn), including BTS committed andother M&A deals; (3) Net investment of c. 1.4Bn investments of c. 2.5Bn - expected cash-in from disposals of c. 1.1Bn (subject to antitrust bodies approval), being investments:c. 2.5Bn c. 1.5Bn investments in France c. 0.6Bn other investments (including latest agreements signed with NOS, Meo, FTTT partnership with another anchor tenant among others) c. 0.1Bn substitutive tax eligibility investment (improves RLFCF) c. 0.3Bn ownshares (improves RLFCF per share) and expected cash-in from disposals of c. 1.1Bn (please see Q4 2021 results presentation, slide 14); (4) Transactions involving an asset combination or other transformational business opportunities with large MNOs involving thecontribution of more than 15,000 sites in a single transaction, in which Cellnex could acquire these infrastructures in exchange for cash and/or issuances of new shares (payment in kind); (5) 5G, Small cells, DAS, IoT, FTTT, data centers/edge computing, fiber and radioactive network; (6) Payment in shares at either country or Group listed levelResults January – June 202217
Frequently Asked QuestionsWhat’s next?Our ability to crystallize long-term industrial opportunities with European MNOs remains intact1Cellnex has still a targeted pipeline of c. 7.6Bn, to be committed in the next quarters2Selective growth will continue to be a key pillar of our equity story, along with organic growth, efficiencies and new connectivity services3Opportunistic buy-back of Cellnex securities as long as credit profile is enhancedResults January – June 202218
Frequently Asked QuestionsESG highlightsEGSPublication of the second Environment and Climate Change reportEnvironment and Climate Change report 2021 makes an in-depth analysis of the activityin the twelve countries where operates. Cellnex measures the activity footprint andshows significant progress on this path towards addressing climate change, promotingthe circular economy, protecting biodiversity and strengthening the ambition tobecome an emissions-neutral company. More info: https://bit.ly/3NEwBrWEnvironment and Climate Change Report 2021EGSThe second edition of the Cellnex Foundation accelerationprogramme for start-ups kicks offAfter the success of the first edition, the Cellnex Bridge programme is again searching forstart-ups with a social impact that provide solutions to the double challenge of reducingthe digital divide and contributing to environmental sustainability.The call, open until 18 July, will select up to 6 start-ups that will take part in anacceleration programme together with expert mentors who will guide them in thedevelopment of their project. More info: https://bit.ly/3yFrwubEGSCellnex’s updates its Board composition, exceeding the 50%threshold for gender diversityWith the incorporation of Ana García Fau onto Cellnex’s Board of Directors, the numberof women in the BoD rises to six out of a total of eleven (55%), independent membersaccounts at eight (73%) and ten non-executive directors representing 91% in thecompany’s highest governing body. More info: https://bit.ly/3P4UDwfResults January – June 2022Cellnex has launched its new websiteThe focus of the new multi-country, multi-language and multi-device portal isto publicise the solutions and technologies the company offers to facilitateconnectivity for both people and territories.The portal also provides improved transparency and better access toinformation concerning the Group’s ESG policies, Corporate Governance andinformation to shareholders.Sustainability and ESG dedicated section19
DefinitionsTermDefinitionAdjusted EBITDAProfit from operations before D&A and after adding back certain non-recurring and non-cash items (such as advances to customers and prepaid expenses). Adjusted EBITDA is anAPM. Please see slide 23 for certain information on the limitations of APMsAdjusted EBITDA marginAdjusted EBITDA divided by total revenues excluding elements pass-through to customers from both expenses and revenues. Adjusted EBITDA margin is an APM. Please see slide23 for certain information on the limitations of APMsAnchor tenant/customerAnchor customers are telecom operators from which the Company has acquired assetsBacklogRepresents management’s estimate of the amount of contracted revenues that Cellnex expects will result in future revenue from certain existing contracts. This amount is basedon a number of assumptions and estimates, including assumptions related to the performance of a number of the existing contracts at a particular date but do not includeadjustments for inflation. One of the main assumptions relates to the contract renewals, and in accordance with the consolidated financial statements, contracts for services haverenewable terms including, in some cases, ‘all or nothing’ clauses and in some instances may be cancelled under certain circumstances by the customer at short notice withoutpenalty.Build-to-suit (BTS) CapexCorresponds to committed Build-to-Suit programs (consisting of sites, backhaul, backbone, edge computing centers, DAS nodes or any other type of telecommunicationinfrastructure as well as any advanced payment related to it or further initiatives) and also adjacent Engineering Services that have been contracted with different clients,including ad-hoc capex eventually requiredCustomer RatioThe customer ratio relates to the average number of operators in each site. It is obtained by dividing the number of PoPs by the average number of Telecom InfrastructureServices sites in the yearDASA distributed antenna system is a network of spatially separated antenna nodes connected to a common source via a transport medium that provides wireless service within ageographic area or structure agreed with clientsExpansion CapexInvestment related to business expansion that generates additional RLFCF, including among others, decommissioning, telecom site adaptation for new tenants, EngineeringServices and prepayments of land leases. Expansion Capex is an APM. Please see slide 23 for certain information on the limitations of APMsEngineering ServicesOn request of its customers Cellnex carries out certain works and studies such as adaptation, engineering and design services, whichrepresent a separate income stream and performance obligation. The costs incurred in relation to these services can be internal expense or outsourced. The revenue in relationto these services is generally recognized as the capital expense is incurredMaintenance CapexInvestments in existing tangible or intangible assets, such as investment in infrastructure, equipment and information technology systems, and are primarily linked to keepinginfrastructures, active and passive equipment, in good working order. Maintenance Capex is an APM. Please see slide 23 for certain information on the limitations of APMsM&A CapexInvestments in shareholdings of companies, significant investments in acquiring portfolios of sites and/or land. M&A Capex is an APM. Please see slide 23 for certain informationon the limitations of APMsResults January – June 202220
DefinitionsTermDefinitionMNOMobile Network OperatorNet DebtExcludes PROFIT grants and loansNew colocations and associatedrevenuesIncludes new third party colocations as well as further initiatives carried out in the period such as special connectivity projects (please see slide 8 Q320 Results Presentation orslide 22 Q1 2021 Results Presentation), indoor connectivity solutions based on DAS (please see slide 7 Q120), mobile edge computing (please see slide 7 Q220), fiber backhauling,site configuration changes as a result of 5G rollout and other Engineering ServicesNodeA Node receives from the fiber optical signal from several MNOs and transforms it into radio frequency signal to transfer it to antennas after amplifying it. The definition of a Nodeis always subject to managements view, and could be reviewed as new configurations might occur following technological developments.Please note that Nodes that generate revenues for Cellnex but that are not hosted by Cellnex (marketing rights) may be excluded from the Company’s reported KPIsPoP (Point of Presence)A customer configuration based on the most typical technological specifications for a site within which the active equipment and antennas are owned by the customer or byCellnex. The definition of PoP is always subject to management’s view, independently of the technology used or type of service such customer provides.In the 5G/IoT network ecosystem, this definition of PoP could be reviewed as new customer configurations might also be considered a PoP, especially in relation to new siteadjacent asset classes, subject again to the management's view.Please note that PoPs that generate revenues for Cellnex but that are not hosted on sites owned by Cellnex (marketing rights) may be excluded from the Company’s reported KPIsRevenuesRevenues correspond to Operating Income excluding Advances to customers (please see note 20a in our Interim Consolidated Financial Statements ended 30 June 2022)RLFCFRecurring Operating Free Cash Flow plus/minus changes in working capital, plus interest received, minus interest expense paid, minus income tax paid, and minus minorities.Recurring Leveraged Free Cash Flow ("RLFCF") is an APMs. Please see slide 23 for certain information on the limitations of APMsTISTelecom Infrastructure ServicesResults January – June 202221
DisclaimerThe information and forward-looking statements contained in this presentation have not been verified by an independent entity and the accuracy, completeness or correctness thereof should not be relied upon. In this regard,the persons to whom this presentation is delivered are invited to refer to the documentation published or registered by Cellnex Telecom, S.A. and its subsidiaries (“Cellnex”) with the National Stock Market Commission in Spain(Comisión Nacional del Mercado de Valores). All forecasts and other statements included in this presentation that are not statements of historical fact, including, without limitation, those regarding the financial position,business strategy, management plans, estimated investments and capital expenditures, pipeline, priorities, targets, outlook, guidance, objectives for future operations and run rate metrics of Cellnex (which term includes itssubsidiaries and investees), are forward-looking statements. These forward-looking statements involve known and unknown risks, uncertainties and other factors (many of which are beyond Cellnex’s control), which may causeactual results, performance or achievements of Cellnex, or industry results, to be materially different from those expressed or implied by these forward-looking statements. These forward-looking statements are based onnumerous assumptions regarding Cellnex‘s present and future business strategies, performance by Cellnex's counterparties under certain of Cellnex's contracts and the environment in which Cellnex expects to operate in thefuture which may not be fulfilled. No representation or warrant, express or implied is made that any forward-looking statement will come to pass. In particular, this presentation contains information on Cellnex’s targets,outlook and guidance, which should not be construed as profit forecasts. There can be no assurance that these targets, outlook and guidance will be met. Accordingly, undue reliance should not be placed on any forwardlooking statement contained in this presentation. All forward-looking statements and other statements herein are only as of the date of this presentation. None of Cellnex nor any of its affiliates, advisors or representatives, norany of their respective directors, officers, employees or agents, shall bear any liability (in negligence or otherwise) for any loss arising from any use of this presentation or its contents (including any forward-looking statement),or otherwise in connection herewith, and they do not undertake any obligation to provide the recipients with access to additional information or to update this presentation or to correct any inaccuracies in the informationcontained or referred to herein.To the extent available, the industry and market data contained in this presentation has come from official or third party sources. Third party industry publications, studies and surveys generally state that the data containedtherein have been obtained from sources believed to be reliable, but that there is no guarantee of the accuracy or completeness of such data. In addition, certain of the industry and market data contained in thispresentation come from Cellnex's own internal research and estimates based on the knowledge and experience of Cellnex's management in the market in which Cellnex operates, and is subject to change. Certain informationcontained herein is based on Cellnex's management information and estimates and has not been audited or reviewed by Cellnex's auditors. Recipi
Credit quality has always been a key pillar of Cellnex's decision making process. 3 2022 outlook Q1 2021 Q2 2021. . Evolution of main KPIs. 2022 Q2 status. S. Boosting our talent, being diverse and inclusive . Represents management's estimate of the amount of contracted revenues that Cellnex expects will result in future revenue from .