Transcription
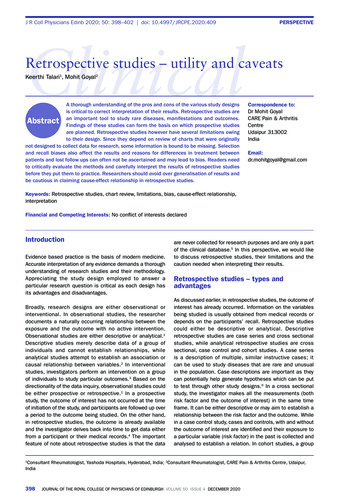
USING RETROSPECTIVE POST DATA FROM QUALTRICSApril 2020This document shows how to export retrospective post data from Qualtrics and use it to create the same summary tablenumbers seen in results produced by Organizational Development for scan forms.Visualizing the End Product The goal is to take the output for retrospective post items from the default report in Qualtrics and reproducethe two summary tables below in Excel. Organizational Development provides these tables as a matter ofstandard procedure for any scan form with retrospective post items.1
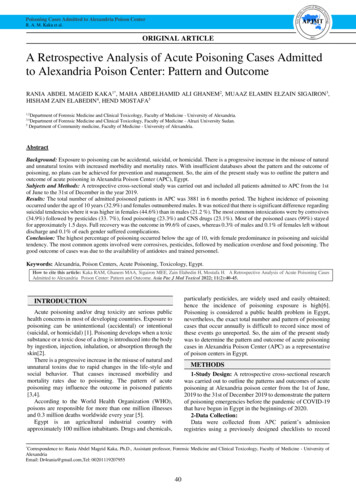
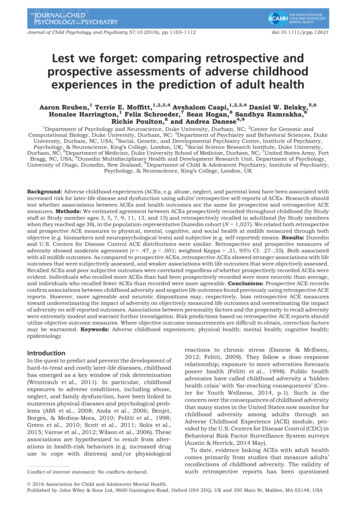
The Retrospective Post Below is a retrospective post question built in Qualtrics. It has the standard BEFORE and AFTER columns with thefour-point scale for level of understanding. This question was part of survey at the conclusion of an onlineprogram on irrigation practices. It has seven items related to the program content.Default Report in Qualtrics The default report in Qualtrics produces a chart and tables. The chart (below) is cluttered with all seven itemsand difficult to interpret. It is not usable.2
The tables, on the other hand, contains the pieces of information needed to generate summary table numbers(example below for BEFORE). This same table is produced by Qualtrics for both the BEFORE and AFTER portionsof the retrospective post for each item. Note it contains the mean value for each item along with the frequencyand percent for each point on the scale (Poor, Fair, Good, Excellent).Export Retrospective Post of the Default Report Export just the retrospective post items to CSV format.While in the default report, click on “Share Report”and select “CSV (Comma Separated).”This brings up the “Export Report” interface. Click on“Select All” which actually deselects all the checkboxes. Then click on just the two retrospective postitems. Click on Export Pages.3
This exports the retrospective post tables to your Downloads folder in CSV format, which is usable by Excel. Open the .csv file in Excel. Note it has the relevant tables from Qualtrics for all seven items on both the BEFOREand AFTER columns (see below). Now, it is just a matter of using Excel to produce the summary table numbers.4
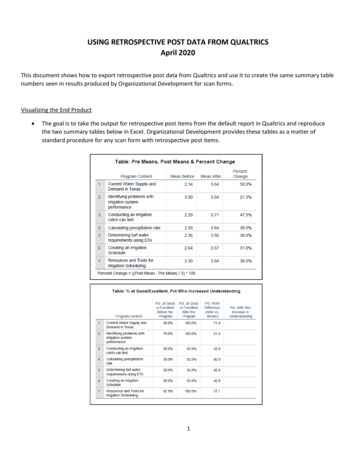
Using Excel to Produce Summary Table Numbers First, calculate the percent change in means. Remember, percent change for a scale item has a different formulathan the traditional calculation of percent change. The formula is (after mean – before mean) / 3 (for a fourpoint scale). Out to the right, on the same column as the first retrospective post item, enter the calculation. Theafter mean (cell E26 - blue square below) – the before mean (cell E7 – red square below) / 3.For the first item, the percent change is 0.50. Format to be a percent with one decimal so it appears as 50.0%.Then simply copy that calculation to the other six items (see below). You now have the percent change in meansfor all seven retrospective post items.5
Second, calculate the percentage of respondents at the top two levels of understanding (Good or Excellent) –before and after the program – for each of the seven retrospective post items. Again, out to the right on thesame column as the first item, enter the calculation. The “good” percentage (cell G16 - blue square below) the“excellent” percentage (cell I16 – red square below).For the first items, the combined percentage is 28.57% (since the percentage at Excellent was 0). Then copy thecalculation to the other BEFORE items.Then copy the same calculation to the AFTER items.6
At this point, you can move cells in the spreadsheet to better resemble a table. Here the BEFORE and AFTERmeans were copied from the original table to the left of the “Percent Change in Means” calculation. Do the same for the percentage of respondents at “good” or“excellent.” Move cells so the BEFORE and AFTER columns arenext to each other. Then do the final calculation – the Pct.Point Difference which is simply the difference between thetwo percentages (After – Before) * 100. Multiply by 100 prepares theresulting calculation for formatting from a percentage to a number.Format the result to be a number with one decimal place. The calculations are complete. Save your spreadsheet! You now haveall the numbers that go into the same summary table typicallyproduced by Organizational Development – with one exception –Percent of Respondents with Any Increase in Understanding. Thiscalculation is not possible with the export of the report. It requiresexporting the raw data and doing record-level calculations, which isbeyond the scope of this help guide. The next page shows the summary numbers in the Excel spreadsheet vs. the summary numbers produced byOrganizational Development using SPSS.7
Texas A&M AgriLife Extension Service, Organizational DevelopmentApril 20208
This document shows how to export retrospective post data from Qualtrics and use it to create the same summary table numbers seen in results produced by Organizational Development for scan forms. Visualizing the End Product The goal is to take the output for retrospective post items from the default report in Qualtrics and reproduce