Transcription
The Prudential Series FundANNUAL REPORTDecember 31, 2017Jennison 20/20 Focus PortfolioBased on the variable contract you own or the portfolios you invested in, you mayreceive additional reports that provide financial information on those investmentchoices. Please refer to your variable annuity or variable life insurance contractprospectus to determine which portfolios are available to you.The views expressed in this report and information about the Fund’s portfolio holdingsare for the period covered by this report and are subject to change thereafter.Please note that this document may include prospectus supplements that areseparate from and not a part of this report. Please refer to your variable annuity orvariable life insurance contract prospectus to determine which supplements areapplicable to you.
Join the e-movement.Enroll in e-delivery today!SMBy enrolling in e-Delivery, you’ll gain secure, online access to important documents with theflexibility to choose which documents you receive in the mail and which ones you don’t!Individual Annuity Contract OwnersGet started by visiting www.prudentialannuities.com/investor/edelivery and follow the instructionson the screen, or scan the code below.Individual Life Insurance Contract OwnersTo receive your reports online, go to www.prudential.com/edelivery, or scan the code below.Group Variable Universal Life Contract OwnersTo receive your reports online, go to www.prudential.com/gulgvul, or scan the code.Save paper and reduce clutter.Receive Prospectuses and Reportselectronically by enrolling today!
The Prudential Series FundTable of Contents䡲 LETTER TO CONTRACT OWNERS䡲 MARKET OVERVIEW䡲 REPORT OF THE INVESTMENT MANAGER䡲 BENCHMARK GLOSSARY䡲 PRESENTATION OF PORTFOLIO HOLDINGS䡲 FEES AND EXPENSES䡲 FINANCIAL REPORTSSection ASection BSection CSection DSection ESchedule of Investments and Financial StatementsNotes to Financial StatementsFinancial HighlightsReport of Independent Registered Public Accounting FirmInformation about Trustees and Officers䡲 PROXY VOTING RESULTSAnnual ReportDecember 31, 2017
[THIS PAGE INTENTIONALLY LEFT BLANK]
The Prudential Series FundLetter to Contract OwnersAnnual ReportDecember 31, 2017䡲 DEAR CONTRACT OWNERAt Prudential, our primary objective is to help investors achieve and maintain long-term financial success. This Prudential SeriesFund annual report outlines our efforts to achieve this goal. We hope you find it informative and useful.Prudential has been building on a heritage of success for more than 135 years. We believe the array of our products provides ahighly attractive value proposition to clients like you who are focused on financial security.Your financial professional is the best resource to help you make the most informed investment decisions. Together, you canbuild a diversified investment portfolio that aligns with your long-term financial goals. Please keep in mind that diversificationand asset allocation strategies do not assure a profit or protect against loss in declining markets.Thank you for selecting Prudential as one of your financial partners. We value your trust and appreciate the opportunity to helpyou achieve financial security.Sincerely,Timothy S. CroninPresident,The Prudential Series FundJanuary 31, 2018
[THIS PAGE INTENTIONALLY LEFT BLANK]
Market Overview — unauditedAnnual ReportDecember 31, 2017Equity Market OverviewStocks markets around the world rallied in 2017 bolstered by reports of accelerating global economic growth. Equities in emerging markets postedthe best returns. In the United States, the S&P 500 Index rose 21.82% and generated positive returns every month of the period.Market and economic highlightsU.S. stocks performed well in the first quarter driven by investors’ hopes for tax cuts, a rise in consumer spending and corporate profits, andregulatory reforms. Positive economic news abroad also increased appetite for equities. In March, the Federal Reserve raised its target for the shortterm federal funds rate by 0.25%, and would proceed to do so again in June and December. Central banks in several other countries scaled back theirquantitative-easing efforts.Second-quarter corporate profits were strong. In August, stocks retreated in reaction to mounting tensions between the U.S. and North Korea, but thepullback was short-lived. During the fourth quarter, stocks advanced again on positive corporate earnings, and in anticipation of tax reform.Corporate earnings rose at double-digit levels in Europe and Japan in the third quarter.In late December, President Donald J. Trump signed the Tax Cuts and Jobs Act into law, reducing the corporate tax rate from 35% to 21% (effective 2018).Following a sluggish first quarter, Gross Domestic Product (GDP) growth rose above 3% in the second and third quarters, yet inflation remainedtame. The unemployment rate fell to 4.1% — its lowest level since 2000, and investment by businesses picked up. Unemployment also dropped inmany other nations including Germany, the United Kingdom, and Japan. The U.S. dollar closed the year sharply lower against other major currencies.Information technology stocks soarFor the 12 months, nine of the S&P 500’s 11 sectors turned in double-digit returns, and only two ended in negative territory. Information technologyled with a return of 38.83%. Demand for cyclical stocks was strong. The materials sector was the second-best performer, rising 23.84%, followed byconsumer discretionary, up 22.98%. Next in line was the financial sector, which gained 22.18%. Rising interest rates, which increase lenders’ profitmargins; solid earnings, and a loosening of regulations boosted demand for this group. Investors snapped up health care stocks, which rose 22.08%in anticipation of health care reform. The industrials and consumer staples sectors followed, returning 21.03% and 13.49%, respectively.Despite their favorable dividends, the defensive utilities and real estate sectors lagged but returned an impressive 12.11% and 10.85%, respectively.Telecommunications stocks, facing competitive pressures from cable companies, ended down 1.25%. Energy stocks finished down 1.01%. Their pricesfell sharply during the first half of the year as oil prices tumbled, although both the sector and oil prices rebounded later in the year.Growth and large-cap stocks outperform in Russell IndexesThe Russell US indexes, which measure equity performance with respect to stock-specific styles (value and growth) and capitalization levels (small-,mid-, and large-cap), ended 2017 higher. For the year, the Russell 1000 Growth Index returned 30.21%, almost doubling the Russell 1000 ValueIndex’s 13.66% return. Growth outperformed due in part to huge gains of large-cap tech stocks. By contrast, the energy sector detracted from valuestocks’ performance. Large-cap equities, as measured by the Russell 1000 Index, gained 21.69%. The sector was bolstered by a pickup in economicactivity abroad, U.S. dollar weakness, and rising short-term rates The Russell Midcap Index returned 18.52%. Small-caps, as measured by theRussell 2000 Index, returned 14.65%.Emerging markets lead international marketsEquities trading in emerging markets, particularly technology and financial issues, soared on reports of improving earnings and fundamentals. TheMSCI Emerging Markets Index, net of dividends, rose 37.28% in U.S. dollars and 30.55% in local-currency terms. In U.S. dollars, Far East and Asianstocks rallied 43.53% and 42.83%, respectively. The Brazil, Russia, India, and China (BRIC) group advanced 41.75%, EMEA returned 24.54%. LatinAmerica rose 23.74%, and Europe returned 20.54%.On a country basis, Poland led with a return of 54.72%. China followed posting a return of 54.07%, and South Korea advanced 47.30%. Conversely,Pakistan, in contrast to its stellar performance in 2016, finished down 24.44%. Qatar dropped 11.51%.The MSCI-EAFE Index, which measures the performance of developed markets excluding the United States and Canada, returned (net of dividends)25.03% in U.S dollars and 15.23% in local-currency terms. In U.S. dollars, the best-performing markets were Austria, which returned 58.31%; HongKong, which rose 36.17%, and Denmark, which advanced 34.69%.In the Pacific region, Singapore followed Hong Kong with a gain of 35.57%. Japan rose 23.99% driven by reports of explosive corporate earnings,increased trade, and monetary stimulus. Eurozone equities benefitted from a rise in consumer confidence and diminishing political uncertainty.“Heavy weights” in this group that performed well included France, which rose 28.75%; Italy, which advanced 28.43%; Germany, which returned27.70%; and the United Kingdom, which gained 22.30%. Israel bucked the trend, returning merely 2.06%.
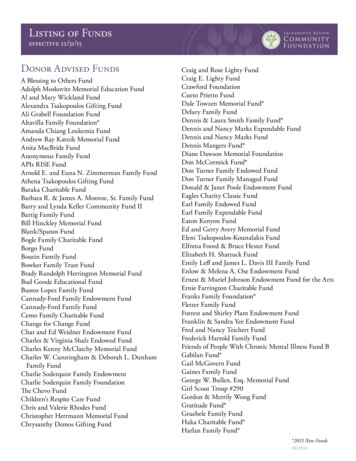
The Prudential Series Fund, Jennison 20/20 Focus PortfolioDecember 31, 2017Report of the Investment Manager - As of December 31, 2017 (Unaudited)Average Annual Total Returns1-Year5-YearsPortfolio: Class I30.28%14.38%7.99%Portfolio: Class II29.7413.927.58 Russell 1000 Index21.6915.718.59S&P 500 Index21.8215.788.49 10,000 INVESTED OVER 10 YEARS10-Years 25,000 21,578 Portfolio (Class I)1 22,589 S&P 500 Index 20,000 15,000Portfolio performance is net of investment fees and fund expenses, but not contract charges, which, ifincluded, would significantly lower the performance quoted. The Russell 1000 Index is a trademark/service mark of the Frank Russell Company. Russell is a trademark of the Frank Russell Company.Performance figures may reflect fee waivers and/or expense reimbursements. In the absence of suchfee waivers and/or expense reimbursements, total returns would be lower. 10,000 5,000 2/31/1312/31/1412/31/1512/31/1612/31/17Past performance does not guarantee future returns. The investment return and principal value ofan investment will fluctuate, so that an investor’s shares, when redeemed, may be worth more orless than their original cost. Current performance may be lower or higher than the pastperformance data quoted.For the year ended December 31, 2017, the Jennison 20/20 Focus Portfolio’s Class I shares returned 30.28% and Class II shares returned 29.74%. Thenet assets of the Portfolio at December 31, 2017 were 225.1 million.The Portfolio’s investment objective is long-term growth of capital. The Portfolio is subadvised by Jennison Associates LLC.What were market conditions during the reporting period?Equity markets posted a solid finish to a strong 2017. Gains were broad, but particularly notable among companies with above-average earningsgrowth. US gross domestic product (GDP) expansion accelerated, surpassing 3% for the second quarter in a row, and subsequently most leadingeconomic indicators and sentiment gauges reflected expectations for economic activity to continue to strengthen. Short-term interest rates pushedhigher as the Federal Reserve raised interest rates three times over the course of the year. Longer-term US yields rallied, leaving the Treasury yieldcurve at the flattest level in more than a decade. US dollar weakness continued as global growth expanded and accelerated.Major tax legislation was the most significant win for the Trump administration’s inaugural year. The tax package includes a substantial reduction inthe tax rate paid by corporations on domestically earned income.Abroad, Europe’s economic recovery continued, and emerging markets posted their best annual performance since the aftermath of the financial crisis.Nine of the 11 sectors in the S&P 500 Index (the Index) returned double-digit performance. Information technology, materials, and consumerdiscretionary generated the largest gains; energy and telecom services were the only two negative sectors. Unlike in 2016, there was significantperformance disparity among market segments. Although both posted double-digit returns, growth-style stocks outperformed value-style stocks.What strategies or holdings affected the Portfolio’s performance?Relative to the Index, both stock selection and an overweight allocation (holding more shares than that of Index) to the information technology sectorpositively contributed to Portfolio performance. Stock selection within consumer discretionary and staples names also helped. Conversely, stockselection within the health care industry, specifically the Portfolio’s biotechnology and pharmaceutical names, detracted. Stock selection withinfinancials hurt relative performance, with names such as Goldman Sachs Group hindering the Portfolio’s performance.The top contributors included Alibaba, one of the world’s largest e-commerce companies, after third-quarter results beat consensus expectations onmost key metrics. In Jennison’s view, the strong results suggest deeper engagement of buyers, merchants, advertisers, and cloud customers. Tencent,China’s largest and most visited Internet service portal, continues to benefit from its dominant position in China’s online gaming and instantmessaging markets and its growing advertising and payment service efforts. Another holding, Nvidia, has transformed itself from a personalcomputer-centric graphics provider to a company focused on key high-growth markets. It appears to be uniquely positioned in the gaming, automotive,and high-performance computing, cloud, and enterprise markets. Developers have coalesced and standardized around Nvidia’s architecture andplatform, potentially driving several years of strong top-line growth. After the stock’s outperformance, profits were taken, and the Portfolio no longerholds a position in Nvidia.Among the notable detractors were oil and gas exploration and production firms EOG Resources and Noble Energy. Both companies underperformed despite therising price of crude oil over the course of the year, likely due to overall negative energy sentiment. However, EOG Resources’ third-quarter results topped consensusestimates, illustrating that the company has been able to quickly add cheaper sources of oil to its mix. Jennison believes the company is a leader with some of thebest assets in South and West Texas, as well as the lowest cost structure and highest returns. Share prices of Noble Resources fell as a large-scale opportunity inIsrael led to overspending in the near term, which, in a weak oil market, was viewed negatively by the market.Another notable detractor was biotechnology firm Shire plc, which has product franchises in neuroscience, gastrointestinal, and rare diseases, andwhich announced plans to divest its neuroscience business, producing increased uncertainty about the company’s strategy. Subsequently, the positionwas eliminated in favor of more attractive investment opportunities.1The graph is based on the performance of Class I shares. Performance of Class II shares will be lower due to differences in the fee structure. Class II shares haveassociated 12b-1 and administrative fees at an annual rate of 0.25% and 0.15%, respectively, of the average daily net assets of the Class II shares.For a complete list of holdings, refer to the Schedule of Investments section of this report.1
The Prudential Series FundBenchmark Glossary — unauditedDecember 31, 2017The indexes are unmanaged and include reinvestment of any income or distributions. They do not reflect any fees,expenses or sales charges. Investors cannot invest directly in a market index.For Russell Indexes: Russell Investment Group is the source and owner of the trademarks, service marks and copyrightsrelated to the Russell Indexes. Russell is a trademark of Russell Investment Group.Russell 1000 Index is an unmanaged market cap-weighted index that measures the performance of the 1,000 largestcompanies in the Russell 3000 Index, which represents approximately 92% of the total market.S&P 500 Index is an unmanaged, market value-weighted index of over 500 stocks generally representative of the broadstock market.
The Prudential Series FundPresentation of Portfolio Holdings — unauditedJennison 20/20 FocusFive Largest HoldingsMicrosoft Corp.Texas Instruments, Inc.JPMorgan Chase & Co.PNC Financial Services Group, Inc. (The)Apple, Inc.December 31, 2017(% of Net Assets)5.4%5.1%5.1%4.5%3.1%For a complete list of holdings, please refer to the Schedule of Investments section of this report. Holdings reflect only long-terminvestments. Holdings/Issues/Sectors/Industries are subject to change.
The Prudential Series FundFees and Expenses — unauditedDecember 31, 2017As a contract owner investing in the Portfolio through a variable annuity or variable life contract, you incur ongoing costs, includingmanagement fees, and other Portfolio expenses. This example is intended to help you understand your ongoing costs (in dollars) ofinvesting in the Fund and to compare these costs with the ongoing costs of investing in other investment options. This example doesnot reflect fees and charges under your variable annuity or variable life contract. If contract charges were included, the costs shownbelow would be higher. Please consult the prospectus for your contract for more information about contract fees and charges.The example is based on an investment of 1,000 invested at the beginning of the period and held for the entire period July 1, 2017through December 31, 2017.Actual ExpensesThe first line of the table below provides information about actual account values and actual expenses. You may use this information,together with the amount you invested, to estimate the Portfolio expenses that you paid over the period. Simply divide your accountvalue by 1,000 (for example, an 8,600 account value divided by 1,000 8.6), then multiply the result by the number in the firstline under the heading entitled “Expenses Paid During the Six-Month Period” to estimate the Portfolio expenses you paid on youraccount during this period. As noted above, the table does not reflect variable contract fees and charges.Hypothetical Example for Comparison PurposesThe second line of the table below provides information about hypothetical account values and hypothetical expenses based on thePortfolio’s actual expense ratio and an assumed rate of return of 5% per year before expenses, which is not the Portfolio’s actual return.The hypothetical account values and expenses may not be used to estimate the actual ending account balance or expenses you paidfor the period. You may use this information to compare the ongoing costs of investing in the Portfolio and other investment options.To do so, compare this 5% hypothetical example with the 5% hypothetical examples that appear in the shareholder reports of the otherinvestment options.Please note that the expenses shown in the table are meant to highlight your ongoing Portfolio costs only and do not reflect anycontract fees and charges, such as sales charges (loads), insurance charges or administrative charges. Therefore the second line of thetable is useful to compare ongoing investment option costs only, and will not help you determine the relative total costs of owningdifferent contracts. In addition, if these contract fee and charges were included, your costs would have been higher.BeginningAccount ValueJuly 1, 2017EndingAccount ValueDecember 31, 2017Actual 1,000.00 1,138.700.80%Hypothetical 1,000.00 1,021.170.80% 4.08Actual 1,000.00 1,136.601.20% 6.46Hypothetical 1,000.00 1,019.161.20% 6.11The Prudential Series Fund PortfolioJennison 20/20 Focus (Class I)Jennison 20/20 Focus (Class II)Annualized ExpenseRatio based on theSix-Month periodExpenses PaidDuring theSix-Month period* 4.31* Portfolio expenses (net of fee waivers or subsidies, if any) for each share class are equal to the annualized expense ratio for eachshare class (provided in the table), multiplied by the average account value over the period, multiplied by the 184 days in the sixmonth period ended December 31, 2017, and divided by the 365 days in the Portfolio's fiscal year ended December 31, 2017 (toreflect the six-month period). Expenses presented in the table include the expenses of any underlying portfolios in which thePortfolio may invest.
[THIS PAGE INTENTIONALLY LEFT BLANK]
JENNISON 20/20 FOCUS PORTFOLIOSCHEDULE OF INVESTMENTSDecember 31, 2017LONG-TERM INVESTMENTS — 99.5%COMMON STOCKSSharesAerospace & Defense — 5.2%Boeing Co. (The) . . . . . . . . . . . . . . . . . . . . .United Technologies Corp. . . . . . . . . . . . . .21,18443,532COMMON STOCKS(continued)ValueIT Services — 4.9%PayPal Holdings, Inc.* . . . . . . . . . . . . .Visa, Inc. (Class A Stock)(a) . . . . . . . . s — 9.6%JPMorgan Chase & Co. . . . . . . . . . . . . . . .PNC Financial Services Group, Inc.(The) . . . . . . . . . . . . . . . . . . . . . . . . . . . . .106,84570,861Value 5,465,4755,545,70511,011,180Media — 2.8%Comcast Corp. (Class A Stock) . . . . .11,426,004Oil, Gas & Consumable Fuels — 3.8%Noble Energy, Inc. . . . . . . . . . . . . . . . .Royal Dutch Shell PLC (Netherlands)(Class A Stock), ADR(a) . . . . . . . . 14876,1895,082,568Biotechnology — 0.9%Vertex Pharmaceuticals, Inc.* . . . . . . . . . .12,9861,946,082Capital Markets — 2.2%Goldman Sachs Group, Inc. (The) . . . . . . .19,5154,971,641Chemicals — 2.6%DowDuPont, Inc. . . . . . . . . . . . . . . . . . . . . .82,5205,877,074Consumer Finance — 2.7%SLM Corp.* . . . . . . . . . . . . . . . . . . . . . . . . . .529,3895,982,09611,822,426Electric Utilities — 1.5%Exelon Corp. . . . . . . . . . . . . . . . . . . . . . . . .85,8953,385,122Energy Equipment & Services — 2.2%Halliburton Co. . . . . . . . . . . . . . . . . . . . . . . .Semiconductors & Semiconductor Equipment — 7.4%Broadcom Ltd. . . . . . . . . . . . . . . . . . . .20,1685,181,159Texas Instruments, Inc. . . . . . . . . . . . .109,43711,429,600102,6825,018,069Food & Staples Retailing — 4.6%Costco Wholesale Corp. . . . . . . . . . . . . . . .Wal-Mart Stores, Inc. . . . . . . . . . . . . . . . . . .24,39058,2098,472,716Pharmaceuticals — 5.3%Allergan PLC . . . . . . . . . . . . . . . . . . . .Bristol-Myers Squibb Co. . . . . . . . . . . .Eli Lilly & Co. . . . . . . . . . . . . . . . . . . . .Pfizer, Inc. . . . . . . . . . . . . . . . . . . . . . . .96,3254,539,4675,748,139Technology Hardware, Storage & Peripherals — 3.1%Apple, Inc. . . . . . . . . . . . . . . . . . . . . . . .41,7814,677,290Health Care Providers & Services — 3.8%Cigna Corp. . . . . . . . . . . . . . . . . . . . . . . . . .UnitedHealth Group, Inc. . . . . . . . . . . . . . 6,159Internet & Direct Marketing Retail — 4.2%Amazon.com, Inc.* . . . . . . . . . . . . . . . . . . .Netflix, Inc.* . . . . . . . . . . . . . . . . . . . . . . . . .121,9264,54721,287AFFILIATED MUTUAL FUNDSPrudential Investment Portfolios 2 —Prudential Core Ultra Short BondFund(w) . . . . . . . . . . . . . . . . . . . . . . . . .Prudential Investment Portfolios 2 —Prudential Institutional Money MarketFund (cost 18,378,653; includes 18,361,778 of cash collateral forsecurities on loan)(b)(w) . . . . . . . . . . 8,377,874TOTAL SHORT-TERM INVESTMENTS(cost 20,105,607) . . . . . . . . . . . . . . . . . . . . . . . . . . . .20,104,828TOTAL INVESTMENTS — 108.4%(cost 191,992,987) . . . . . . . . . . . . . . . . . . . . . . . . . . .LIABILITIES IN EXCESS OFOTHER ASSETS — (8.4)% . . . . . . . . . . . . . . . . . . . .9,403,833Internet Software & Services — 9.2%Alibaba Group Holding Ltd. (China),ADR*(a) . . . . . . . . . . . . . . . . . . . . . . . . . .Alphabet, Inc. (Class A Stock)* . . . . . . . . .Facebook, Inc. (Class A Stock)* . . . . . . . . .Tencent Holdings Ltd. (China), ADR(a) . . .4,486,933SHORT-TERM INVESTMENTS — 8.9%9,197,418Insurance — 2.7%MetLife, Inc. . . . . . . . . . . . . . . . . . . . . . . . . .23,674TOTAL LONG-TERM INVESTMENTS(cost 171,887,380) . . . . . . . . . . . . . . . . . . . . . . . . . . ,3654,122,71038,761Hotels, Restaurants & Leisure — 4.1%Carnival Corp. . . . . . . . . . . . . . . . . . . . . . . .Marriott International, Inc. (Class AStock) . . . . . . . . . . . . . . . . . . . . . . . . . . . .32,937143,13060,962Specialty Retail — 2.0%Home Depot, Inc. (The) . . . . . . . . . . . .Health Care Equipment & Supplies — 2.1%Zimmer Biomet Holdings, Inc. . . . . . . . . . tware — 10.8%Adobe Systems, Inc.* . . . . . . . . . . . . .Microsoft Corp. . . . . . . . . . . . . . . . . . . .salesforce.com, Inc.* . . . . . . . . . . . . . .10,287,606Food Products — 1.8%Mondelez International, Inc. (Class AStock) . . . . . . . . . . . . . . . . . . . . . . . . . . . 4294,124,317NET ASSETS — 100.0% . . . . . . . . . . . . . . . . . . . . . . . .20,679,947SEE NOTES TO FINANCIAL STATEMENTS.A1244,055,956(18,993,903) 225,062,053
JENNISON 20/20 FOCUS PORTFOLIO (continued)SCHEDULE OF INVESTMENTSDecember 31, 2017The following abbreviations are used in the annual report:ADRAmerican Depositary ReceiptLIBORLondon Interbank Offered RateOTCOver-the-counter*Core Ultra Short Bond Fund and Prudential Institutional MoneyMarket Fund.Fair Value Measurements:Non-income producing security.Various inputs are used in determining the value of the Portfolio’sinvestments. These inputs are summarized in the three broad levelslisted below.(a) All or a portion of security is on loan. The aggregate market valueof such securities, including those sold and pending settlement, is 17,962,313; cash collateral of 18,361,778 (included in liabilities)was received with which the Portfolio purchased highly liquid shortterm investments.Level 1—unadjusted quoted prices generally in active markets foridentical securities.Level 2—quoted prices for similar securities, interest rates and yieldcurves, prepayment speeds, foreign currency exchange ratesand other observable inputs.Level 3—unobservable inputs for securities valued in accordance withBoard approved fair valuation procedures.(b) Represents security purchased with cash collateral received forsecurities on loan and includes dividend reinvestment.(w) PGIM Investments LLC, the manager of the Portfolio, also servesas manager of the Prudential Investment Portfolios 2 — PrudentialThe following is a summary of the inputs used as of December 31, 2017 in valuing such portfolio securities:Level 1Level 2Level 3Investments in SecuritiesCommon StocksAerospace & Defense . . . . . . . . . . . . . . . . . . . . . . . . . . . . . . . . . . . . . . . . . . . . . . . . . . . . . . . . . . . . . . . . . . . . . . . . .Banks . . . . . . . . . . . . . . . . . . . . . . . . . . . . . . . . . . . . . . . . . . . . . . . . . . . . . . . . . . . . . . . . . . . . . . . . . . . . . . . . . . . . . .Biotechnology . . . . . . . . . . . . . . . . . . . . . . . . . . . . . . . . . . . . . . . . . . . . . . . . . . . . . . . . . . . . . . . . . . . . . . . . . . . . . . . .Capital Markets . . . . . . . . . . . . . . . . . . . . . . . . . . . . . . . . . . . . . . . . . . . . . . . . . . . . . . . . . . . . . . . . . . . . . . . . . . . . . .Chemicals . . . . . . . . . . . . . . . . . . . . . . . . . . . . . . . . . . . . . . . . . . . . . . . . . . . . . . . . . . . . . . . . . . . . . . . . . . . . . . . . . . .Consumer Finance . . . . . . . . . . . . . . . . . . . . . . . . . . . . . . . . . . . . . . . . . . . . . . . . . . . . . . . . . . . . . . . . . . . . . . . . . . . .Electric Utilities . . . . . . . . . . . . . . . . . . . . . . . . . . . . . . . . . . . . . . . . . . . . . . . . . . . . . . . . . . . . . . . . . . . . . . . . . . . . . . .Energy Equipment & Services . . . . . . . . . . . . . . . . . . . . . . . . . . . . . . . . . . . . . . . . . . . . . . . . . . . . . . . . . . . . . . . . . .Food & Staples Retailing . . . . . . . . . . . . . . . . . . . . . . . . . . . . . . . . . . . . . . . . . . . . . . . . . . . . . . . . . . . . . . . . . . . . . . .Food Products . . . . . . . . . . . . . . . . . . . . . . . . . . . . . . . . . . . . . . . . . . . . . . . . . . . . . . . . . . . . . . . . . . . . . . . . . . . . . . .Health Care Equipment & Supplies . . . . . . . . . . . . . . . . . . . . . . . . . . . . . . . . . . . . . . . . . . . . . . . . . . . . . . . . . . . . . .Health Care Providers & Services . . . . . . . . . . . . . . . . . . . . . . . . . . . . . . . . . . . . . . . . . . . . . . . . . . . . . . . . . . . . . . .Hotels, Restaurants & Leisure . . . . . . . . . . . . . . . . . . . . . . . . . . . . . . . . . . . . . . . . . . . . . . . . . . . . . . . . . . . . . . . . . .Insurance . . . . . . . . . . . . . . . . . . . . . . . . . . . . . . . . . . . . . . . . . . . . . . . . . . . . . . . . . . . . . . . . . . . . . . . . . . . . . . . . . . .Internet & Direct Marketing Retail . . . . . . . . . . . . . . . . . . . . . . . . . . . . . . . . . . . . . . . . . . . . . . . . . . . . . . . . . . . . . . . .Internet Software & Services . . . . . . . . . . . . . . . . . . . . . . . . . . . . . . . . . . . . . . . . . . . . . . . . . . . . . . . . . . . . . . . . . . . .IT Services . . . . . . . . . . . . . . . . . . . . . . . . . . . . . . . . . . . . . . . . . . . . . . . . . . . . . . . . . . . . . . . . . . . . . . . . . . . . . . . . . .Media . . . . . . . . . . . . . . . . . . . . . . . . . . . . . . . . . . . . . . . . . . . . . . . . . . . . . . . . . . . . . . . . . . . . . . . . . . . . . . . . . . . . . .Oil, Gas & Consumable Fuels . . . . . . . . . . . . . . . . . . . . . . . . . . . . . . . . . . . . . . . . . . . . . . . . . . . . . . . . . . . . . . . . . . .Pharmaceuticals . . . . . . . . . . . . . . . . . . . . . . . . . . . . . . . . . . . . . . . . . . . . . . . . . . . . . . . . . . . . . . . . . . . . . . . . . . . . . .Semiconductors & Semiconductor Equipment . . . . . . . . . .
The Prudential Series Fund, Jennison 20/20 Focus Portfolio December 31, 2017 Report oftheInvestment Manager -AsofDecember31,2017(Unaudited) AverageAnnualTotalReturns 1-Year 5-Years 10-Years