Transcription
Improving performanceof the Star Bottleproduction lineA case study at HeinekenAuthor: Daan van LeerDate: December 2, 2014i
“The future belongs to those who prepare for it today.”- Malcolm Xii
HEINEKEN NEDERLAND B.V.Burgemeester Smeetsweg 12382 PH ZoeterwoudeThe Netherlands 31 (0) 71 545 6111www.heineken.nlUniversity of TwenteDrienerlolaan 57522 NB EnschedeThe Netherlands 31(0) 53 489 9111www.utwente.nlMaster Thesis ProjectStudySectionDateIndustrial Engineering and ManagementProduction & Logistics ManagementDecember 2, 2014Daan van LeerStudent numberEmail addresss0217026daanvanleer@gmail.comGraduation CommitteeUniversity of TwenteFirst supervisorDr. P.C. SchuurUniversity of TwenteSecond supervisorDr. ir. M.R.K. MesHEINEKEN NEDERLAND B.V.Supervisorir. J. Broniii
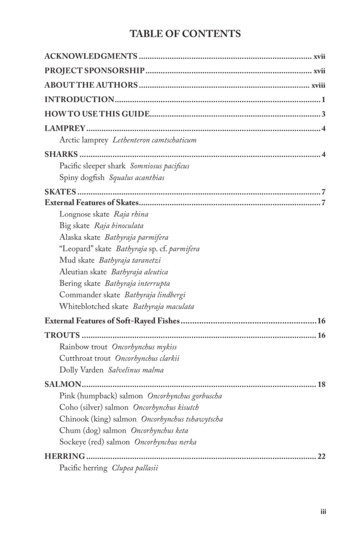
Management SummaryHEINEKEN needs to stay ahead on the competitive beer market and therefore it constantly needs toimprove its performance. This report focuses on the production line of the Star Bottles, introduced atHEINEKEN in 2013. Production line 11 produces Star Bottles and differs from other production lines atHEINEKEN because it has multiple speeds on the filling machine. This line is known as a self regulatedproduction line, where speed levels of the machines are regulated by sensors on the production line.Overall, the performance of line 11 is below target, so improvement is necessary. This leads to thefollowing research question:How to improve line performance on the regulated production line (line 11) at HEINEKENZoeterwoude?First, to determine the focus of this research we performed a process analysis and data analysis. The focusis on the pasteurizer and the labelers (CPLs). The pasteurizer is the bottleneck machine and mostinefficiencies occur on this part of the production line. These problems are formulated and displayedbelow:---Problem 1: Blockage on pasteurizer due to inefficient positioning of sensors. A blockage on thepasteurizer occurs when the CPL111 (labeling machine) fails and CPL112 does not startproduction, simply because sensors are not triggered when they should. A minute loss on thebottleneck machine is a minute loss on the output of the total line. This problem is also known as‘inefficient line regulation’.Problem 2: Unequal production balance between the labelers. CPL111 produces 57% of the totaloutput and CPL112 produces 43%. This is a problem because the maintenance schedule does notfit and extra CILT-activities (Cleaning, Inspection, Lubrication and Tightening) by operatorsneed to be performed.Problem 3: Labeler 112 has an extremely high starvation percentage (64% of total time).Problem 2:Unequal production balanceto CPLs (labelers)CPL111Problem 1:Inefficient lineregulation10CPL112Problem 3:High starvationpercentage onCPL112Based on the process and data analysis it is known that problem 1 is caused by inefficient line regulation.The second problem is a lay out problem, but can also be solved with a more efficient line regulation.Problem 3 is a mistake in the software. This problem is communicated to the software department andiv
will be solved in January 2015. In order to improve the line regulation, a conceptual model is designedthat is the base for a simulation model. We use this simulation model to perform experiments ofalternative solutions to problem 1 and 2. In these experiments, the position of the sensors and the numberof speed levels of the machines are changed.To find an alternative solution, we performed twelve different experiments. The results of the experimentswere ranged by two indicators, output quantity and production balance. Looking at both indicators, theresults of the experiments show that the current situation can be improved. In the table below, the currentsituation is compared with the alternative utIn eCPL111 CPL11257%43%53%47%4%4%Differenceon CPLs14%6%8%The new situation increased the output with 11790 bottles and improved the production balance with 8%.This improvement results in a yearly saving of X (confidential).We can conclude that the line performance at the regulated production line (line 11) at HEINEKENZoeterwoude can be improved by: Adjusting the position of sensors and the amount of speed levels. These adjustments have apositive influence on the output and production balance of the line. Thus, ‘efficient lineregulation’ improves the line performance. Reducing the amount of speed levels of CPL111 from four to three, where CPL112 remains thesame with three speed levels. Changing all three sensor positions regarding the speed levels of CPL111, and by changing onlyone position of CPL112.The alternative situation is implemented at the Star Bottle production line. The first results in real lifesupport our findings and conclusions from our simulation model. The first results show that theproduction balance is improved (52%/48%) and that the throughput is increased. Nevertheless, we shouldanalyze our modification in real life more frequently to ensure that our modification is an improvement inany situation on the Star Bottle production line.In addition, we provide the following recommendations: Focus more on conveyors/lines. On all packaging lines the focus is on the machines, but the focusshould be on conveyors between the machines. The implementation of the modification isrelatively small, but the results are relatively large.Determine the functioning of all sensors on the production line. In order to improve the efficiencybetween machines, it is necessary to have a clear understanding of the function of the sensors.Improve data registration at MES (information system). The data registration at MES should beimproved, especially for the Star Bottle production line. Due to the regulated production line,MES is not capable to measure all parameters (e.g., speed levels).Hire an extra PA-/PI engineer. When inefficiencies are noted by employees, they have to fill in alabel. Different aspects on these labels are possible, and might vary from safety issues tillv
machines issues. When such an aspect consists of technical issues, these arrive on the desk of aPA-/PI engineer. Some filled in labels are on stack for six months. This slow response bymanagement discourages the operators to help improve the line performance.Improving the administration of inventory management of small objects. The exchange of smallobjects (e.g., Teflon cylinders, glue sprayers) and their location is not registered by themaintenance department.Visualization of inefficiencies for operators. Operators should be aware of all possible states anderrors of the production line.The optimization of the line regulation of line 11 is now only performed between the pasteurizer andCPLs. Therefore we suggest further research to improve the whole line regulation of line 11.vi
PrefaceThis report presents the research I conducted in order to improve the line performance at the packagingdepartment of HEINEKEN Nederland B.V. This research is performed in order to graduate at theUniversity of Twente. Managing this research project was a real challenge and opportunity to develop mypersonal and educational skills.Conducting and finishing this report would have never been possible without the help of others. ThereforeI am using this opportunity to thank everybody directly and indirectly involved in the realization of thisresearch.First, I would like to thank Jojanneke Bron for realizing my graduation internship at the packagingdepartment at the HEINEKEN Zoeterwoude brewery, for all the effort, enthusiasm, and contributing tomake it a fantastic experience. Furthermore I would like to thank Dennis van Strater, Toine van den Berg,Ed van Dorp, Ernst Hageman and Peter Zandvliet for their effort, support and insights. During my 6months internship, I believe to have developed myself at a professional and personal level due to theirconstructive feedback and guidance.A second word of thanks goes to Peter Schuur and Martijn Mes, for their valuable feedback and sparringsessions. Their extensive input was indispensable in defining and executing this research, writing thisreport and finishing the (simulation) model.Finally, special thanks go to my parents, brother, sister and girlfriend for their support and inspiration,which eventually is the key to my success.Daan van Leer.vii
QMAutomated Guided VehicleBreak Down AnalysisClean Inspect Lubricate TightenCold glue Plastic Label (Machine)Customer Service and LogisticsEmpty Bottle InspectorFull Time EquivalentHecto LiterHeineken NederlandHeineken Nederland SupplyInformation System (see MES)Key Performance IndicatorMean Efficiency RateManufacturing Execution SystemMaterial Requirements PlanningMean Time Between AssistMean Time Between FailuresMean Time To RepairMovable UnitOperational Performance IndicatorPlan, Do, Check, ActProgrammable Logic ControllerQuality Function DeploymentSite Acceptance TestStar BottleTime Efficiency ImprovementTheory of ConstraintsTotal Productive ManagementTotal Quality Managementviii
Table of contentsManagement Summary . ivPreface . viiAbbreviations . viiiTable of contents . ix1.Introduction . 11.1Introduction HEINEKEN . 1HEINEKEN Zoeterwoude . 21.2Context Description . 3KHS. 42.1.3Problem Statement . 41.4Research setup . 51.5Research scope . 61.6Research methods . 61.7Research deliverables. 8Process Analysis . 92.1Packaging line 11 . 92.1.1Machinery . 92.1.2Conveyor/buffer strategy and sensors . 122.1.3Different states of a machine . 14MES . 142.2Line regulation . 152.2.1Speed control . 152.2.2Speed levels . 172.2.3V-graph . 182.3Speed loss. 20Technology . 212.43.Measuring Line Performance . 21Data Analysis . 243.1Line Performance . 24Visibility/Transparency. 29Measuring Speed Loss - Excel Tool . 293.2Problem design – layout. 30ix
3.3Summary of data analysis . 34Summary of analysis (Section 3.1) . 34Summary of problem design (Section 3.20) . 344.Literature Review. 354.1Continuous improvement strategies . 35Lean management . 35Six Sigma . 35Theory of Constraint (ToC) . 354.2Total Productive Maintenance (TPM) . 36TPM philosophy. 36TPM pillars . 364.3Performance measurement . 37Six big losses. 38Operational Performance Indicator (OPI . 38CILT. 394.4Related Research . 39Conveyor Theory . 40Conveyor systems in simulation . 40Choice of method . 41Simulation type . 41Conclusion . 425.Solution design. 435.1Conceptual model . 43Model overview – Movement of Star Bottles . 43Model overview – Regulation . 46Components of simulation model . 47Assumptions. 48Conclusions . 485.2Simulation model . 49Description of the simulation model . 505.3Experimental setup. 51Input data . 51Warm-up period . 53x
Number of replications. 546.5.4Verification & validation . 555.5Experimental design. 565.6Conclusion . 59Experimental results. 606.1Performance measures . 606.2Simulation results. 61Current situation. 61All experiments . 61Correlation . 637.8.6.3Risk analysis . 656.4Conclusions . 69Implementation . 727.1Implementation Procedure . 727.2First results after implementation – 8hr shift . 727.3Savings . 73Conclusion and Recommendations . 768.1Conclusions . 768.2Recommendations . 778.3Further research . 78References . 79Appendices. 82xi
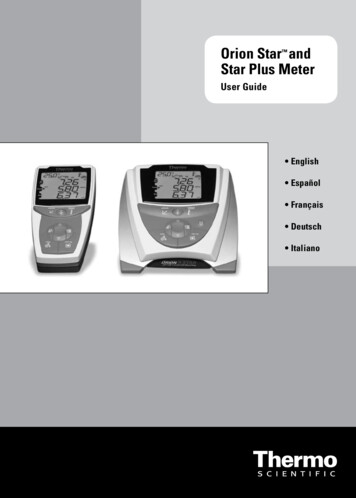
1. IntroductionIn the framework of completing my Master thesis, I performed research at HEINEKEN BV to improvethe production line of the Star Bottle, introduced in 2013. This report describes the master thesis for thestudy Industrial Engineering and Management at the University of Twente. In this research, we analyzethe production line with corresponding machines in order to improve the current situation. Section 1.1contains general information and background information about HEINEKEN, where we describe inSection 1.2 the context of the research. In Section 1.3 we define the problem statement followed by theresearch question and sub-questions in Section1.4. In Section 1.5 we define the research focus followedby the research methods in Section 1.6. We end this chapter in Section 1.7 with a list of the maindeliverables of this report.1.1Introduction HEINEKENHEINEKEN, a Dutch brewing company, is established in 1864 by the HEINEKEN family and is world’smost international brewer. It has 165 breweries and is active in 71 countries in the world. With around85,000 employees, HEINEKEN manages one of the world’s leading portfolios of beer brands.HEINEKEN in the Netherlands owns three breweries, onelocation for bottling of soft drinks and nine sales regions.Production takes place in breweries at Zoeterwoude, DenBosch and Wijlre. The largest brewery of HEINEKEN islocated at Zoeterwoude, which is also the location of theresearch. Figure 1.1 shows the brewery of HEINEKENZoeterwoude. The beer production at Zoeterwoude is 10million hl in 2013, from which 60% is dedicated to export.The destination of the exported beer is especially theAmericas and Asia Pacific. The distribution network ofHEINEKEN BV is so efficient that distributing bottlesF IGURE 1.1:HEINEKEN ZOETERWOUDEfrom Zoeterwoude to America is more profitable thanbrewing in America. In Figure 1.2 we show in what way HEINEKEN is present in the world. WhereHEINEKEN OpCo stands for “Operations Company” and means that in this country HEINEKEN has oneor more breweries.F IGURE 1.2: GLOBAL PRESENCE OF HEINEKEN1
In total HEINEKEN brews and sells more than 250 brands including international, regional, local andspecialty beers and ciders. Heineken is the flagship brand and other brands that are part of the portfolioare Amstel, Desperados, Tiger, Foster’s, Sol, Wieckse Witte but also ciders like Strongbow and Jillz.HEINEKEN has three brands that are positioned in the top ten of the world’s leading brands, which areshown in Figure 1.3. Note that Heineken isnumber one with 27.4 million hectoliter.F IGURE 1.3: W ORLD' S LEADING BRANDS( IN MILLIONS OF HECTOLITERS)In addition HEINEKEN BV (all brandstogether) ranks second in the top of the globalmarket share, with a percentage of 9.1%.ABInBev (Belgium) and SABMiller (SouthF IGURE 1.4: INDUSTRY CONSOLIDATIONAfrica) are respectively number one and three. InFigure 1.4 show these numbers. Nevertheless, based on volume HEINEKEN ranks third, afterrespectively ABInBev and SABMiller. ABInBev’s portfolio consists of brands as Budweiser, StellaArtois, Jupiler, Hertog-Jan etcetera. Whereas SABMiller has brands like Miller, Grolsch and PilsnerUrquell.Recently SABMiller proposed a takeover offer towards HEINEKEN, but HEINEKEN wanted to preservethe firm as “an independent company”. Besides there has been speculation within the brewing industry,for months, that SABMiller has been targeted by the world’s number one brewer ABInBev. This meansthat there is a frequent activity around the top of the breweries.HEINEKEN ZoeterwoudeHEINEKEN Zoeterwoude is divided into two divisions, HEINEKEN Netherlands (HNL) andHEINEKEN Netherlands Supply (HNS). In this research we only focus on HNS which is shown in theorganizational structure of HNS in Figure 1.6. The chart narrows on the area of interest for this research,which considers line 11. A rayon consists of (two or) three production lines which differ from bottles tokegs.2
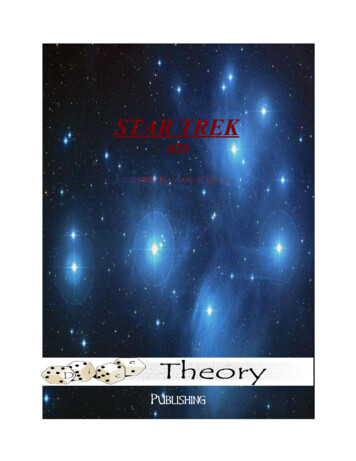
HNSSecretaryRayon 1Brewing/FiltrationPackagingRayon 2Rayon 3Technology &QualityTechnicalServicesRayon 4Rayon 5Safety HealthEnvironmentTotalProductiveManagementLine 9Line 11Line 12F IGURE 1.6: ORGANIZATIONAL CHARTHNSF IGURE 1.5:HEINEKENS TAR BOTTLE0.3LIn 2013, HEINEKEN introduced the new Star-Bottle (SB) exhibited in Figure 1.5. Inorder to produce these new bottles, a new production line has been developed, which isline 11. So this research focuses on line 11 with the Start Bottles. In Section 2.1 we describe this line indetail.1.2Context DescriptionIn today’s highly competed beer market, HEINEKEN needs to stay ahead of its competitors. More beerbrands will enter the market and as HEINEKEN Nederland Supply (HNS) states: “customer demand ischanging, volume is decreasing, fixed costs as well as variable costs are increasing, and customers expectthe same service and quality” (HNS visie 2015, 2011). Therefore, HEINEKEN is striving for continuousimprovement of their performance in order to stay ahead of the competition. The main goal is to gainhigher line performance, higher productivity, and eventually a lower cost price, while maintaining thequality. HEINEKEN has decided to perform this continuous improvement using Total ProductiveManagement (TPM). TPM is an equipment management philosophy, focused on maximizingperformance and the ultimate goal is to reach zero losses (Nakajima 1988). TPM is preferred above TQMand Six Sigma because of its strong focus on equipment and maintenance. Since the continuousimprovement philosophy, TPM has a strong focus on maintenance and is useful in organizations that havea high level of equipment automation (Rolfsen, Langeland 2012). TPM is a philosophy to continuouslymanage, optimize and improve a supply chain by eliminating all losses, involving all employees of theorganization (Chan, Lau et al. 2005, Ahuja, Khamba 2008). By systematically eliminating losses, TPMimproves the performance of a production system (Nakajima 1988, Hartmann 1992, Chan, Lau et al.2005).In order to know what performance is improved, the performance measure should be clear.Currently, in most businesses, every performance is measured by various kinds of performance indicators(PIs). Also departments in a company have their own PIs. Consider for example a car manufacturer:where the sales department measures its performance on cars sold and number of customers satisfied and3
the production department measures its performance by cars produced and cars rejected by lack ofquality. In literature it is a highly debated topic. According to Neely (2002), the definition of performancemeasurement is: “The process of quantifying the performance of actions”. Measuring the performance isimportant in order to be able to perform improvement activities based upon these measures and to keeptrack of previous results (De Ron, Rooda 2006). In addition, only aspects, that have been measured, areactively improved by the stakeholders (Ridgway 1956, De Ron, Rooda 2006). Therefore it is importantfor businesses to identify the correct performance measurement and corresponding PIs for each process.With an incorrect performance measure, the problem will not be measured correctly and therefore it isunclear whether the problem is solved or not.KHSKHS, the German supplier of the Star Bottle production line, also matches the thoughts of TPM, wherereducing losses are a point of interest. The philosophy of KHS is to reduce losses by avoidingstart/stop situations of a machine. The losses that will be reduced are equipment failure, idling, minorstoppage and reduced speed. KHS implemented line 11 in 2013. Thus the machinery is relatively newand KHS expects less failure compared to other lines. Nevertheless there are some differences with olderproduction lines due to new insights in technology. KHS has a new philosophy to increase line balance byintroducing several speed levels in the machines, particularly on the filler. Previously, fillers on theproduction lines at HEINEKEN have just one production speed, the machine produces or does not (resp.at 100% or 0% of capacity). This stationary process is know
The pasteurizer is the bottleneck machine and most inefficiencies occur on this part of the production line. These problems are formulated and displayed below: - Problem 1: Blockage on pasteurizer due to inefficient positioning of sensors. A blockage on the pasteurizer occurs when the CPL111 (labeling machine) fails and CPL112 does not start