Transcription
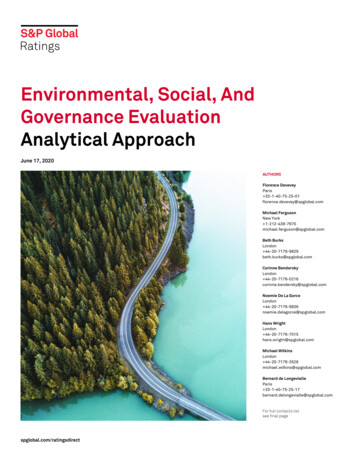
Environmental, Social, AndGovernance EvaluationAnalytical ApproachJune 17, 2020AUTHORSFlorence DeveveyParis el FergusonNew York 1-212-438-7670michael.ferguson@spglobal.comBeth BurksLondon 44-20-7176-9829beth.burks@spglobal.comCorinne BenderskyLondon e De La GorceLondon 44-20-7176-9836noemie.delagorce@spglobal.comHans WrightLondon 44-20-7176-7015hans.wright@spglobal.comMichael WilkinsLondon 44-20-7176-3528michael.wilkins@spglobal.comBernard de LongevialleParis For full contacts listsee final pagespglobal.com/ratingsdirect
Environmental, Social, And Governance Evaluation Analytical ApproachExecutive SummaryS&P Global Ratings' environmental, social, and governance (ESG) Evaluation is a crosssector, relative analysis of an entity’s capacity to operate successfully in the future and isgrounded in how ESG factors could affect stakeholders, potentially leading to a materialdirect or indirect financial impact on the entity. ESG factors typically incorporate the entity'simpact on the natural and social environment and the quality of its governance. Our ESGanalysis goes beyond a traditional financial analysis and includes some risks andopportunities that are more qualitative. Our definition of stakeholders for a particular entitygoes beyond shareholders to include employees, the local community, government,regulators, customers, lenders, borrowers, policyholders, voters, members, and suppliers,among others. A high ESG Evaluation score indicates an entity is relatively less prone toexperiencing material ESG-related events, and relatively better-positioned to capitalize onESG-related growth opportunities, compared to entities with lower ESG Evaluation scores.First, we establish an ESG Profile for a given entity, which assesses the exposure of theentity’s operations to observable ESG risks and opportunities, and how the entity ismitigating these risks and capitalizing on these opportunities. Our ESG Profile analysis startswith an assessment of the entity’s ESG-related exposure by sector and location.Second, we assess the entity’s long-term Preparedness, namely its capacity to anticipate andadapt to a variety of long-term plausible disruptions. These disruptions are not limited toenvironmental and social scenarios, but could also include technological or regulatorychanges where relevant, among other factors. This is because, in our opinion, high-qualitycorporate governance includes the full spectrum of current and potential risks andopportunities an entity faces beyond typical financial planning horizons.The ESG Evaluation is not a credit rating, a measure of credit risk, or a component of ourcredit rating methodology. However, the information we gather for an ESG Evaluation caninform our credit analysis of rated entities.Chart 1ESG EvaluationESG Profile Preparedness ESG EvaluationCopyright 2020 by Standard & Poor’s Financial Services LLC. All rights reserved.spglobal.com/ratingsdirectJune 17, 20202
Environmental, Social, And Governance Evaluation Analytical Approach1.Our final ESG Evaluation ranking combines an entity’s ESG Profile with our long-termPreparedness opinion (see chart 1), thereby indicating our view of an entity’s relative exposure toobservable ESG-related risks and opportunities, and our qualitative opinion of the entity’s longterm sustainability and readiness for emerging trends and potential disruptions. We will monitorthe ESG Evaluation score to account for new data points, updated strategies, and events thataffect the entity, subject to materiality.Approach To Ranking2.The ESG Evaluation is a ranking on a 100-point scale. A higher ranking expresses our view that theentity is more likely to be sustainable, based on active management of ESG-related risks andopportunities, relatively strong governance, and the entity's ability to adapt to change and takeadvantage of long-term trends and disruptive opportunities. Similarly, we typically associatelower scores with greater exposure to ESG-related risks, comparatively weaker governance, andnot being as well equipped to handle or exploit potential long-term business disruptions andopportunities.3.Within the ESG Profile, we assess the contribution of the individual environmental, social, andgovernance profiles and explain our opinions and analysis of each factor in our ESG EvaluationReport.4.The Preparedness opinion is described as one of the following: Best In Class, Strong, Adequate,Emerging, or Low. The combination of the ESG Profile and Preparedness reflects the relativity ofthe two assessments at different points in their scales. The principles we use to combine the ESGProfile score with our Preparedness opinion are:5. The highest ESG Evaluations generally reflect Best-In-Class or Strong Preparedness. The lowest ESG Profile scores are unlikely to be significantly offset by favorablePreparedness. Best-In-Class Preparedness is rare and will generally have a significantly positive effecton the evaluation. Strong Preparedness will typically have a positive effect. Adequate Preparedness typically has minimal impact except when the ESG Profile scoreis greater than 85. Emerging Preparedness will typically have a negative effect. Low Preparedness is rare and will generally have a significantly negative effect.We may also raise or lower the final ESG Evaluation score to reflect a risk or opportunity not fullycaptured under the individual Profile or Preparedness factors, or to ensure comparability with theESG Evaluation scores of other entities.Materiality And Value Chain6.Our ESG Evaluation analysis is grounded in how ESG factors could affect stakeholders, potentiallyleading to a material direct or indirect financial impact on the entity.7.For the purposes of our ESG Evaluation we assess the materiality of ESG-related events or issuesby looking at the likely financial impact on the entity, including potential impacts fromenvironmental and social externalities. Events and issues are material for the ESG Evaluationwhen in our view they could meaningfully affect the entity’s business operations, cash flows, legalor regulatory liabilities, access to capital, reputation, or relationships with key stakeholders andsociety more generally, either directly or through its value chain (upstream or downstream). In ourassessment we balance different issues that may lead to financial impacts qualitatively and on alikelihood versus impact basis. More likely or near-term issues are typically driven by changes inregulations, laws, and customer behavior. Less certain or longer term issues could have aspglobal.com/ratingsdirectJune 17, 20203
Environmental, Social, And Governance Evaluation Analytical Approachsignificant impact, such as a pandemic, or scarcities of natural resources that could lead tostructural shifts in market forces and operating dynamics.8.Our analysis considers what we see as ESG relevant risks and opportunities that exist and couldarise in the entity’s whole value chain (upstream and downstream), and whether they could affectthe entity in the future. In our ESG Evaluation, our analysis considers the potential for significantdisruptions outside an entity’s own operations but within its value chain. Often, factors in anentity’s supply chain, or in its lending, investments, or underwriting, may be more influential thanfactors it can control directly.9.We assess exposure to ESG risks and opportunities coming directly from the entity’s fully-ownedoperations, but also indirectly from its partially-owned subsidiaries, suppliers, franchisees,licensees, lenders or underwriters, customers, taxpayers, and residents, to determine if therecould potentially be a material financial impact on the entity. An entity that positively influencesESG factors across its supply chain and customer base--or through lending, investments,underwriting, or investment policy--is likely to be viewed by us as having less exposure, all elsebeing equal.The ESG Profile10.The ESG Profile reflects our view of the current and near-term exposure of an entity to observableESG risks and opportunities, relative to other entities. This analysis also takes into account ourview of the near-to-medium-term effectiveness of the entity’s current governance and policyframework and trends in its performance against selected ESG indicators. We assess 12 separateESG factors for their potential to lead to a material financial impact on the entity, either directly orindirectly, if not mitigated.11.We rank an entity’s ESG Profile on a 100-point scale. Entities with higher scores are, in ouropinion, more likely to operate in sectors and locations with relatively lower ESG-related exposure,are more successful in managing their ESG exposures, have faced comparatively fewer ESGevents, and are more likely to capitalize on ESG-related opportunities resulting from changes intheir natural and social environments. They are also more likely to demonstrate strongergovernance standards.12.The ESG Profile is the combination of our assessment of three profiles: Environmental, Social, andGovernance (see chart 2). In assessing each of these three profiles, we consider the following: A weighted sector- and region-based analysis of financially material ESG exposure; The entity’s specific ESG exposure, if different from that of other entities within its sectoror globally; For several factors, a qualitative and quantitative analysis of the entity’s effectiveness atmanaging ESG-related risks and opportunities relative to other entities within its sectoror globally, as well as its policies; Additional risks and opportunities not fully captured under factor scores; and The forward-looking effects of material ESG Events.spglobal.com/ratingsdirectJune 17, 20204
Environmental, Social, And Governance Evaluation Analytical ApproachChart 2ESG Profile Building BlocksEnvironmentalSocialGovernanceGreenhousegas emissionsWorkforceand diversityStructureand oversightWaste and pollutionSafety managementCode and valuesWater useCustomerengagementTransparencyand reportingLand useCommunitiesFinancial andoperational risksCopyright 2020 by Standard & Poor’s Financial Services LLC. All rights reserved.ESG EventsESG events include disruption to operations or negative stakeholder attention related to acontroversy, which we define as an adverse development that plays out in the public domainand could lead to material financial or reputational damage. In our analysis we assess themateriality of ESG events that have been reported by one or more reputable organization orgovernmental agency, or are self-disclosed. Once identified as having a potential materialfinancial impact, we attribute an event to the relevant ESG factor (for instance, workforce anddiversity, or waste) or profile (for example, social or environmental)—as a flag to the reportreader. We may flag ESG events that have happened over the past 10 years. These eventshave no automatic or direct impact on the ESG Evaluation. Instead, past ESG events, if likelyto have future impacts, could be a reason to adjust a factor or profile score.A repeat or similar event is likely to lead us to make a negative adjustment because the entitymay not have learned lessons and not effectively implemented remedies, which could resultin reputational or regulatory harm. By contrast, an entity that has faced adverse events andactively mitigated the effects might benefit from its actions, so we could consider a smallernegative adjustment, or even, in rare cases, a positive adjustment.spglobal.com/ratingsdirectJune 17, 20205
Environmental, Social, And Governance Evaluation Analytical ApproachMaterial ESG events could include the following examples: Natural disasters Labor disputes Financial restatements Misdeeds of management Other disruptions to operational activitiesEnvironmental Profile13.The environmental profile (E Profile) describes the relative sustainability of an entity based on itsenvironmental risks and opportunities compared to its sector or industry.14.To determine the E profile of an entity, we first conduct a macro sector and regional analysis ofmaterial environmental risks and opportunities. From this analysis, we derive a sector-regionscore, weighted by the entity’s business mix.15.Then we consider four key entity-specific factors (greenhouse gas [GHG] emissions, waste, water,and land use) to determine whether the entity is actively and effectively managing itsenvironmental risk exposures compared with peers in its sector globally.16.Finally, we combine the sector-region score with our assessments of these four environmentalfactors to create the E Profile, on a 100-point scale. The final E Profile is subject to a generaladjustment to account for any relevant entity-specific considerations not already captured in theentity-specific analysis.Sector And Regional Analysis17.From our macro sector and regional analysis, we derive sector and region scores. A sector scorereflects a sector’s exposure to material environmental risks and opportunities, while a regionscore reflects a region’s exposure to natural disasters.18.We then derive a blended sector-region score, weighted by the entity’s sector and regionalbusiness mix. We can adjust the score to capture the entity’s exposure to specific sector orregional risks, if different from those of other entities in its sector or globally. Examples of suchfactors include rising sea levels and other physical climate risks.19.To determine the entity’s business mix, we review the breakdown of its revenue, assets,employees, or any other relevant proxy by sector and region and use the proportions that moreaccurately describe the entity’s exposure to environmental risks and opportunities and naturaldisasters. As a result, the proxy we use to determine the business mix could vary between entitieswithin a sector.Entity-Specific Analysis20.To assess whether the entity is actively and effectively managing its exposures relative to othercomparable entities in its sector, we consider its policies and selected key environmentalindicators. In this part of our analysis we could reflect shortcomings in the data, recent or pastcontroversies associated with a factor, or additional exposures or mitigations not addressed in thepolicy or key indicator analysis.21.Selected indicators are specific to each factor. The policy analysis and adjustments by factor aresimilar (see table 1).spglobal.com/ratingsdirectJune 17, 20206
Environmental, Social, And Governance Evaluation Analytical ApproachTable 1Selected Indicators, Policy Analysis, And Adjustments By Factor22.Selected IndicatorsPolicy FrameworkAdjustmentsFor each factor in the E and S Profiles, wecompare the relative performance of the entityagainst sector data (where possible). Whenthe sector data are not reliable or comparable,we rely on a more qualitative analysis of theentity-specific data. For each selectedindicator, we consider the currentperformance as well as the actual and futuretrend.We assess the policy framework for a factor byconsidering, among other things, the entity’scommitment to its policy, how compliancewith the policy is measured, how breaches areremediated, whether the policy aims toimprove environmental outcomes and, if so,how progress is tracked, and who isaccountable for delivering on the policy.Typical factor-level adjustments could reflectshortcomings in the data; publicly reportedcontroversies associated with the factor; oradditional exposures or mitigations notaddressed in the policy or key indicatoranalysis. The degree of influence across theentity’s entire value chain, upstream anddownstream, can also support adjustments.We express the relative assessment for each factor compared with the sector average as one offive outcomes: Leading (in few cases, when performance is quantitatively and consistently better thanStrong) Strong (when performance is stronger than industry standards) Good (when performance is in line with industry standards) Lagging (when performance is weaker than industry standards) Weak (in few cases, when performance is significantly and consistently worse thanLagging)GHG Emissions23.We assess how actively and effectively the entity is managing its direct and indirect exposure toGHG emissions risks and opportunities relative to other comparable entities in its sectors.24.In addition to our analysis of policies and mitigation strategies, typical key indicators are theintensity of Scope 1 and Scope 2 carbon dioxide equivalent (CO2e) emissions. CO2e intensity ismeasured by emissions divided by revenue or by sector-specific CO2e intensity metrics, which wethen compare to the CO2e intensity of other entities in the same sector. Lower-than-averageintensity and a falling trend that is likely to persist could lead us to a more favorable assessment.25.Other considerations include: The methodology used for carbon accounting The use of carbon offsets The importance of Scope 3 emissions, both upstream and downstream Energy use, renewables, tracking, and targetsWaste And Pollution26.We look at how actively and effectively the entity is managing its direct and indirect exposure towaste and pollution risks and opportunities relative to other comparable entities in its sectors.27.In addition to our analysis of policies and mitigation strategies, key indicators are the proportion ofwaste recycled and the current level of recycling. Greater-than-average recycling for a sector anda consistently increasing trend are likely to indicate a more favorable assessment.28.Other considerations may include: Proportion of hazardous waste Air, water, and land pollution Use of sustainable packagingspglobal.com/ratingsdirectJune 17, 20207
Environmental, Social, And Governance Evaluation Analytical ApproachWater Use29.We analyze how actively and effectively the entity is managing its direct and indirect exposure torisks and opportunities related to water scarcity or competition for resources relative to peers inits sector.30.In addition to our analysis of policies and mitigation strategies, key indicators are the entity’swater intensity, the proportion of water recycled or reused, and amount of water drawn from thenatural environment and from stressed water regions in particular. Lower-than-average waterintensity or a higher proportion of recycled water than sector peers generally lead to a morefavorable assessment.31.Other indicators to consider include: Measurement of water consumption Units of water used per unit of productionLand Use And Biodiversity32.We look at how actively and effectively the entity is managing its direct and indirect exposure torisks and opportunities related to land development and the potential effects on biodiversityrelative to peers in its sector.33.Due to the lack of consistent data available to analyze an entity’s land use and biodiversityperformance, we weight our assessment more toward our analysis of policies (see table 1) andmitigation strategies than key indicators. Other important factors we may consider are theentity’s: Direct and indirect operations in sensitive areas for plant, animal life, sea life, and othernatural ecosystems Greenfield development activity Deforestation activity, especially related to soy, palm oil, timber, or cattleFinal E Profile And General Adjustment34.35.The E Profile combines the entity-specific assessments with the sector-region score to produce aranking on a 100-point scale. A higher rank reflects our view that the entity is operating in sectorsand regions with lower environmental exposures, more effectively managing its exposures, morelikely to take advantage of changes in the natural environment, and less likely to experiencenegative financial and reputational consequences from its environmental exposure. The fourenvironmental factors might carry different weights by sector or region to capture their relativeimportance in our E Profile assessment.The general E Profile adjustment is available to reflect risks and opportunities affecting the EProfile not fully captured in the four factors. Typical reasons to apply a general adjustmentinclude: Relative strengths or weaknesses in the entity’s environmental management system Significance or severity of environmental risks or opportunities not fully capturedelsewhere General policy strengths or deficiencies The use of natural capital protocols or recognized environmental certifications Significant outperformance or underperformance not fully captured in the factorassessments Any environmental factor not specifically reflected in the factor assessments Major events or controversies affecting multiple factors Comparisons with the E Profiles of other entitiesspglobal.com/ratingsdirectJune 17, 20208
Environmental, Social, And Governance Evaluation Analytical ApproachSocial Profile36.The social profile (S Profile) describes our view of the relative sustainability of an entity and its keystakeholders based on risks and opportunities relating to its social license to operate, comparedto its sector or industry. A social license to operate reflects the public's ongoing acceptance of anentity’s practices.37.To determine the S profile of an entity, we first conduct a macro sector and regional analysis ofmaterial social risks and opportunities. From this analysis, we derive a sector-region score,weighted by the entity’s business mix.38.Then we consider four key entity-specific factors (workforce and diversity, safety management,customer engagement, and communities) to determine how the entity is actively and effectivelymanaging its exposure to social risks and opportunities compared with other sector peersglobally.39.Finally, we combine the sector-region score with our assessments of these four social factors tocreate the S Profile, on a 100-point scale. The final S Profile is subject to a general adjustment toaccount for any relevant considerations not already captured in the entity-specific analysis.Sector And Regional Analysis40.We start with a macro sector and regional analysis that captures the relative exposure of sectorsand regions to significant social risks and opportunities.41.We then derive a blended sector-region score, weighted by the entity’s sector and regionalbusiness mix. We can adjust the score to capture the entity’s exposure to specific sector orregional risk factors, if different from those of other entities in its sector or globally.42.To determine the entity’s business mix, we review the breakdown of its revenue, assets,employees, or any other relevant proxy by sector and region and use the proportions that moreaccurately describe the entity’s exposure to social risks and opportunities. As a result, the proxyused to determine the business mix could vary between companies within a sector.Entity-Specific Analysis43.To analyze whether the entity is actively and effectively managing its exposure compared withsimilar entities, we assess existing social policies and performance in terms of selected key socialindicators. We may then selectively adjust these factors as needed to ensure consistency andcomparability. We express the same five possible outcomes in the S Profile entity-specificanalysis: Leading (in few cases, when performance is quantitatively and consistently better thanStrong) Strong (when performance is stronger than industry standards) Good (when performance is in line with industry standards) Lagging (when performance is weaker than industry standards) Weak (in few cases, when performance is significantly and consistently worse thanLagging)Workforce And Diversity44.Our analysis incorporates how actively and effectively the entity is managing its direct and indirectexposure to risks and opportunities related to its employees and workforce diversity relative toother comparable entities.spglobal.com/ratingsdirectJune 17, 20209
Environmental, Social, And Governance Evaluation Analytical Approach45.In addition to our analysis of policies and mitigation strategies, we analyze data that indicate theentity’s strategy in terms of diversity and inclusion, and talent. For the latter, key indicatorscomprise employee retention and turnover rates as well as training hours per employee. We alsoconsider: Labor standards, pay, benefits, and rewards Employee engagement Proportion of contracted and unionized labor Engagement in promoting fair and humane labor standards across the value chainSafety Management46.We evaluate how actively and effectively the entity is managing its direct and indirect exposure torisks and opportunities related to safety among its workforce, customers, suppliers, andcommunities local to its operations, relative to other comparable entities.47.In addition to our analysis of policies and mitigation strategies, key indicators are the entity’sfrequency and severity of workplace incidents and its number of fatalities. Other considerationsinclude: Occupational health and safety for all employees (permanent, temporary, andcontractors) Product safety Engagement in promoting safety management across the value chainCustomer Engagement48.We look at how actively and effectively the entity is managing its direct and indirect exposure torisks and opportunities related to how it engages with customers, constituents, or residentsrelative to other comparable entities.49.Due to a lack of consistent data available to analyze an entity’s Customer Engagementperformance, our assessment is weighted more to our policy analysis for product safety and dataprivacy (see table 1). We use trend analysis for our quantitative analysis, and combined availablesector data to compare entity-specific performance. Important factors that we consider in ourqualitative and quantitative analysis include: Trends in customer satisfaction, retention, and complaints Anticipation of changing customer preferences Ability to ensure reliability and affordability of products Product recalls Protection of customer information Potential for misleading or misselling to customersCommunities50.We evaluate how actively and effectively the entity is managing its direct and indirect exposure torisks and opportunities related to its engagement with local communities relative to othercomparable entities. In our opinion, less-exposed entities have built up social capital in localcommunities and are less likely to lose their social license to operate following a controversy witha plant, mine, or operation.51.Due to lack of consistent data available to analyze an entity’s Communities performance, weweight our assessment more to our policy analysis for human rights and social standards in thesupply chain (see table 1). As above, we use trend analysis for our quantitative analysis andspglobal.com/ratingsdirectJune 17, 202010
Environmental, Social, And Governance Evaluation Analytical Approachavailable combined sector data to compare entity-specific performance. Important factors thatwe consider in our qualitative and quantitative analysis to complement the policy analysis include: Direct operations and suppliers' engagement with local communities, includingcontributions to and support of local communities, such as local hires and donations Exposure to war, other conflicts, and terrorismFinal S Profile And General Adjustment52.As with the E Profile, the S Profile combines the entity-specific assessments with the blendedsector-region score to produce a ranking from 1-100. A higher rank indicates our view that theentity is operating in sectors and regions with relatively lower social exposure, more effectivelymanaging its exposure, more likely to take advantage of changes among stakeholders, and lesslikely to experience negative financial and reputational consequences from its social exposurerelative to other entities. The four social factors might carry different weights by sector to capturetheir relative importance in our assessment. For example, the importance of communities mightbe weighted more toward high street retailers than the business services sector.53.The general adjustment reflects risks and opportunities affecting the S Profile that the fourfactors might not fully capture. Typical reasons we would apply a general adjustment include: Relative strengths or weaknesses in the entity’s social management system Materiality or severity of social risks or opportunities not fully captured elsewhere General policy strengths or deficiencies Use of third-party protocols or recognized certifications for social standards Significant outperformance or underperformance not fully captured in the factorassessments Any social factor not specifically captured in the factor assessments Major events or controversies impacting multiple factors Comparisons with the S Profiles of other entitiesGovernance Profile54.The governance profile (G Profile) reflects our view of the extent to which observable governancestandards and practices could indicate that the entity is likely to experience a significantgovernance failure relative to other entities on a global basis. It also reflects our view of theeffectiveness of the entity’s governance framework.55.Our analysis of corporate and institutional governance is a fundamental element of the ESGEvaluation. Our focus in the G Profile is on the near-term governance structure and facts that wecan observe about governance today. Separately, we assess the influence of governance on theentity’s long-term strategy, planning, and resulting culture in Preparedness, as discussed furtherbelow.56.First, we apply the jurisdiction-based scores to the entity based primarily on the location of itshead office. We can adjust this head office-led score to account for potential risks of operating incountries with weaker governance standards.57.Then we consider four key entity-specific factors (structure and oversight, code and values,transparency and report
among others. A high ESG Evaluation score indicates an entity is relatively less prone to experiencing material ESG-related events, and relatively better-positioned to capitalize on ESG-related growth opportunities, compared to en tities with lower ESG Evaluation scores.
