Transcription
Reducing and Preventing Homelessness: AReview of the Evidence and Charting aResearch Agenda1A Report Prepared for the Abdul Latif Jameel Poverty Action LabJuly 2019William N. EvansWilson Sheehan Lab for Economic OpportunitiesUniversity of Notre DameDavid C. PhillipsWilson Sheehan Lab for Economic OpportunitiesUniversity of Notre DameKrista RuffiniGoldman School of Public PolicyUniversity of California at BerkeleyThe authors would like to thank Ingrid Gould Ellen, Rachel Fyall, Ed Olsen, and Jim Sullivan for commenting on earlyversions of this work. Jacob Binder, Kelsey Taeckens, and Evelina Smirnitskaya at J-PAL North America providedexcellent assistance cross-referencing, ensuring quality, and copy-editing. Particular thanks go to Rohit Naimpally whomade vital contributions to initiate, coordinate, and inform this project. This project received financial support from JPAL North America. Any remaining errors remain the responsibility of the authors.1
I.IntroductionIn the 1870s, large numbers of able-bodied men hopped the newly built railroads that crisscrossedthe country in search of economic opportunities in America’s rapidly growing cities. Many of these menarrived in cities with few possessions and little money. As they struggled to find affordable nightlyaccommodations in their new cities, the first homelessness crisis in the modern United States was born(Kusmer 2002; DePastino 2010). The influx of immigrants to the United States in the late 19th and early 20thcenturies (Peters 1990), the Great Depression (Schumbert 1935; Crouse 1986), the de-institutionalization ofthe mental health system in the 1970s (Dear and Wolch 1987), the AIDS crisis of the 1990s (Rossi 1990),veterans returning from wars in Iraq and Afghanistan (Eckholm 2007), and increased prevalence of eviction(Desmond 2016) have all changed both the number and composition of the homeless over time.Regardless of the people afflicted or time period under consideration, homelessness may be both acause of and one of the more extreme outcomes of poverty. As such, how governments at all levels andprivate philanthropy respond to homelessness is of paramount importance. In this paper, we catalog theresponses to the challenge of homelessness, the existing literature on the effectiveness of these strategies, andthe major gaps that need to be addressed in future research. While many forms of evidence can beinformative, we prioritize studies that convincingly measure the causal impact of existing strategies onoutcomes of interest. In discussing the existing work on program effectiveness, we focus heavily on highquality impact evaluations, especially those from randomized controlled trial (RCT) evaluations and the bestquasi-experimental designs. Likewise, as we discuss the gaps in our current understanding, we focus onquestions that can be addressed with these same methods. Throughout the paper, we restrict our review ofevidence and interventions to North America in order to focus the conversation on a specific policy contextwhile making recommendations for areas of future research with a view towards the North America-specificevidence base and ecosystem of data availability.This review is valuable for at least four reasons. First, the human toll of homelessness is high, andunderstanding how best to serve this vulnerable population is crucial. On a given night, more than 500,000people experience homelessness, and 1.42 million pass through shelters in a given year (Solari et al. 2016).1
These numbers have mostly decreased since national measurement began in earnest: between 2012 and 2016homeless counts in the point-in-time estimates fell by 11.5 percent. However, these numbers have driftedupwards in the most recent counts, driven by large increases in cities such as New York, Los Angeles, Seattle,and San Francisco. In contrast, using a broader definition of homelessness, the Common Core of Datadatabase indicates that the number of students experiencing homelessness has increased each year since 2009,reaching over 1.3 million students during the 2015–16 school year (Snyder et al. 2018).Second, the financial resources devoted to combatting homelessness are substantial. Direct federalfunding for local organizations to combat homelessness totals about 6.1 billion annually (USICH 2018). Thisis, however, only a fraction of the dollars devoted to this issue. State and local governments, as well as privatedollars, all contribute to fighting homelessness. While there is no systematic data on the amount of nonfederal sources of funds for the nation as a whole, anecdotal data suggests these numbers are large. Forexample, New York City spends a total of 1.8 billion on programs for people experiencing homelessness andonly about one third comes from federal dollars (Johnson and Levin 2018).Third, the organization of services for the homeless has evolved considerably over the past thirtyyears. Local resources have become more coordinated. Historically, a patchwork of local public agencies andprivate organizations have spearheaded the fight against homelessness. Since 1995, the United StatesDepartment of Housing and Urban Development (HUD) has required each community to submit a singlecomprehensive Continuum of Care (CoC) application with the intent to stimulate community-wide planningand program coordination (HUD 2012).2 To facilitate the distribution of federal dollars to the areas with thehighest need, HUD has required CoCs to conduct a point-in-time estimate of the homeless population since2007, providing annual estimates of the homeless population under a common definition. Along the sametimeline, many communities have moved toward “coordinated entry” systems. While homelessness programsA CoCs is a regional or local organization that coordinates homelessness prevention and mitigation programs forindividuals and families experiencing homelessness. A CoC can be as large as a state (such as MT-500) or serve a smallpopulation (such as MD-510 for Garret County, with a population of only 29,500). In 2007, there were 461 CoCs in theUnited States and its territories. By 2017, this number had fallen to 397.22
remain spread across many organizations, communities now frequently funnel clients through a commonportal that aims to direct those with housing needs to those with appropriate resources.Finally, the types of services provided have fundamentally transformed over time. Twenty years ago,much of the resources centered on local homeless shelters. These shelters were part of a linear treatmentprogram where a person experiencing homelessness was required to participate in and graduate from shortterm residential and treatment programs before obtaining permanent housing. In these programs, residentshad to satisfy preconditions, such as sobriety, before they could move into a permanent residence. In the late1990s and early 2000s, new voices advocated for a model that prioritizes immediate housing. This approach isguided by the belief that providing basic necessities such as housing and food are preconditions to solvingother problems like finding employment or dealing with substance use issues. Evidence was a fundamentalpart of this new model from the beginning. The Pathways to Housing demonstration project by Tsemberisand Eisenberg (2000) provided evidence that a “Housing First” model applied to permanent, supportivehousing could effectively house chronically homeless people. A successful randomized evaluation of HousingFirst programs for veterans (Rosenheck et al. 2003) led to a massive expansion of the US Department ofHousing and Urban Development Veterans Administration Supportive Housing (HUD-VASH) programwhich has distributed more than 97,500 vouchers to veterans experiencing homelessness since 2008. Theseinitial experiences have made the Housing First model the preferred treatment option for people who arechronically homeless and special populations, including veterans and those facing mental health andsubstance use issues. The same rationale has expanded the general approach of providing immediate housingto non-permanent forms of assistance. For example, rapid re-housing programs, which provide immediatetemporary subsidies for market housing, have replaced many traditional programs for people experiencingsomewhat less chronic situations of homelessness. These large changes in the organization and content ofhomelessness services suggest it is time to take stock of what we know and do not know about theeffectiveness of current programs.In the next section, we outline how homelessness is defined across federal agencies, discuss thosegroups most at risk of becoming homeless, and examine how the patterns of homelessness have changed3
over time. In Section III, we outline current methods for reducing and preventing homelessness, and inSection IV we review high-quality research measuring the effectiveness of such methods. In Section V, wediscuss some of what we believe to be key outstanding research questions.II.Measuring homelessness and the extent of the problemA.Defining homelessnessMeasuring the number of people who are experiencing homelessness requires a definition ofhomelessness. Unfortunately, there are a variety of definitions across government programs and agencies thatcomplicate measurement. School-aged children “who lack a fixed, regular, and adequate nighttime residence”are eligible for educational benefits for homeless children under the McKinney-Vento Homeless AssistanceAct. The definition includes children living in shelters and those living in “public or private places not ordinarily used as a regular sleeping accommodation for human beings” as well as children “who are sharingthe housing of others” or living in “motels, hotels, trailer parks, or camping grounds due to the lack ofalternative adequate accommodations.” While the McKinney-Vento definition includes people whom manywould consider homeless—those living in shelters, in cars, or on park benches—it also controversiallyincludes children sharing housing of others, or doubled-up. As we outline below, the doubled-up numbers areenormous. Currently, this group is not eligible for federal HUD homelessness assistance. The HomelessEmergency Assistance and Rapid Transition to Housing (HEARTH) Act, 3 passed in 2009, defines thoseeligible for HUD assistance if they meet one of four definitions of homelessness: a) Living in a place that isnot meant for habitation, which includes emergency shelters and transitional housing; b) people who areexpected to lose their residence within fourteen days, including people living in doubled-up arrangements; c)families with children that are unstably housed; d) people fleeing domestic violence. Under this definition,those doubled-up are only eligible for funds if they are about to become homeless. Proposed legislation suchas H.R. 32 in 20124 and the Homeless Children and Youth Act (HCYA) of 2017 in the Senate5 sought toH.B. 1877, 111th U.S. Congress, available at: -bill/1877H.R. 32, 112th U.S. Congress, available at: -bill/325 S.B. 611, 115th U.S. Congress, available at: e-bill/611/text344
expand the HEARTH definition to include those doubled-up. Although HCYA was supported by over 400homeless advocacy groups (Bardine 2015), the bill was met with some resistance from some nationalorganizations such as the Corporation for Supportive Housing and the National Alliance to EndHomelessness (NAEH 2015). These groups argued that the bill greatly expands the number of homelesswithout a corresponding change in funding and hence would divert resources from more challenging cases ofhomelessness. As we outline below, whether one includes doubled-up families in the homeless countschanges the number and trends in homelessness dramatically.B.Overall magnitude and risk factorsThe primary data on homeless incidence come from the annual point in time (PIT) count conductedon a single night in January. The count was started in sixty municipalities in 1983 and a nationwidemethodology was adopted in 2007. Nationwide, the counts are organized by a local CoC. The shelteredhomeless are counted on an annual basis and unsheltered counts are required at least once every two years,with odd calendar years being required years. PIT counts must be conducted during the last ten calendar daysin January. Sheltered locations include homeless shelters, domestic violence shelters, hotels and motels wherethe rent is paid for by a public or private agency because the person is experiencing homelessness, safe havensand transitional housing. Those living in doubled-up arrangements are not included.In column 1 of Table 1, we report the rate of homelessness per 100,000 people in 2017 from the PITestimates.6 In subsequent rows, we report the rate for some specific demographic subgroups. In column 2, wereport the share of the population from a particular group, and in column 3 we report the share of thoseexperiencing homelessness in that group. The numbers from column 3 are taken from the 2013—2017American Community Survey (ACS) or from other sources as indicated in the table. In the final column, wereport the risk ratio, which for a dummy variable x is Pr[ℎ𝑜𝑚𝑒𝑙𝑒𝑠𝑠 𝑥 1] / Pr[ℎ𝑜𝑚𝑒𝑙𝑒𝑠𝑠 𝑥 0]. A valueof 2 means that having x 1 doubles your chance of homelessness. The rate for males and females will simply6These numbers are for the fifty states and the District of Columbia.5
be inverses of each other and the rate for African Americans is the value compared to non-AfricanAmericans.Reading down the rows of the table, males comprise 60 percent of people experiencing homelessnessand have a 60 percent higher chance of homelessness than females. Hispanics are 25 percent more likely to behomeless than non-Hispanics. Across racial groups, Asians and Whites are far less likely to be experiencinghomelessness as people not in those groups. Native American/Alaska Natives, African Americans, andPacific Islanders are 4, 5, and 7.5 times as likely to be experiencing homelessness as people not in therespective group. African Americans are only 13 percent of the population but are 41 percent of those whoare experiencing homelessness. There is little difference by the age groupings but a shortcoming of theaggregate PIT data is that it has a broad age range for the oldest age group.The PIT estimates report homeless counts for families with children under 18 and unaccompaniedchildren under 18. Pooling these groups and comparing to all others, families with children are less likely toexperience homelessness than single individuals or those in families without children.In the next set of rows, we report the numbers for special groups. In many of these situations, weuse estimates from sources other than the ACS to generate the denominator. In each of these cases, thegroup with special needs has much higher rates of homelessness. Veterans are 25 percent more likely to behomeless than non-veterans. The four other groups are severely over-represented among those experiencinghomelessness. The National Institutes of Mental Health estimates that among adults, 3.3 percent of thepopulation is experiencing severe mental illness. This group, however, represents one-fifth of all peopleexperiencing homelessness, with a risk ratio approaching 8. Chronic substance users have a risk ratio of threeand are one-sixth of the homeless population. In the population, three-tenths of 1 percent are HIV-positive,but one in thirteen people experiencing homelessness are, leading to a risk ratio of 25. Finally, those fleeingdomestic violence are one-twentieth of the population but represent one-sixth of all people experiencinghomelessness, implying a risk ratio in excess of 3.7The denominator in this estimate is most likely in error. The PIT count includes children and adults that are victims ofdomestic violence. The best estimate we could get on domestic violence incidence rates are from the National IntimatePartner and Sexual Violence Survey from 2010. These estimates indicate that 5.9 percent of females and 5 percent of76
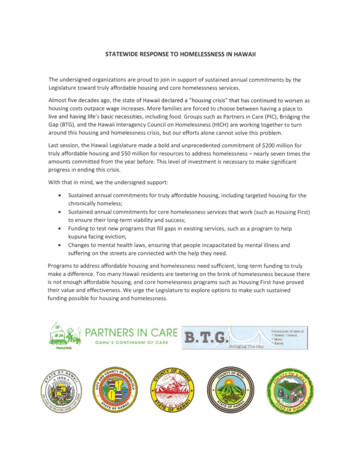
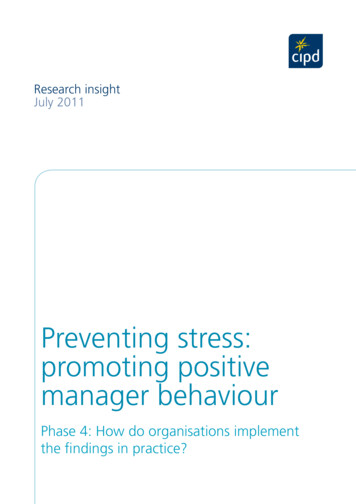
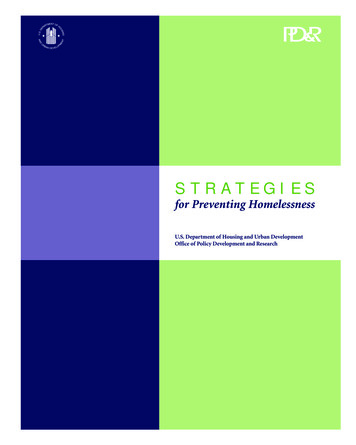
In the last group of estimates, we generate risk ratios based on the type of area served by the CoC. Inmany cases, local areas are served by multiple CoCs (e.g., Los Angeles County has four CoCs) while someCoCs have overlapping jurisdictions (e.g., CoCs near Chicago and Boston). Evans et al. (2019) group CoCs byservice area and we use their mapping of CoCs to generate these numbers. Homelessness is much moreprevalent in large metro areas. The risk ratio for CoCs in the top ten metro areas (by population) is 2.5 whilethe number falls to 1.4 for the 15 largest metro areas. In other metro areas and non-metro areas, the risk ratiois much less than 1. What we do not know is whether there is a difference in the accuracy of the PITestimates based on city size. If the non-sheltered homeless are more difficult to count in less urban areas, therisk ratio for these areas could be vastly understated.C.Trends in point-in-time countsFigure 1 shows the annual PIT estimates from 2007 to 2018. The number of people experiencinghomelessness declined 15 percent from 2007 to 2016 with most of the decline for unsheltered homelessness,which declined by 31 percent over the same period. Since 2016, however, the unsheltered homeless countshave increased by 10 percent. Measured as a rate (number experiencing homelessness per 100,000),homelessness has declined 21 percent since 2007. The decline in homelessness has been across a broad rangeof groups. In Figure 2, we report the time series numbers for a number of different subgroups from 2007 to2018. Homelessness among veterans peaked in 2010 and fell 50 percent over the next eight years.Homelessness among non-veterans fell by about 9 percent over the same period and among the chronicallyhomeless by almost 20 percent over the entire period. Homelessness among people in families fell by 25percent from its 2010 peak, but only 10 percent for individuals from its 2007 peak.Not all areas have experienced a decline in homelessness. The trends in New York City (CoC NY600) and Los Angeles County8 have been particularly different from the rest of the country. In Figure 3, themales aged 18 or older nationwide experience rape, domestic violence or stalking in the past 12 months. We use thesenumbers to generate a rate for the nation as a whole. We suspect that the majority of those experiencing homelessness inthis case are women and children and generating a rate for this group would most likely produce a much higher riskratio.8 Here we pool data for the four CoCs in Los Angeles County to represent the entire county.7
solid lines report homelessness rates (x 100,000) for Los Angeles County and New York City (right verticalaxis). Note that since 2012, these rates have increased by 57 and 31 percent, respectively. The impact of thesetwo cities is dramatic for state and national estimates. While these cities represent less than 6 percent of thenation’s population, they accounted for a quarter of the homeless population in 2017. The dotted lines withthe same shade represent the rest of the states of California and New York (left vertical axis), respectively.Note that the homelessness rates for the rest of California have fallen by 13 percent over this same period(although the rate increased between 2016 and 2017) while the rate in the rest of New York has beenunchanged. Nationwide, rates have fallen 14 percent since 2012 and national rates excluding Los AngelesCounty and New York City (dashed black line, left axis) have fallen 24 percent. It is tempting to suggest thisis simply a “big city” phenomenon, as other large cities have experienced big increases in the homelessnessrate since 2012 including Seattle (21 percent), San Francisco (10 percent), Berkeley/Oakland (23 percent), andSacramento (24 percent). This pattern, however, is not universal: some large and growing cities haveexperienced massive declines in homelessness including Phoenix (-20 percent), Houston (-54 percent),Dallas/Fort Worth (-46 percent), San Diego (-14 percent), and Atlanta/Fulton County (-40 percent).What is happening in New York and Los Angeles is an open question. These two cities have thehighest numbers of people experiencing homelessness and the shocking increases in homelessness rates forthese areas can drive national estimates. The causes appear to be local. The Los Angeles CoC (CA-600) hasexperienced a 75 percent increase in homeless counts, but in the other three CoCs in Los Angeles County(Glendale, Long Beach and Pasadena), homeless counts fell 40 percent. Likewise, there are two CoCs in thestate of New York (Westchester and Nassau) and four in New Jersey (Bergen, Newark, New Brunswick, andMonmouth) that border the New York City CoC, and homeless counts in these CoCs were roughly the samein 2017 as they were in 2012. It is possible that the explanation is not the same for both cities. In New YorkCity, 62 percent of the increase is from families with children under 18. In Los Angeles, this group onlyrepresents about 7 percent of the increase. In New York City 97 percent of the increase is in the shelteredhomeless population, whereas 99 percent of the increase in Los Angeles is in the unsheltered population.8
Rent levels cannot explain the dramatic increase in New York and Los Angeles, but can explain someof the differences in homelessness rates across CoCs. Figure 4 shows the relationship between median rentfor a one-bedroom apartment and homelessness rates across CoCs in 2017. There is a clear positiverelationship between rent levels and homelessness; however, this relationship is far from perfect (𝑅2 0.16).Los Angeles County and New York City appear as the clear, large outliers above the regression line, with rentlevels predicting some but not most of their very high rates of homelessness. Figure 5 shows the same graphin changes between 2010 and 2017. The positive relationship between rent and homelessness weakens (𝑅2 0.03) when considering changes. While rent levels can explain some differences in homelessness rates acrossCoCs, changes in rent levels hold little predictive power.D.Challenges to measurementThe PIT estimates are subject to many limitations. First, the estimate is at a point in time. Thenumber of people experiencing homelessness over a longer interval will be larger by construction. TheHomeless Management Information System (HMIS) is a nationwide network of local IT systems that collectclient-level data for people entering sheltered services. These systems are organized at the CoC level and mosthomeless shelters across the country are part of the HMIS system. In 2016, HMIS produced an un-duplicatedcount of 1.42 million people in the shelter system (Solari et al. 2016). The comparable estimate of shelteredpeople from the PIT estimate was 373,571. Along this dimension, the point-in-time component of theestimate understates annual exposure by a factor of almost four.9Given the difficulty in finding people who are unsheltered, the PIT estimates will also systematicallyunderstate the size of this group. The PIT procedures are designed to locate as many of this group as possibleby visiting where people experiencing homelessness are known to congregate. The procedure will miss peoplein more obscure places and will miss those not wanting to be counted. To obtain an estimate of theundercount of the unsheltered, some have used a plant-recapture technique where paid plants are sent toHMIS, though, may overstate exposure to the extent that migrants across CoC borders and de-identified individuals(e.g. minors) enter HMIS more than once but cannot be de-duplicated.99
locations where enumerators are known to visit and subsequently report back as to whether they weresurveyed (Laska and Meisner 1993; Shaw et al. 1996; Hopper et al. 2008; McCandless et al. 2016). Studies byLaska and Meisner (1993) and Hopper et al. (2008) done decades apart in New York City both found PITestimates understate the rate of unsheltered homelessness by about 40—50 percent.As mentioned earlier, the PIT estimates do not include those doubled-up. Doubling-up is verycommon, particularly among low-income families, who might double-up in order to avoid material hardship(Mykyta and Pilkauskas 2016). Mykyta and Macartney (2011) use data from the Current Population Surveyand estimate that in March 2010, 24.1 percent of households were doubled-up. Pilkauskas, Garfinkle andMcLanahan (2014) note that among participants in Fragile Families and Child Wellbeing Study, 50 percenthad lived doubled-up as an adult. Participants in the Family Options Study usual care group were more thanthree times more likely to live doubled-up than have stayed in an emergency shelter in the previous sixmonths (Gubits et al. 2016). While the exact extent is hard to measure, the data above indicate that doublingup is quite common.The best estimates of the extent of doubling up are reported by the National Center for EducationStatistics (NCES). Since 1987, schools have been required to report to the NCES the number of studentsexperiencing homelessness as defined by McKinney-Vento. These data are aggregated over a school year andhence are not a point-in-time estimate but, rather, are estimates of who experienced homelessness over theprevious year. Aggregate counts of these numbers are available from the 2009–10 school year through 2016–17 for all students in public PK-12 schools. The NCES reports the number of students in four categories:sheltered and unsheltered homeless, which are comparable to the definitions used by the PITs, those living inhotels/motels, and those doubled-up. While the PIT includes those in hotels/motels if a family’s stay is paidfor by a third party, the NCES definition is much broader.In Table 2, we report a comparison of estimates of those experiencing homelessness by categoryfrom the 2014–15 NCES and the 2015 PIT. In the top half of the table we report the direct comparisons ofsheltered and unsheltered homelessness between the two sources. The numbers in parentheses are rates per100,000. The NCES includes everyone in public PK-12 schools. The numbers for the PIT are all children10
under the age of 18, including those too young for school. Dividing the population under 18 by the numberof students in public school generate a ratio of 1.46, so if homelessness rates are uniform by age, dividing thePIT estimates by 1.46 should make them comparable to the NCES numbers. In the NCES estimates therewere 180,302 individuals experiencing homelessness in shelters and the corresponding number for the PIT is111,692. Dividing this by 1.46 generates 76,501. The ratio of the full-year to the PIT estimate is then 2.4,which is smaller than the factor of four listed above comparing the HMIS full-year unduplicated numberscompared to the PIT estimates. In the second half of the table, we report counts from non-PIT categories.The motels/hotels number is comparable in magnitude to the scaled PIT estimate for the sheltered homeless.More importantly, there are over a million children doubled-up. Overall, the number of children experiencinghomelessness from the PIT is one-tenth the number according to the NCES.The numbers in Figures 1—2 tell an encouraging story that homelessness has been declining in mostof the country over the past decade. Unfortunately, including doubled-up housing situations in homelesscounts changes numbers dramatically not only in the cross-section, but in the time series as well. In Figure 6,we report time series of homeless counts from the NCES for the sheltered, doubled-up and total homelessalongside sheltered PIT counts.10 The sheltered count from the PIT shows a decline that is fairly pronouncedover the final three years. In contrast, the NCES numbers are increasing throughout the time period. Totalhomelessness in the NCES data increased by 55 percent throughout the period with 75 percent of theincrease among those doubled-up.E.Costs of homelessnessIn addition to affecting many people, homelessness generates very large private and public costs.Most obviously, people lose access to any surplus value of their prior housing over and above the cost of thathousing. Unfortunately, many such private benefits are difficult to measure. The public cost of housingsomeone who is experiencing homelessness is more straightforward to measure. Spellman et al. (2010) foundUnfortunately, the HUD exchange does not report homeless children for all years so the most comparable series wecan report are sheltered homeless families with children. In 2014, children were 59 percent of this group. For school year2009—2010 we report the PIT estimates from 2010.1011
that the average cost of housing a newly homeless family or individual for the duration of them experiencinghomelessness is upwards of 2,000.The other public costs of homelessness potentially swamp the direct cost of housing. Since thepioneering work of Culhane et al. (2002), a number of authors have attempted to estimate the public costs ofhomelessness at the local level. One of the more extensive of these case studies was from Santa Clara County,California where administrative data on homelessness was linked to records for various other public services(Flaming et al. 2015). The cost of all public services averaged 83,000 per person experiencing homelessnessper year. Of that total, 53 percent was related to healthcare and 34 percent to criminal justice. Only 13percent came from all other social welfare services, including homelessness services but also foster care, food,and cash assistance. This specific case study matches what is known from other contexts. As noted above,people who are experiencing homelessness are more likely to experience health issues such as mental
This review is valuable for at least four reasons. First, the human toll of homelessness is high, and understanding how best to serve this vulnerable population is crucial. On a given night, more than 500,000 people experience homelessness, and 1.42 million pass through shelters in a given year (Solari et al. 2016).