Transcription
A few thoughts about qualitative data analysis.This could apply to unstructured or parts of semi-structured interviews, written text, or openquestion that are part of a questionnaire.Two ways of analysing qualitative data (Gibbs, 2007, pp. 44-45).1. Concept-DrivenExamine your findings with a pre-defined framework, obtained from your reading, which reflectsyour aims, objectives and interests - ‘framework analysis’ (Pope et al, 2000).2. Data-DrivenMore exploratory perspective, encouraging you to consider and code all your data, allowing for newimpressions to shape your interpretation in different and unexpected directions - “thematic networkanalysis” (Attride-Stirling, 2001).Of course, you can mix these approaches.1. Is quite easy. You will have questions to answer, facts to obtain, theories to support. You willsimply need to look for answers to questions, facts, information etc in your interviews.2. Is more difficult and I will focus on that here.“Qualitative researchers soon realize that there are no universally agreed right answers to questionssuch as the style of interviewing they should use to collect their data or which approach to dataanalysis they should adopt or how they can identify a theme in their analysis or the exact criteriathey should use to evaluate their research” (Lyons, 2007, p. 3).The basic procedure is simple. You are listening to the interviews or reading the texts, simply tryingto find out what the writers or speakers are talking about. However, you need to support that withsome theory.So, the first thing you need to do is to listen to the interviews or read the texts and identifythemes/categories/groups of similar ideas.Some computer software may be able to help you here.Compleat Lexical Tutor (http://www.lextutor.ca) can help you to look at word frequencies andidentify keywords. If words are used frequently, it will probably be the case that they are consideredimportant and can help you to identify themes.A program such as Wordle (http://www.wordle.net) can draw nice diagrams – again based on wordfrequency.
Both these websites are very easy to you and may help you get started with identifying themes.A more sophisticated program (that needs installing) that can do this is NVivo(https://www.qsrinternational.com/). It is more sophisticated in that it understands synonyms.If you like working with computers and computer programs, you might want to install it, but it isprobably too complicated for a small research project.Andis probably good enough.The generic name for these kinds of programs is CAQDAS (Computer Aided Qualitative Data AnalysisSoftware) and they can be helpful. However:“It is important that software is seen as providing tools to support rather than drive analysis. Mostprograms have sufficient flexibility in design that they can be adapted to a researcher's chosenmethodological approach. Software will not do an analysis for you, nor can it think for you. Rather,its data management and querying capacity supports you to carry out your analysis by removing thelimitations imposed by paper processing and human memory” (Bazeley, 2013, p. 18).Ultimately you have to do the thinking yourself; you need to decide what the texts are about, youneed to look for the main and subsidiary themes in the texts. This is what is called coding inqualitative data analysis. Coding is the organisation of raw data into conceptual categories. Eachcode is effectively a category or ‘bin’ into which a piece of data is placed.
“Codes are tags or labels for assigning units of meaning to the descriptive or inferential informationcompiled during a study. Codes are usually attached to ‘chunks’ of varying size – words, phrases,sentences or whole paragraphs” (Miles and Huberman, 1984, p. 56).There are many methods for coding, although Thomas believes that “some of these [techniques] areuseful; others, in my opinion, make things appear to be more difficult than they really are”.Although, there are many different techniques of coding, the most useful is the ConstantComparative Method (Glaser & Strauss, 1967, ch. 5) and Gary Thomas (Thomas, 2013, p. 235-238 – Ilike this book. There is now a third edition) argues that “it stands behind every technique in thisparadigm.The constant comparative method involves: going through your data again and again (this is the constant bit), comparing each element - phrase, sentence or paragraph - with all of the other elements(this is the comparative bit).There's nothing more complicated than that.Thomas’s method is:1. Read all of your data. interview transcripts, diaries, notes from unstructured observationsetc.2. Make an electronic copy of all of your raw data. Mark it ‘RAW’ You now have two copies:your raw data and your working data files. Keep them separate and keep the 'RAW’ onesomewhere safe.3. Now read through your working files. As you are reading, underline, Mark, label or highlightparts that you think are important. (This is the process of coding.) As you proceed, you willget an impression of important ideas or subjects that are recurring. We can call these yourtemporary constructs. Make a list of these.4. Read through the data again, using the list of temporary constructs from your first reading tocheck against. Draw up a grid with the temporary construct on the left, and page referencesto where the construct is evidenced on the right. Make notes and observations on the gridas you do this. You will get quite a long list.5. Eliminate any temporary constructs that do not seem to have been reinforced in the rest ofthe data. Don’t delete that actual data itself, though - it may form an important counterexample against the general themes that are emerging. Highlight these counter-examples ina different colour on your working data records, and keep a separate list of them.6. From the second reading, come up with second-order constructs that seem to be making agood ‘'fit’ with your data. These second-order constructs should make a good job ofsummarising the important themes in your data.7. Look through once more refining these second-order constructs now as marker-posts for theorganisation of your data. Once you are satisfied that these capture the essence of yourdata, label these as your themes.
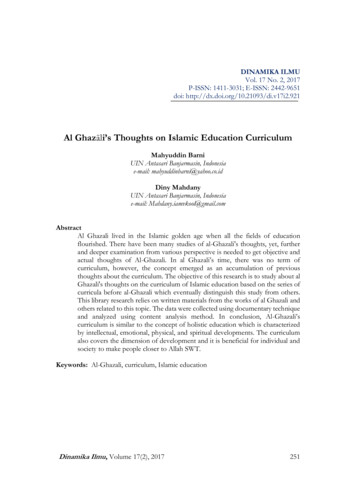
8. Think about the themes. How do they seem to be connecting together? What matches withwhat? Are there any unanimous areas of agreement? Are there any contradictions orparadoxes?9. Find ways of mapping your themes (see below under network analysis and constructmapping).10. Select good quotations or sections from your work to illustrate the themes.(Thomas, 2013, p. 236Point 9 suggests that you might want to draw diagrams and charts: Network analysis Construct mapping and theme mapping(Thomas, 2013, p. 235-238) Matrices(Miles and Huberman, 1984, p. 95-121).Network analysisIn network analysis you aim to show how one idea is related to another using a network, which is abit like a tree, with a trunk that forms the basic idea and branches coming off the trunk representingconstituent ideas:Including quotations:
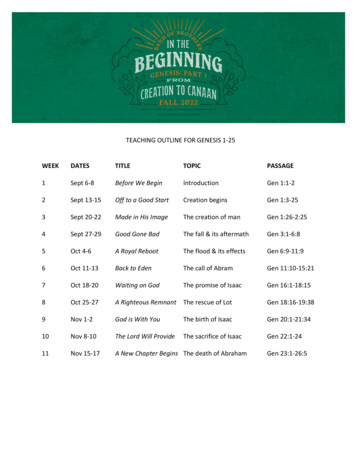
Construct mapping and theme mappingWhile network analysis provides a hierarchical arrangement, mapping puts those themes insequential order from the interview and uses lines and arrows to make the connections between theideas and themesAnd with quotations:
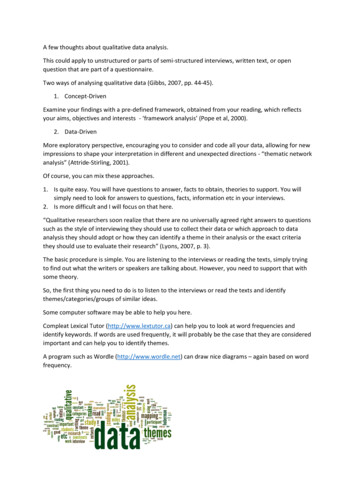
MatricesOnce you have your diagram, you can include it and write about it.For examples of writing this up, g J. (2001). Thematic networks: An analytic tool for qualitative research. QualitativeResearch, 1(3), 385–405.Bazeley, P. (2013). Qualitative data analysis: Practical strategies. London: Sage.Gibbs, G. (2007). Analysing qualitative data. London: Sage.Glaser, B. G. & Strauss, A. L. (1967). The discovery of grounded theory: Strategies for qualitativeresearch. London: Aldine.Lyons, E. (2007). Doing qualitative research: Initial questions. In E. Lyons and A. Coyle (eds.),Analysing qualitative data in psychology (pp. 3-8). London: Sage.Miles, M. B. and Huberman, A. M. (1984). Qualitative data analysis: A sourcebook of new methods.Thousand Oaks, CA: Sage.Pope, C., Ziebland, S., and Mays, N. (2000). Analysing qualitative data. British Medical Journal, 320,114–116.Saldana, J. (2015). The coding manual for qualitative researchers (3rd ed.). London: Sage.Thomas, G. (2013). How to do your research project (2nd ed.). London: Sage.
Coding is the organisation of raw data into conceptual categories. Each . mapping). 10. Select good quotations or sections from your work to illustrate the themes. (Thomas, 2013, p. 236 . Thematic networks: An analytic tool for qualitative research. Qualitative Research, 1(3), 385-405. Bazeley, P. (2013). Qualitative data analysis .