Transcription
An empirical comparison ofmachine learning classificationalgorithms&Topic ModelingA quick look at 145,000 World Bank documentsOlivier Dupriez, Development Data GroupSlides prepared for DEC Policy Research Talk, February 27, 2018
The 2014 call for a Data Revolution Use data differently (innovate) New tools and methods Acomparative assessment ofmachine learning algorithms Use different data (big data, ) Text as data Topic modelingapplied to the World BankDocuments and Reports corpus
An empirical comparison ofmachine learning classificationalgorithms applied to povertypredictionA Knowledge for Change Program (KCP) project
Documenting use and performance Many machine learning algorithms available for classification We document the use and performance of selected algorithms Application: prediction of household poverty status (poor/nonpoor) using easy-to-collect survey variables Focus on the tools use “traditional” data (household surveys) Not a new idea (SWIFT surveys, proxy means testing, survey-to-surveyimputation, poverty scorecards; most rely on regression models) Possible use cases: targeting; simpler/cheaper poverty surveys
Key questionNOT“What is the best algorithm for predicting[poverty]?”BUT“How can we get the most useful [poverty]prediction for a specific purpose?”
Approach1. Apply 10 “out-of-the-box” classification algorithms Malawi IHS 2010 – Balanced classes (52% poor ; 12,271 hhlds) Indonesia SUSENAS 2012 - Unbalanced classes (11% poor ; 71,138 hhlds) Data: mostly qualitative variables, including dummies on consumption (hhldconsumed [item] – Yes/No). Did not try to complement with other data.2. Challenge the crowd: data science competition to predict povertystatus for 3 countries (including MWI)3. Challenge experts to build the best model for IDN, with noconstraint on method4. Apply automated Machine Learning on IDN
Reproducible and re-purposable outputJupyternotebooks Reproduciblescript, output,and commentsall in one file
Multiple metrics used to assess performancePoorNon poorActualPredictedPoorNon uenegativeTNAccuracy: (TP TN) / AllRecall: TP / (TP FN)Precision: TP / (TP FP)F1 score: 2TP / (2TP FP FN)Cross entropy (log loss)Cohen - KappaROC – Area under the curve(Calculated on out-of-sample data)
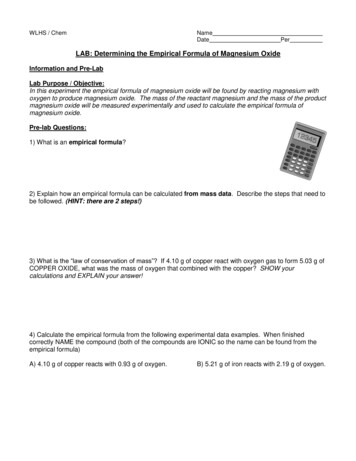
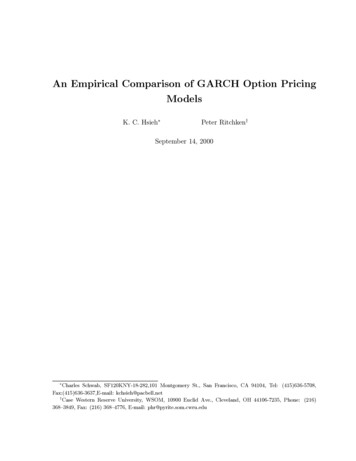
Plot the true and false positiverates for every possibleclassification threshold A perfect model has a curvethat passes through the upperleft corner (AUC 1) The diagonal representsrandom guessing (AUC plained/True positive rateArea under the ROC curve (AUC)False positive rate
10 out-of-the-box classification algorithmsWith scaling, boosting, over- or under-sampling as relevantImplemented in Python; scikit-learn for all except XGBoost
Results - Out-of-the-box algorithms (MWI)Algorithm (no feature engineering)(Results for selected models)Support Vector Machine (SVM) CVMultilayer Perceptron CVXGBoost selected featuresSVM CV IsotonicLogistic Regression – WeightedXGBoost, all features CVSVM FullLogistic Regression FullRandom Forest, AdaboostDecision Trees, AdaboostAccuracy Recall 0No clear winner (best performer has a mean rank of 5)
Results - Out-of-the-box algorithms (IDN)Algorithm(Results for selected models)Logistic RegressionMultilayer PerceptronLinear Discriminant AnalysisSupport Vector MachineK Nearest NeighborsXGBoostNaïve BayesDecision TreesRandom ForestDeep LearningAccuracy Recall 10.1870.000CrossROC 080.0009.5No clear winner ; logistic regression again performs wellon accuracy measure
Results – Predicted poverty rate (IDN)Difference between predicted and measured poverty rateLogistic regression-3.1%Multilayer perceptron-0.4%Support vector machine-8.2%Decision trees0.0%Random forest-3.5%Not a very good model,but achieves quasiperfect prediction of thepoverty headcount (falsepositives and falsenegatives compensateeach other)Estimated on full dataset A good poverty rate prediction is not a guaranteeof a good poverty profile
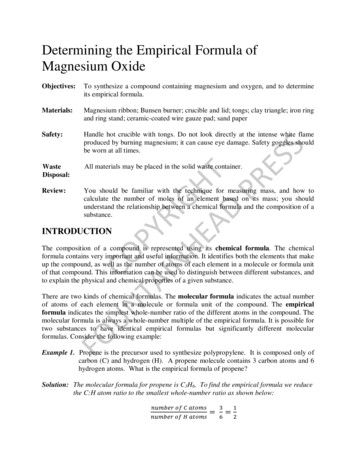
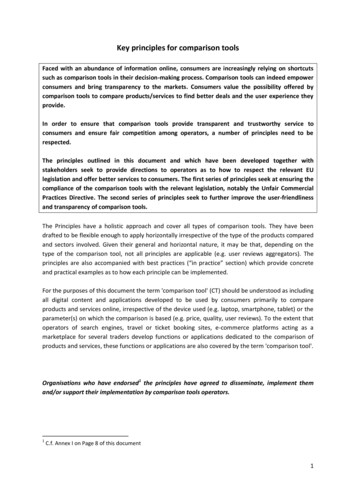
Ensembling (IDN) Diversity of perspectives almostalways leads to betterperformance 70% of the households werecorrectly classified by every oneof the top 20 models 78% of poor households weremisclassified by at least onemodel We take advantage of thisheterogeneity in predictions bycreating an ensembleInter-model agreement for misclassifications (IDN)Fraction of top 20 models in error
Results: soft voting (top 10 models, IDN)(Max was 0.6)Major improvement in recall measure, but low precisionError on poverty rate : 8.9%
Can the crowd do better? Data science competition onDrivenData platform Challenge: predict householdpoverty status for 3 countries(including MWI)
Data science competition - ParticipationAs of February 22Unique submissionsNumber4,525Individuals signed-up2,081Individuals submitted479Distribution of registered participants by nationality (for those who provided this information at registration)
Results (so far) on MWISlightly better than the best of 10 algorithmsGood results on all metricsScore
Experts – Advanced search for a solution (IDN) Intuition: a click-through rate (CTR) model developed for GooglePlay Store’s recommender system could be a good option High dimensional datasets of primarily binary features; binary label Combines the strengths of wide and deep neural networks But requires a priori decision of which interaction terms themodel will consider impractical (too many features to considerinteraction between all possible pairs) Solution: Deep Factorization Machine (DeepFM) by Guo et al.applied to IDN
Automated Machine Learning (AutoML) Goal: let non-experts build prediction models, and makemodel fitting less tedious Let the machine build the best possible “pipeline” of preprocessing, feature ( predictor) construction and selection,model selection, and parameter optimization Using TPOT, an open source python framework Not brute force: optimization by genetic programming Starts with 100 randomly generated pipelines; select the top20; mutate each into 5 offspring (new generation); repeat
Automated Machine Learning - TPOThttps://github.com/EpistasisLab/tpot
Automated Machine Learning applied to IDN A few lines of code, but a computationally intensive process(thousands of models are tested) 2 days on a 32-processors server (200 generations) TPOT returns a python script that implements the bestpipeline IDN 6 pre-processing steps including some non-standard ones(creation of synthetic features), then XGBoost (models assessed onf1 measure) A counter-intuitive pipeline; it works, but not clear why
Results: DeepFM, TPOT, and some others (IDN)AlgorithmDeepFMxgb full undersample cvlr full oversample cvnb full undersample cv isotonicsvm full undersample cvmlp full undersample cvrf full undersample cv adalr l1 feats oversample cvTPOTlda full oversample cvAccuracy Recall 60.6000.524CrossROCCohen Meanentropy AUCKapparank0.163 0.9430.5583.5710.376 0.9320.4484.1430.347 0.9260.4714.7140.402 0.9320.4345.7140.402 0.9330.4355.8570.391 0.9300.4346.7140.530 0.9310.4296.8570.383 0.9150.4087.2860.622 0.8150.5557.5710.425 0.9220.4089.286 DeepFM is the best model on many metrics, but with an issue on recall TPOT is the best performer on f1 and does well on accuracy, but overall it isfar from the top performing models
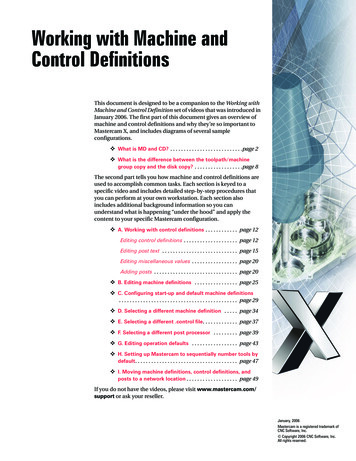
DeepFM and TPOT – Confusion matricesDeepFMTPOT
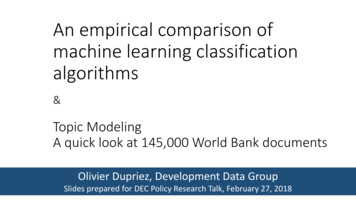
Next steps Analysis of misclassifications Test robustness over time Assess impact of sample size Expand to regressionalgorithmsDistribution of predictions around the poverty linePL Complement existing andongoing researchSVM model for Bangladesh 2010
Some takeaways ML provides a powerful set of tools for classification/prediction Predicting poverty rates is challenging (we need better predictors more than weneed better tools) Results should always be reported using multiple quality metrics Different performance metrics are appropriate for different purposes Good model model “fit for purpose” Quality has multiple dimensions (predictive performance, computationalconstraints, interpretability, and ease of deployment/maintenance/updating) Openness and full reproducibility must be the rule Open data when we can ; open source software preferably ; open scripts always Documented scripts published in GitHub (Jupyter Notebooks, R Markdown) Need a metadata standard for cataloguing, and to foster meta-learning
Topic ModelingA quick look at 145,000 WorldBank documents
Improving data (and document) discoverability Our data discovery solutionsare not optimal E.g., searching “inequality” inthe WB Microdata Library onlyreturns 17 surveys Reason: relies on full-textsearch on survey metadata “Inequality” not in surveymetadata One solution: mine theanalytical output of surveys(70,000 citations)
Improving data (and document) discoverability What we want: Fully automatic extraction of topics covered in these documents An open source solution which does not require a pre-defined taxonomy (nota topic tagging system) One solution: Latent Dirichlet Allocation (LDA) algorithm LDA topics are lists of keywords likely to co-occur User-defined parameter for the model: number of topics Before applying it to survey citations, we tested it on the WBDocuments and Reports - a well curated collection of 200,000documents openly accessible through an API
Preparing data Text isunstructured,sometimes messydata A “cleaning”process isrequired
Preparing data - Procedures We clean the text files (Python, NLTK library) Detect language; keep document if 98% in English Lemmatization (convert words to their dictionary form) Remove numbers, special characters, and punctuation Remove words that are not in the English Dictionary Remove stop-words (“and”, “or”, “the”, “if”, etc.) We obtain a clean corpus (145,000 docs ; 800 million words) Generate a “bag of words” (documents/terms matrix) We run the LDA model (Mallet package) Output published in a topic browser (adapted from dfr-browser)
Analysis: differences across regionsAFREAPECALACMENASAR1980 – lience,risk,water,vulnerability
Analysis: differences across document ilience,risk,water,vulnerabilityProject documentsPublications & Research
Analysis: differences across document typesProject wledge,market,economy,competitivenessPublications & Research
Analysis: differences across document typesProject l,home,return,diasporaPublications & Research
Analysis: differences across document typesProject olicy,area,communityPublications & Research
Finding documents based on topic composition1234567Model and methods for estimating the number of people living in extreme poverty because of thedirect impacts of natural disastersThe Varying Income Effects of Weather Variation - Initial Insights from Rural VietnamWeathering storms : understanding the impact of natural disasters on the poor in Central AmericaThe exposure, vulnerability, and ability to respond of poor households to recurrent floods in MumbaiClimate and disaster resilience of greater Dhaka area : a micro level analysisWhy resilience matters - the poverty impacts of disastersThe poverty impact of climate change in Mexico
Finding closest neighborsUpload or select a document, and find the N closest neighbors, e.g.:Monga, C. 2009. Uncivil societies - a theory of sociopolitical changeTop 10Inclusion matters : the foundation for shared prosperityRepresentational models and democratic transitions in fragile and post-conflict statesHow and why does history matter for development policy ?Somalia and the horn of AfricaLimited access orders in the developing world :a new approach to the problems of developmentIntersubjective meaning and collective action in 'fragile' societies : theory, evidence and policy implicationsEquilibrium fictions : a cognitive approach to societal rigidityThe new political economy : positive economics and negative politicsThe politics of the South : part of the Sri Lanka strategic conflict assessment 2005 (2000-2005)Civil society, civic engagement, and peacebuilding
Expanding the corpus (not yet implemented)A fully automated system collects documents from WB and otherorganizations, “cleans” them, extract topics, and update the browserand search UIWeb scraping (cron job; e.g. weekly run)Process documents and infer topicsPublish in browser / search interface
Automated Machine Learning (AutoML) Goal: let non-experts build prediction models, and make model fitting less tedious Let the machine build the best possible "pipeline" of pre-processing, feature ( predictor) construction and selection, model selection, and parameter optimization Using TPOT, an open source python framework