Transcription
SHRINKAGE OF LATEX-MODIFIED AND MICROSILICA CONCRETE OVERLAYMIXTURESByPatricia M. BuchananThesis presented to the Faculty of theVirginia Polytechnic Institute and State Universityin partial fulfillment of the requirements for the degree ofMaster of ScienceinCivil EngineeringCommittee:Richard Weyers, ChairThomas CousinsCarin Roberts-WollmannMichael SprinkelMay 15, 2002Blacksburg, VirginiaKeywords: Latex-Modified Concrete, Microsilica Concrete, Shrinkage, Bridge Deck OverlaysCopyright 2002, Patricia M. Buchanan
SHRINKAGE OF LATEX-MODIFIED AND MICROSILICA CONCRETE OVERLAY MIXTURESPatricia Buchanan(ABSTRACT)Highway bridge decks are often overlaid to extend service life by reducing the rate ofchloride ion ingress and the rate of corrosion of reinforcing steel in the sound chloridecontaminated concrete that is left in-place. Bridge deck overlays in Virginia are usually eitherlatex-modified concrete or microsilica concrete, and both types of overlay are consideredequivalent in terms of performance. However, the latex-modified concrete overlays are moreexpensive to construct than the microsilica concrete overlays. Thus, it is important to determineif these overlays do perform equivalently to ensure that short-term savings do not lead to higherlong-term costs.Shrinkage is one of the overlay performance parameters. Shrinkage is a threedimensional deformation of concrete that results in an overall reduction in volume. Totalshrinkage may be measured under either restrained or unrestrained conditions.This research examines the shrinkage performances of Virginia Department ofTransportation-approved latex-modified and microsilica concrete overlay mixtures and wasconducted on both field-sampled and laboratory-fabricated restrained and unrestrainedspecimens. Based on crack and delamination surveys of sampled bridge decks and laboratorytest results, a shrinkage performance-based specification for the Virginia Department ofTransportation was developed.There was no significant difference between the unrestrained shrinkage values of latexmodified and microsilica concrete overlay mixtures for the specified time periods. Restrainedmicrosilica concrete specimens generally cracked earlier and more frequently than restrainedlatex-modified concrete specimens. However, the bridge deck crack and delamination surveysshow that construction conditions and quality and traffic type and frequency may have a greatereffect on cracking than the overlay material.
ACKNOWLEDGEMENTSFirst, I would like to thank Dr. Richard Weyers for his invaluable advice and assistancewith this project. I also have a great appreciation for Dr. Thomas Cousins and Dr. CarinRoberts-Wollmann for their guidance as members of my committee.I am grateful to Mr. Michael Sprinkel for his guidance as a member of my committee aswell as the Virginia Transportation Research Council for funding this project. Special thanks goto the VTRC technicians who helped with sample collection, testing, and bridge deck crack anddelamination surveys.I am deeply indebted to David Mokarem for teaching me everything I needed to knowabout the testing equipment and for all his help with specimen preparation. I could not havecompleted this research without his help, advice, and patience.I would also like to thank Dr. Christine Anderson-Cook and Juan Li (Julie) of theStatistics Department for helping me gain a better understanding of statistics and performingseveral analyses.Many thanks go to the faculty and staff of the Structural Engineering and MaterialsDepartment for valuable learning experiences and support over the past six years.I would like to express my gratitude to my parents, Dr. Ronald Buchanan and DarleneBuchanan, and my sisters, Sharon, Theresa, and Stephanie, for their love, support, and patienceas one year of graduate school became two years.I am deeply grateful to my fiancé, Matthew Aguirre, for his love, support, understanding,patience, and for allowing me to monopolize his computer.Finally, I would also like to thank all my friends, Sarah Manning, Anna Leung, WilliamSchooley, Jean-Philippe Guizol, Michael Brown, Trevor Kirkpatrick, and Ed Vincent for theirsupport and help throughout my entire college career.iii
TABLE OF CONTENTSACKNOWLEDGEMENTS.iiiTABLE OF CONTENTS.ivLIST OF FIGURES.viLIST OF TABLES.viiINTRODUCTION.1PURPOSE AND SCOPE.2METHODS AND MATERIALS.3Field Overlay Sampling.4Laboratory Overlay Sampling.5RESULTS.8Field Overlays.8LMC Overlays.8MSC Overlays.8Bridge Deck Surveys.13Laboratory Mixtures.13LMC Mixtures.13MSC Mixtures.17DISCUSSION.19Field Overlays.19Laboratory Overlay Mixtures.21Influence of Cement Content.21Influence of Different 7 Bag Mixture Designs.21Influence of Latex Content.22Influence of w/c.22Influence of Curing Time.24Comparison of Laboratory LMC and MSC Mixtures.24iv
DIX A: SHRINKAGE LITERATURE REVIEW.28APPENDIX B: FIELD CONDITIONS DURING SAMPLING.42APPENDIX C: AMBIENT LABORATORY AIR TEMPERATURE AND RELATIVE HUMIDITY.46APPENDIX D: COMPRESSIVE STRENGTH AND MODULUS OF ELASTICITY.48APPENDIX E: RAPID PERMEABILITY RESULTS.52APPENDIX F: BRIDGE DECK CRACK AND DELAMINATION SURVEY RESULTS.59APPENDIX G: RESULTS OF STATISTICAL ANALYSES.66APPENDIX H: ALL-INCLUSIVE TEST MATRIX.68VITA.70v
LIST OF FIGURESFigure 1: AASHTO PP34-99 Specimen Construction.3Figure 2: Field LMC Overlay Unrestrained Shrinkage, Average and 95% CL.9Figure 3: LMC-WC Combined Ring Crack Width and Length.10Figure 4: Field MSC Overlay Unrestrained Shrinkage, Average and 95% CL.11Figure 5: SF-56 Combined Ring Crack Width and Length.11Figure 6: SF-150/10 Combined Ring Crack Width and Length.12Figure 7: SF-150/FC Combined Ring Crack Width and Length.12Figure 8: LMC-WCL-7.5, LMC-WCL-7, and LMC-WCL-6.5B Mixtures Unrestrained Shrinkage,Average and 95% CL.14Figure 9: LMC-WCL-6.5, LMC-WCL-6.5A, and LMC-L2 Mixtures Unrestrained Shrinkage, Averageand 95% CL.15Figure 10: LMC-WCL-7.5 Combined Ring Crack Width and Length.15Figure 11: LMC-WCL-7 Combined Ring Crack Width and Length.16Figure 12: LMC-L2 VDOT Specification Mixture Combined Ring Crack Width and Length.16Figure 13: LMC-WCL-6.5 (w/c 0.38) Combined Ring Crack Width and Length.17Figure 14: Laboratory MSC Mixtures Unrestrained Shrinkage, Average and 95% CL.18Figure 15: SF-L3 Combined Ring Crack Width and Length.18Figure 16: LMC and MSC Average Field Overlay Unrestrained Shrinkage.20Figure 17: Average LMC and MSC Same Contractors Field Overlay Unrestrained Shrinkage.21Figure 18: Comparison of 7 Bag Mixtures, Unrestrained Shrinkage.22Figure 19: Comparison of Latex Content, Unrestrained Shrinkage.23Figure 20: Comparison of w/c, Unrestrained Shrinkage.23Figure 21: LMC and MSC Laboratory Overlay Mixtures, Average Unrestrained Shrinkage.24Figure C1: Ambient Laboratory Air Temperature and Relative Humidity as a Function of Time.47vi
LIST OF TABLESTable 1: Field Sample Mixture Designs.4Table 2: LMC and MSC Field Sampling Plan.4Table 3: Laboratory Mixture Proportions, SSD Conditions.6Table 4: LMC Overlay Laboratory Test Matrix.6Table 5: MSC Overlay Laboratory Test Matrix.6Table 6: Curing Regimes for Permeability Testing.7Table 7: Unrestrained Shrinkage Values.10Table 8: Crack Data Summary.10Table 9: Bridge Deck Crack and Delamination Survey.13Table B1: LMC-1.1 Conditions.43Table B2: LMC-1.2 Conditions.43Table B3: LMC-WC Conditions.44Table B4: SF-56 Conditions.44Table B5: SF-150/10 Conditions.45Table B6: SF-150/FC Conditions.45Table D1: LMC-1.1 Compressive Strength and Modulus of Elasticity.49Table D2: LMC-1.2 Compressive Strength and Modulus of Elasticity.49Table D3: LMC-WC Compressive Strength and Modulus of Elasticity.49Table D4: SF-56 Compressive Strength and Modulus of Elasticity.49Table D5: SF-150/10 Compressive Strength and Modulus of Elasticity.49Table D6: SF-150/FC Compressive Strength and Modulus of Elasticity.50Table D7: LMC-L2 Compressive Strength and Modulus of Elasticity.50Table D8: LMC-WCL-7.5 Compressive Strength and Modulus of Elasticity.50Table D9: LMC-WCL-7 Compressive Strength and Modulus of Elasticity.50Table D10: LMC-WCL-6.5 Compressive Strength and Modulus of Elasticity.50Table D11: LMC-WCL-6.5A Compressive Strength.51vii
Table D12: LMC-WCL-6.5B Compressive Strength.51Table D13: SF-L3 Compressive Strength and Modulus of Elasticity.51Table D14: SF-L7 Compressive Strength and Modulus of Elasticity.51Table E1: Rapid Chloride Permeability of Latex Modified Concrete Overlay Samples.53Table E2: Rapid Chloride Permeability of Micro-silica Modified Concrete Overlay Samples.53Table E3: Influence of Cement Content and Curing Conditions on Rapid Chloride Permeabilityin Coulombs.54Table E4: Comparison of Two 7 Bag LMC Mixtures and Curing Conditions on Rapid ChloridePermeability in Coulombs.55Table E5: Influence of Latex Content and Curing Conditions on Rapid Chloride Permeability inCoulombs.56Table E6: Influence of Water-to-Cement Ratio and Curing Conditions on Rapid Chloride Permeabilityin Coulombs.57Table E7: Influence of Moist Curing Period on Rapid Chloride Permeability in Coulombs.58Table F1: Crack and Delamination Survey of LMC Overlay at 293 Days After Placement,Route 1 NBL.60Table F2: Crack and Delamination Survey of LMC Overlay at 224 Days After Placement,Route 1 SBL.61Table F3: Crack and Delamination Survey of LMC Overlay at 289 Days After Placement,Wilson Creek Bridge.62Table F4: Crack and Delamination Survey of Microsilica Overlay at 282 Days AfterPlacement, Route 56 WBL.63Table F5: Crack and Delamination Survey of Microsilica Overlay at 278 Days AfterPlacement, Route 150 NBL Over Route 10.64Table F6: Crack and Delamination Survey of Microsilica Overlay at 235 Days AfterPlacement, Route 150 SBL Over Falling Creek.65Table G1: Results from Statistical Analyses Performed Using SAS.67Table H1: All-Inclusive Test Matrix.69viii
INTRODUCTIONHighway bridges are often overlaid to reduce the rate of chloride ion diffusion to thereinforcing steel and extend the service life of the bridge. In Virginia, these overlays aregenerally either a latex-modified concrete (LMC) or a microsilica concrete (MSC). Both typesof overlay mixture are considered to perform equivalently despite a lack of research into theircomparative performances. However, they are not equivalent in cost. A LMC overlay mixturehas to be mixed on-site in a mobile mixer, which is more expensive than a MSC overlay mixturethat can be mixed at any concrete plant and trucked to the site. Thus, most new overlays inVirginia are MSC. It is therefore important to determine if both LMC and MSC overlays do, infact, perform equivalently to ensure that short-term savings do not lead to higher long-term costs.One performance assessment parameter of concrete overlays is its shrinkage. Shrinkageis a three-dimensional deformation of concrete that results in an overall reduction in volume.Typically, the shrinkage of a concrete specimen is expressed as a linear strain since one of thedimensions is significantly larger than the other two and “the effects of shrinkage are greatest inthe largest dimension” (Aïtcin, et al, 1997). As these internal strains increase, so does thepotential for cracking (Shah, et al, 1998). Cracks may ease the ingress of moisture, oxygen, andchloride ions to the depth of the reinforcing steel. This, in turn, may lead to an increase in therate of corrosion of the steel and a reduction in service life.There are four types of shrinkage: plastic, autogenous, drying, and carbonation. Plasticshrinkage is caused by water loss from the surface of concrete within a few hours of placementwhile the concrete is still plastic and before it gains any significant strength (Soroushian andRavanbakhsh, 1998). Autogenous shrinkage takes place as a result of cement hydration anddevelops isotropically within the concrete mass (Aïtcin, et al, 1997). Drying shrinkage occurs inthe hardened concrete as free water evaporates from the capillary pores (Tazawa and Yonekura,1987). Carbonation shrinkage is poorly understood but is the result of carbonation of thehydrated cement products (Soroka, 1979). Total shrinkage can be measured under eitherrestrained or unrestrained conditions.This research examines the shrinkage performances of Virginia Department ofTransportation-approved LMC and MSC overlay mixtures. The research was conducted on bothfield-sampled and laboratory-fabricated specimens. The results of this research were used todevelop a suggested shrinkage performance specification.1
PURPOSE AND SCOPEThere are three objectives of this research. The first is to assess the shrinkage strains andshrinkage cracking of both latex-modified and microsilica concrete bridge deck overlaymixtures. The second is to determine whether or not microsilica concrete overlays areequivalent to latex-modified concrete overlays from a shrinkage standpoint. The final objectiveis to develop a shrinkage performance specification for LMC and MSC overlays in order tominimize cracking.To accomplish these objectives, field samples were collected from six bridge overlayprojects in Virginia. Three sets of samples were from LMC overlays and three were from MSCoverlays. Laboratory specimens based on the mixture designs of the field overlays were madeand subjected to different curing regimes. Both restrained and unrestrained shrinkage specimenswere tested. Approximately half of each mixture’s unrestrained specimens were stored in acontrolled temperature and relative humidity environment while others were stored in ambientair in the laboratory. In addition to shrinkage testing, specimens were cast for compressivestrength and modulus of elasticity; rapid permeability tests were also conducted to aid in thedevelopment of the shrinkage performance specification.2
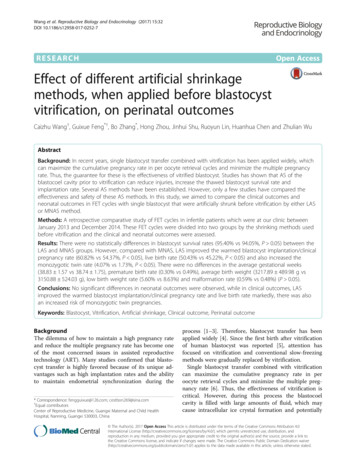
METHODS AND MATERIALSThe restrained drying shrinkage of the concrete specimens was tested per AASHTOPP34-99, Practice for Estimating the Crack Tendency of Concrete (AASHTO Provisional, 2000).This test method requires casting a 76 mm wide by 152 mm high concrete ring around a 305 mmdiameter steel ring, as shown in Figure 1. Strain gages are attached to the interior of the steelring at quarter points to monitor the strain caused by the shrinkage of the concrete. As theconcrete shrinks, the steel ring is placed in compression; the resulting compressive strain shoulddecrease as the concrete cracks. These cracks were visually monitored approximately biweeklyfor changes in length and width. Crack widths were measured using a crack comparator andcrack lengths were measured with a standard ruler.Figure 1: AASHTO PP34-99 Specimen ConstructionThe unrestrained shrinkage testing was conducted on prisms measuring 75 mm by 75 mmby 286 mm per ASTM C157, Standard Test Method for Length Change of Hardened HydraulicCement Mortar and Concrete (ASTM, 2001). For this test method, the length change of eachprism is measured. The measurements were made with a comparator every day for the firstseven days and then once every seven days thereafter for a minimum of ninety days. Theselength changes were then converted to percent shrinkage.3
The compressive strength was tested according to ASTM C 39, Compressive Strength ofCylindrical Concrete Specimens, using steel end caps and neoprene pads (ASTM, 2001). The102 mm by 203 mm cylinders were tested at 7, 28, 56, and 90 days of age.The modulus of elasticity was measured per ASTM C 469, Standard Test Method forStatic Modulus of Elasticity and Poisson’s Ration of Concrete in Compression (ASTM, 2001).One 152 mm by 305 mm cylinder was cast from each truck sampled for field samples and onefor each laboratory mixture. Each cylinder was tested at 7, 28, 56, and 90 days.The Virginia Transportation Research Council performed the rapid permeability testsaccording to AASHTO T277, Electrical Indication of Concrete’s Ability to Resist Chloride IonPenetration (AASHTO, 2000). The test was modified for the LMC specimens to allowformation of the polymer film. The 102 mm by 203 mm cylinders were tested at 7, 28, and 90days.Field Overlay SamplingThe Virginia Department of Transportation (VDOT)-approved mixture proportions forthe field samples are summarized in Table 1 and are for one cubic meter of concrete based onSSD conditions.Table 1: Field Sample Mixture DesignsMSC OverlaysRt. 56Rt. 150(Falling Creek and Rt. 10)Cement: Type I/II (kg)377363Silica Fume (kg)3027Sand (kg)899844Stone (kg)831864Water (kg)163156AEA (mL)39 - 310as req.Water Reducer (mL)1587 - 37130HRWR (mL)0 - 53001393 - 3125Latex (kg)00w/cm0.400.40LMC OverlaysRt. 1Wilson Creek Bridge(NBL and SBL)(7 bag 38The field samples were tested according to the sampling plan outlined in Table 2.Table 2: LMC and MSC Field Sampling PlanLMC OverlaysNumber of Specimens/SampleStructureSamplesPrisms Rings StructureRt. 1 NBL322Rt. 56Rt. 1 SBL342Rt. 150/10Wilson Creek362Rt. 150/FC4MSC OverlaysNumber of Specimens/SampleSamplesPrisms Rings322342362
Both sets of samples from Rt. 1 near Doswell, Virginia, were from the same bridge butwere taken from different placements, one from the northbound lane overlay placement and onefrom the southbound lane overlay placement. This bridge is located near a quarry; thesouthbound lanes carry loaded quarry trucks that return over the northbound lane empty. Incontrast, the Wilson Creek Bridge in Blacksburg, Virginia, experiences little traffic since it ispart of a test roadway. The Wilson Creek Bridge was the only newly constructed bridge sampledas part of this research. The 7 bag overlay mixture sampled from this bridge was a replacementfor the original 7.5 bag overlay mixture that had been placed previously. The original overlayexperienced a large amount of cracking soon after placement, so it was removed and the overlaymixture was redesigned.The Rt.56 bridge is located in rural Nelson County, Virginia, and experiences little trafficvolume although it does experience some heavy truck traffic due to loaded log trucks. Incontrast, the sampled bridges from Rt. 150 outside Richmond, Virginia, experience heavy trafficvolumes but this traffic consists mainly of cars and light trucks.The field samples were used to compare the effects of the contractor as well as todetermine whether there is a significant difference in the overall performances of LMC and MSCoverlays. Both overlays from Route 150 were performed by the same contractor, as were bothoverlays sampled from Route 1. With the exception of the specimens from the Wilson CreekBridge, half of the prisms were stored at a controlled temperature of 23 C 2 C and relativehumidity of 50% 4%, while the remaining specimens were stored in uncontrolled laboratoryair. Temperature and relative humidity variations in the laboratory were measured and recorded.For the Wilson Creek Bridge prism specimens, two specimens from each sampling site werestored in the controlled environment with the remaining four stored in the uncontrolledenvironment.Field samples were collected for restrained and unrestrained shrinkage, compressivestrength, modulus of elasticity, and permeability testing. All MSC permeability specimens weremoist cured for three days, then were stored in 38 C water except while the specimens werebeing tested. All LMC permeability specimens were moist cured for two days, then were storedin 38 C air except while the specimens were being tested to allow the polymer film to form.After nine to twelve months, the bridge decks from which field samples were taken wereexamined for cracking and delaminations. The purpose of this inspection was to compare fieldperformance with laboratory results.Laboratory Overlay SamplingThe mixture designs for laboratory specimens are summarized in Table 3 and are for aone cubic meter batch. The mixtures designated as SF-L3, SF-L7, and LMC-L2 areprop
latex-modified concrete or microsilica concrete, and both types of overlay are considered equivalent in terms of performance. However, the latex-modified concrete overlays are more expensive to construct than the microsilica concrete overlays. Thus, it is important to determine