Transcription
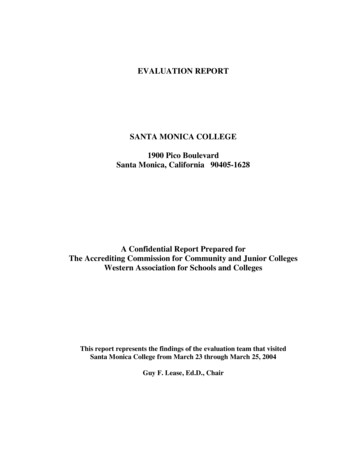
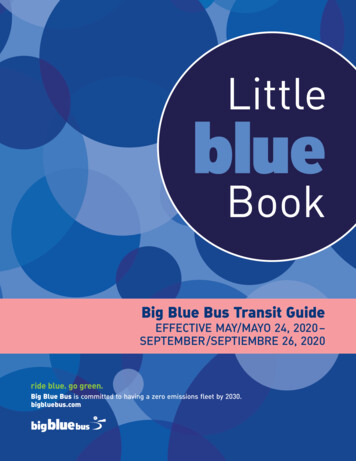
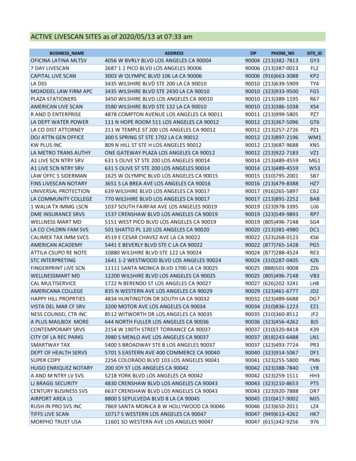
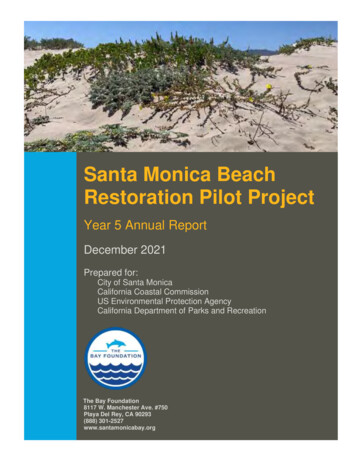
Santa Monica BeachRestoration Pilot ProjectYear 5 Annual ReportDecember 2021Prepared for:City of Santa MonicaCalifornia Coastal CommissionUS Environmental Protection AgencyCalifornia Department of Parks and RecreationThe Bay Foundation8117 W. Manchester Ave. #750Playa Del Rey, CA 90293(888) 301-2527www.santamonicabay.org
Year 5 Annual Report, December 2021Santa Monica Beach Restoration Pilot ProjectYear 5 Annual ReportDecember 2021Prepared by: The Bay FoundationPrepared for:City of Santa Monica, California Coastal Commission, US Environmental Protection Agency,California Department of Parks and RecreationAuthors:Karina Johnston, Chris Enyart, Maggie Jenkins, Dane Lazarus, Sara Cuadra, The Bay FoundationScientific Contributors:David Hubbard, Coastal Restoration Consultants, Inc.Dr. Jenifer Dugan, University of California Santa BarbaraDr. John Dorsey, Loyola Marymount University’s Coastal Research InstituteDan Cooper, Cooper Ecological Monitoring, Inc.Dr. Karen Martin, Pepperdine UniversityDr. Sean Anderson, California State University Channel IslandsDr. Guangyu Wang, Santa Monica Bay Restoration CommissionEvyan Sloane, California State Coastal ConservancySuggested Citation:Johnston, K., C. Enyart, M. Jenkins, D. Lazarus, and S. Cuadra. 2021. Santa Monica Beach RestorationPilot Project: Year 5 Annual Report. Report prepared by The Bay Foundation for City of Santa Monica,California Coastal Commission, US Environmental Protection Agency, and California Department of Parksand Recreation. 118 pages.AcknowledgementsWe would like to thank the US Environmental Protection Agency and the Metabolic Studio (AnnenbergFoundation; Grant 15-541) for funding the implementation of this pilot project, and our partners: City ofSanta Monica and California Department of Parks and Recreation. Their support has allowed us toexplore nature-based protection measures to increase coastal resilience, while bringing back animportant coastal habitat to the Los Angeles region. Thanks also to the students and interns with LoyolaMarymount University’s Coastal Research Institute who contributed many hours to implementation andmonitoring. We would also like to thank the many supporters of this project and members of the public,without whom it would not have happened.The contents of this report do not necessarily reflect the views and policies of the US Environmental ProtectionAgency or Metabolic Studio, nor does mention of trade names or commercial products constitute endorsement orrecommendation for use.
Year 5 Annual Report, December 2021Table of ContentsExecutive Summary. 1Introduction . 3Background . 3Project Goals . 4Project Description. 5Public Outreach. 9Selected Media Links . 12Permitting . 13Scientific Monitoring . 14Individual Protocols and Results . 14Wrack Cover . 16Vegetation Cover and Seedling Density . 20Vegetation Mapping . 29Invertebrates. 33Avifauna . 34Grunion and Other Wildlife. 39Physical Characteristics . 40Photo Point . 71Adaptive Management, Maintenance, and Site Use . 74Site Use . 76Conclusions and Recommendations . 78Literature Cited . 80
Year 5 Annual Report, December 2021List of FiguresFigure 1. Photo of the vegetated dunes in March 2021 on the right in contrast to the groomed beach onthe left. 4Figure 2. Photograph of the project site prior to restoration at Santa Monica Beach, Santa Monica, CA. . 6Figure 3. Map of the Santa Monica Beach Restoration Pilot Project location and general vicinity. . 6Figure 4. Artistic rendering overview of project area, post-establishment of vegetation (rendering credit:Studio-MLA). . 7Figure 5. Photograph of post-restoration project site in Year 1 (25 January 2017). . 8Figure 6. Photograph of post-restoration project site in Year 5 (11 April 2021). . 8Figure 7. Social media post promoting the project site and Coastal Cleanup Day on 17 September 2020(left) and soliciting stakeholder feedback on program priorities on 12 February 2021 (right). . 10Figure 8. Wrack survey transect at the restoration site (left) and control site (right). . 17Figure 9. Average percent cover of wrack by species (top) and trash and terrestrial debris (bottom) in therestoration area and control site across all surveys. Note variable y-axis for each graph. . 18Figure 10. Photograph of wrack transect at restoration site with primarily bare ground and sparsePhyllospadix sp. on 13 August 2021 (bottom). . 19Figure 11. Photograph of wrack line with unknown red algae on 30 October 2020. . 19Figure 12. Photograph of mixed wrack clump comprised of Phyllospadix sp. and an unknown red algaefound on 30 October 2020 (left) and photo of Macrocystis pyrifera found on the 21 May 2021 wracksurvey (right). . 20Figure 13. Photograph of various vegetation in restoration site. Top left: pink sand verbena; top right:red sand verbena; bottom left: beach evening-primrose; bottom right: beach salt bush. . 22Figure 14. Photograph of various vegetation in restoration site. Top left: woolly heads; top right: nonnative sea rocket; bottom: beach bur sage. . 23Figure 15. Relative percent cover by species for all transects (live vegetation only, 13-Dec-16 wasbaseline survey with no vegetation identified). . 24Figure 16. Average absolute native and non-native vegetation cover during all surveys within therestoration area (top) and at the control site (bottom). Asterisk (*) indicates two additional targetedtransects surveyed on 17 August 2021. . 25Figure 17. Photograph of various interspersed native vegetation scattered throughout the project sitewith areas of sandy bare ground (21 May 2021). . 26Figure 18. Juvenile beach evening-primrose within quadrat sampling, pencil used for scale. (30 October2020). . 28Figure 19. Absolute native vegetation cover within restoration site for August 2021 survey. . 29Figure 20. Representative photo of project area (13 August 2021). . 30Figure 21. Absolute % Cover of red sand verbena (Abronia maritima) (top) and beach bur sage (Ambrosiachamissonis) (bottom), August 2021 survey. 31Figure 22. Absolute % Cover of beach salt bush (Atriplex leucophylla) and beach evening-primrose(Camissoniopsis cheiranthifolia), August 2021 survey. 32Figure 23. Photograph of researchers conducting invertebrate core surveys (7 March 2019). 33Figure 24. Dune beetle identified on vegetation within the restoration area (5 February 2020). . 34During Year 5, many of the same avifauna species were identified as in previous years, including theCalifornia brown pelican (Pelacanus occidentalis californicus) and gulls. Birds were within the restoration
Year 5 Annual Report, December 2021area, adjacent control areas, and nearshore waters both flying over and foraging. Western snowyplovers (Charadrius alexandrinus nivosus) were not observed during the Year 5 targeted avian surveys,but were observed near and within the site during other on-site activities (Figure 25). Additionalavifauna surveys will continue to inform the identified species present and activities within and adjacentto the restoration area. 35Figure 26. Photograph of snowy plovers foraging directly outside of the project area (top) and whimbrelsforaging throughout the site (bottom) on 5 February 2020. . 35Figure 27. Photo within the restoration area from 30 March 2021. . 36Dan Cooper, an ornithologist, detected a nesting plover within the restoration area on 18 April 2017 andconfirmed the presence of one egg in a nest scrape containing bits of shells and adjacent debris. Thisconfirmed nest was the first one in the Los Angeles region in almost 70 years. Local, state, and federalagencies were all immediately notified along with the Santa Monica Audubon Society, an important localstakeholder group who have conducted bird surveys in Los Angeles for many decades and who maintainthe plover enclosure on the southern portion of Santa Monica Beach. On 24 April 2017, US Fish andWildlife Service (USFWS), who have jurisdiction over federally threatened species, several ornithologists,and TBF installed a mini-enclosure over the nest and confirmed the presence of three eggs. After themini-enclosure was installed, the male plover immediately returned to the nest (Figure 28).Unfortunately, over subsequent weeks, extremely high winds buried the nest, which was subsequentlyabandoned. While plovers were identified within the restoration area in the breeding season in 20182020, no subsequent nesting attempts were made (Figure 28.). Signs were posted around the perimeterof the site notifying the public of possible nesting. Crows and dogs have occasionally been observed andcould potentially deter plovers and other shorebirds from using and nesting in the site. . 37Figure 28. Photograph of nesting western snowy plover (credit: Tom Ryan 24 April 2017). . 37Figure 29. Map of WSP critical habitat (Subunit CA 45A) and restoration area boundary (Data source:USFWS ECOS 2018). . 38Figure 30. Dolphin photographed swimming offshore in front of restoration area (5 February 2020). . 40Figure 31. Monthly precipitation totals (inches) for the wet weather months (October-May). Dailyprecipitation data were downloaded from NOAA Climate Date Online (CDO) and originally recorded atthe LAX rain gauge. Asterisk indicates project installation month in December 2016. . 42Figure 32. TBF staff and CRI interns conducting an elevation profile survey on 21 May 2021. . 48Figure 33. Restoration Transect 1 elevation profiles during Winter Beach surveys (Elevation in NAVD88). 49Figure 34. Restoration Transect 1 elevation profiles during Summer Beach surveys (Elevation inNAVD88). 49Figure 35. Restoration Transect 2 elevation profiles during Winter Beach surveys (Elevation in NAVD88). 50Figure 36. Restoration Transect 2 elevation profiles during Summer Beach surveys (Elevation inNAVD88). 50Figure 37. Restoration Transect 3 elevation profiles during Winter Beach surveys (Elevation in NAVD88). 51Figure 38. Restoration Transect 3 elevation profiles during Summer Beach surveys (Elevation inNAVD88). 51Figure 39. Restoration Transect 4 elevation profiles during Winter Beach surveys (Elevation in NAVD88). 52
Year 5 Annual Report, December 2021Figure 40. Restoration Transect 4 elevation profiles during Summer Beach surveys (Elevation inNAVD88). 52Figure 41. Control Transect 1 (non-restored area) elevation profiles during Winter Beach surveys(Elevation in NAVD88). 53Figure 42. Control Transect 1 (non-restored area) elevation profiles during Summer Beach surveys(Elevation in NAVD88). 53Figure 43. Control transect 2 (non-restored area) elevation profiles during Winter Beach surveys(Elevation in NAVD88). 54Figure 44. Control transect 2 (non-restored area) elevation profiles during Summer Beach surveys(Elevation in NAVD88). 54Figure 45. Photograph of vegetated dune hummock within the restoration area (13 August 2021). . 55Figure 46. Photographs of vegetated dune hummocks within the restoration area on 21 May 2021 . 56Figure 47. (cont’d from above) Photographs of vegetated dune hummocks within the restoration areaon 21 May 202 . 57Figure 48. Year 1 (top, four months after implementation) and Year 2 topographic map of restorationsite. 58Figure 49. Year 5 topographic map of restoration site. The survey boundary was extended to capturedune buildup along the outside of the fence line. . 59Figure 50. Photograph of sand build-up along the northern fence line in the restoration area (top: 9 May2017, approximately five months after implementation; and bottom: 30 October 2020). . 60Figure 51. Sand buildup along the south side of the fencing (top) and along the east side of the fencing(bottom) on 30 March 2021. . 61Figure 52. Berm topography (top left: 17 December 2016, top right: 25 January 2017, bottom left: 8March 2018, and bottom right: 13 August 2021). . 62Figure 53. Sand grain in restoration site (left: pebbles; middle: coarse sand; right: medium to very finesand). 63Figure 54. Photographs showing larger grains at the base of the dune and finer grains on top due toaeolian processes (top: 29 April 2019; bottom: 5 February 2020). . 64Figure 55. Baseline (top) followed by post-restoration sand grain results for all transects (dry sampleaverages). . 65Figure 56 (cont’d from above). Post-restoration sand grain results for all transects (dry sample averages). 66Figure 57 (cont’d from above). Post-restoration sand grain results for all transects (dry sample averages). 67Figure 58. Photographs of eroded beach face following a winter king tide on 25 January 2017 (left) and agentler sloping beach face on 15 August 2018 during summer season (right). . 67Figure 59. Organics (loss on ignition) analysis on sand samples (18 July 2018). . 70Figure 60. Average percent organics in sediment samples by survey date (dry samples only). . 70Figure 61. Representative site photographs from 21 May 2021 and 17 August 2021 looking north. . 72Figure 62. Representative photos of the restoration area on 21 May 2021 looking south. . 73Figure 63. TBF staff and Marymount High School interns picking up trash as a part of adaptivemanagement on 13 August 2021. . 75Figure 64. Human use of the restoration site [top: a family using the symbolic pathway through themiddle of the restoration area (15 August 2020); second: summer beach visitors setting their chairs and
Year 5 Annual Report, December 2021towels around the restoration area (15 August 2020); third: beach visitors reading one of theinterpretive signs in the restoration area (21 May 2021); bottom: fisherman fishing oceanward of therestoration area (13 August 2021). . 77List of TablesTable 1. Summary of key parameters, protocols implemented, and survey dates. Asterisk indicatesbaseline survey. . 15Table 2. Seedling data results by species for 24 March 2017, 11 January 2018, and 22 February 2019reported as counts, average number / m², and extrapolated counts for the entire restoration area (boldrows). Asterisk indicates non-native species. . 27Table 3. Avifauna species identified as present in the restoration area and in the surrounding areaadjacent to the restoration. Data for all surveys were combined. . 36Table 4. Walker scale for monitoring California grunion runs. . 39Table 5. Results from grunion surveys conducted at the Santa Monica Restoration Site in Year 5. 40Table 6. Summary data for temperature and wind speed collected on site during surveys. Asteriskindicates NOAA data instead of in situ data due to equipment malfunction (January and February 2020). 43Table 7. Table displaying NOAA temperature and humidity monthly data for the Santa Monica MunicipalAirport Station (downloaded on 31 August 2020). . 44Table 8. Table displaying NOAA wind speed and precipitation monthly data for the Santa MonicaMunicipal Airport Station (downloaded on 31 August 2020). . 45Table 9. Grain size results from December 2016 (baseline) and post-restoration (March 2017, September2017, May 2018, November 2018, May 2019, November 2019). . 68
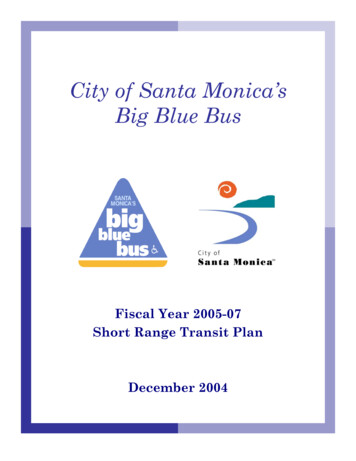
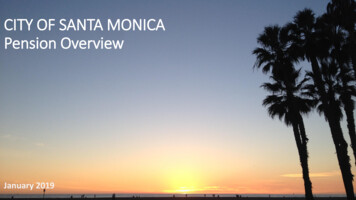
Year 5 Annual Report, December 2021Executive SummaryThis report summarizes activities for the Santa Monica Beach Restoration Pilot Project from December2015 through October 2021. The restoration was implemented in two phases over the course of twoweeks in December 2016 including the installation of fencing and seeding of native coastal strandvegetation species. For details on the implementation efforts and prior monitoring, please referenceprior reports (Johnston et al. 2017, 2018, 2019, 2020). Post-restoration physical and biologicalmonitoring has occurred since 2016 and is completed based on permit requirements and included in thisYear 5 Report. As the project was meant to be an experimental pilot for the region, no specific,quantifiable success criteria were set; however, the project can be evaluated against its ability to meetthe project goals. The project positively engaged the public, created new partnerships and outreachconnections, restricted grooming in an approximately 3-acre area, allowed vegetation to grow,encouraged sand hummocks to form along fence lines and within the project area, providedcomprehensive science-based monitoring data to inform nature-based beach restoration solutions, andis bringing back a rare coastal habitat type to the Los Angeles region.Additionally, the increased functions within the restoration habitat area included benefits to severalnotable species. Nesting of the federally threatened western snowy plover had not been recorded in theLos Angeles region for almost 70 years, and the first nest for the Los Angeles region was found in April2017 within the restoration area and contained three eggs. Plovers have been repeatedly identifiedwithin and adjacent to the project area throughout all five years, where previously they had not beendocumented on site. Furthermore, a new native plant species, possibly a rare variant of woolly heads(Nemacaulis denudata), was identified as germinating in the project area in 2017 and was identified inall future years. As the seeds of this species are not sold by the seed provider, it is probable that therewas either an existing seed bank for this species already along Santa Monica Beach, or that it wastransported by wind, waves, birds, or humans. It was not identified in areas adjacent to the project site.Another native plant, pink sand verbena (Abronia umbellata) was also identified on site and was notincluded intentionally by the seed provider. Another biological addition to the restoration project areafound in surveys from 2017 through 2021 (but not baseline surveys prior to restoration) were dunebeetles, which provided an increased layer of the food web available to foraging birds and wildlife.Data suggest that the restoration area is considerably different from both the control sites and fromitself over time as compared to the baseline surveys, especially for increased vegetation cover andchanges in sand morphology. Absolute vegetation cover continues to increase slowly over time, to amaximum in Year 5 of approximately 7% native cover, with patches of dense vegetation interspersedwith bare sand, similar to natural coastal strand habitats. Vegetation reaches a maximum ofapproximately 25% cover adjacent to the fence lines. It is likely that the vegetation community willcontinue to establish over time, but will probably remain patchy, as is the trend for coastal strandhabitats. Elevation data continued to show differences between restoration site transects and controls,with greater topographic complexity and elevation heights in the restoration site. Whereas the groomedcontrol areas were flattened and uniform, the restoration area had small dune hummocks, increases inberm height, and consistent sand retention across seasons and years. Adaptive management in the formof supplemental seeding and fencing is being considered for implementation in future years and will be1
Year 5 Annual Report, December 2021evaluated as part of a revised adaptive management plan for the application for a Coastal DevelopmentPermit amendment to establish the project site as a permanent feature.The variability of the berm over time and the notable increases in elevation along the fencedperimeters, oceanward berm, and throughout the restoration area surrounding patches of vegetationsuggest that longer periods of time for scientific evaluation for these parameters would also allow foradditional trends to be defined. If funding is available, future monitoring and research efforts wouldcontinue to inform sand topography within the restoration site in response to vegetation growth, fenceplacement, and seasonal changes. For more information, details, artistic renderings, and links to publicdocuments, reports, and photographs, please visit the project website.Figure ES- 1. Post-restoration site photographs taken in Year 5 on 30 March and 21 May 2021.2
Year 5 Annual Report, December 2021IntroductionBackgroundOver 17 million visitors frequent the beaches of Santa Monica every year. Beaches are broadlyrecognized and highly valued as cultural and economic resources for coastal regions (Dugan et al. 2015).However, their value as ecosystems is often less appreciated. Southern California beach systems andassociated wildlife are highly impacted by threats, including native species extirpation and extinction,erosion, non-natural sediment and sand transport through mechanical means, pollution, and loss ofnatural morphology due to daily vegetation and top soil removal through grooming and other regularmaintenance (Dugan et al. 2003). However, these systems also offer essentially the last line of defensein terms of nature-based protection as components of a living shoreline. As a vital part of our coastline,beaches and dunes support and protect our homes, roads, and infrastructure, providing a natural bufferfrom sea level rise (SLR) as well as from tidal and wave action from the ocean. Beach habitats and dunesare critical in managing sand transport to create resilient beach morphologies, which naturally bufferclimate change impacts. By restoring natural processes to impacted
Santa Monica Beach Restoration Pilot Project Year 5 Annual Report December 2021 Prepared for: City of Santa Monica California Coastal Commission US Environmental Protection Agency California Department of Parks and Recreation The Bay Foundation 8117 W. Manchester Ave. #750 Playa Del Rey, CA 90293 (888) 301-2527 www.santamonicabay.org