Transcription
NorthernerVirginianiniChamber2021 Index Survey Report 1
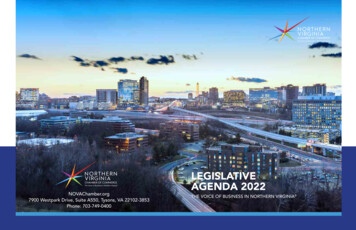
Our recent survey of nearly 100 regional business leaders found Employers in Northern Virginia are strongly optimistic about their near-term economicand business prospects.How respondents felt about business and economic prospects over the next 1–3 years:3% Pessimistic25% Mixed72% OptimisticNorthern Virginia weathered the pandemic better than many other regions economically, butbusinesses are now facing meaningful challenges finding and hiring talent due to labor shortages.50%42%Reported that, since the start of the year,hiring has been more difficult than usual.Indicated that an overall shortage of candidates has beena primary barrier to hiring over the past 12 months.The pandemic has had a noticeable impact on employer hiring and retention practices—whileremote work is top of mind, plans for whether it will continue are mixed.Top Anticipated Trends in HiringEmphasis on diversity,equity, and inclusion66%57%Use of remote hiringConsideration ofremote candidatesTop Perks and Benefits46%Remote work options62%Flexible scheduling59%Generous healthcare benefits59%
Regional businesses generally maintain a conventional approach to education, training, andprofessional development—yet, now is the perfect opportunity for employers to expand talentpipelines through alternate means, such as apprenticeships.Minimum level of education typically required for entry-level jobs based on survey responses44%0%15%20%High School Diploma or Less40%Some College, Certification, or 2-Year Degree34%60%3% 4%80%Bachelor’s DegreeGraduate Degree66%16%Hired at least one intern over the past 12 monthsReported offering apprenticeships100%Don’t KnowBuilding critical intelligence into the Northern Virginia labor marketIf 2020 was a year marked by economic tumult and uncertainty in the wake of the COVID-19 pandemic, 2021 has been onemarked by slow recovery and continued uncertainty. With unemployment rates falling, but job openings and quits at recordhighs, gaining a better understanding of the workforce landscape is more important than ever.The new Northern Virginia Workforce Index, developed in partnership between the Northern Virginia Chamber of Commerceand Northern Virginia Community College, provides critical information on hiring, retention, and professional developmenttrends among employers in the region. This annual survey and report will also track these trends into the future, providinga long-term view of how business’ workforce prospects and practices are shifting and evolving over time.For more information about this project, or to be involved in the future of the Northern Virginia Workforce Index,contact Jennifer Williamson, Vice President of Workforce & Member Engagement at the Northern Virginia Chamberof Commerce: jwilliamson@novachamber.org.For additional data and insights on labor market trends in Northern Virginia, visit www.nvcc.edu/lmi, or contactTucker Plumlee, Manager of Labor Market Research at Northern Virginia Community College: tplumlee@nvcc.edu.NorthernerVirginianiniChamber
INTRODUCTIONOver a year and a half into the COVID-19 pandemic, and even amidst a prolonged economic recovery, UnitedStates labor markets continue to be characterized by uncertainty. The nightly news regularly provides reportsof employers unable to find the talent needed to fill jobs while, at the same time, workers are increasinglyre-considering their professional and career opportunities, holding out for higher wages, and opting for workenvironments that are more flexible and accommodating. To meet this uncertainty and plan effectively for thefuture, detailed and actionable intelligence on local labor market conditions, especially employer workforceneeds, is more necessary than ever.Recognizing this need, in 2021 the Northern Virginia Chamber of Commerce’s Strategic Planning Task Forceproposed the development of an annual employer survey and report that would provide detailed data onemployer sentiment and workforce practices specific to the Northern Virginia region.i Developed in partnershipwith Northern Virginia Community College (NOVA) through its Business Engagement Center and Office ofInstitutional Research’s Labor Market Research team, the aim of this pilot survey is to outline the scope of topicsto be addressed, identify any opportunities for technical and logistical improvement in future surveys, and tocapture an initial snapshot of business responses during a critical inflection point in the national and regionaleconomy. By consistently tracking these same topics over time, this initiative will serve as an important resourcefor economic and workforce development decision-making in the region.Among the key findings of our initial survey of business leaders in Northern Virginia: Employers in Northern Virginia are strongly optimistic about their near-term economic andbusiness prospects. Although Northern Virginia weathered the pandemic better than many other regions economically, businessesare now facing challenges finding and hiring talent due to labor shortages. The pandemic has had a noticeable impact on employer hiring and retention practices—while remote work istop of mind, plans for whether it will continue are mixed. Regional businesses generally maintain a conventional approach to education, training, and professionaldevelopment. However, the current labor market offers the perfect opportunity for employers to expand theirtalent pipelines through alternate means of hiring and development, such as apprenticeships“In 2021 the Northern Virginia Chamber of Commerce’s Strategic PlanningTask Force proposed the development of an annual employer survey and reportthat would provide detailed data on employer sentiment and workforce practicesspecific to the Northern Virginia region.i Defined as the nine Commonwealth of Virginia jurisdictions immediately surrounding Washington D.C.: Alexandria City, Arlington County,Fairfax City, Fairfax County, Falls Church City, Loudoun County, Manassas City, Manassas Park, and Prince William County1 2021 Index Survey Report
SURVEY OVERVIEWBetween June 30 and August 25, 2021, 91 regional business leaders—primarily at the C-Suite/executiveleadership level (74% of respondents) but also including directors of human resources (12%) and othermanagers with knowledge regarding their business’s hiring and talent development (14%)—responded to aseries of 25 questions.ii These questions covered a range of topics including: the business’s economic outlook;recent and anticipated employment changes; trends and practices in hiring and retention; as well as typicalrequirements and offerings in terms of education, training, and professional development. Due to the significanteconomic impacts of COVID-19 over the past year, a handful of questions specifically addressed these impactson respondent businesses, as well as any anticipated changes stemming from them.Survey respondents represented a diverse set of businesses from across the Northern Virginia region, coveringnearly the entire spectrum of industry sector and size (Table 1). As a pilot reliant on convenience sampling(as opposed to a random sample), however, it is important to highlight a few important ways in which theserespondents may over- or under-represent certain components of the regional economy based on the mostrecent data available from the United States Census Bureau’s Statistics of U.S. Businesses (SUSB).1Businesses involved in professional, business, financial, or other servicesiii tend to make up a larger percentageof survey responses than total firms in the region, while those in leisure, hospitality, food service, retail, andconstruction tend to make up a smaller comparative share of respondents compared to firms. At the same time,mid-size businesses (those employing 20 – 500 employees) tend to be over-represented, while small businesses(less than 20 employees) tend to be underrepresented. Finally, a slightly larger share of respondents identifiedFairfax County as their main location than the overall share of firms located in the region, while respondents inPrince William County and Manassas/Manassas Park were slightly underrepresented compared to total firms.Keeping these weights in mind, we will note cases throughout this report where respondent demographics mayplay a role in the results. Even then, we believe that these responses, on balance, represent a strong crosssection of businesses in the region.Table 1. Survey Respondent Business Demographics (by percentage of respondents)Jurisdiction*Industry Super-SectorFairfax County48%Loudoun County14%Arlington CountyPrince William CountyAlexandria City11%5%5%Fairfax City4%Falls Church3%Manassas Park1%Washington, D.C.4%Maryland2%Not Specified1%Business Size (# of employees)Professional &Business Services43%Financial Activities14%Other Services13%Education & Health Services12%Leisure & Hospitality6%Trade, Transportation,& g2% 2024%20 - 9935%100 - 49927%500 13%* Although some respondents either did notindicate a specific jurisdiction (responding“Washington DMV”) or identified WashingtonD.C./Maryland as their main location, alloperate in Northern Virginia.ii NOTE: Responses may not sum to 100% due to rounding. For additional detail regarding the survey’s administration and analysisplease see the Appendix.iii “Professional” services can include computer/information technology, engineering, accounting, management consulting, and otherscientific/technical firms; financial services involves both finance and investing firms, as well as banks, credit unions, etc.; and“other” services includes a broad range of firms, from those offering personal care to nonprofits and industry associations.2021 Index Survey Report 2
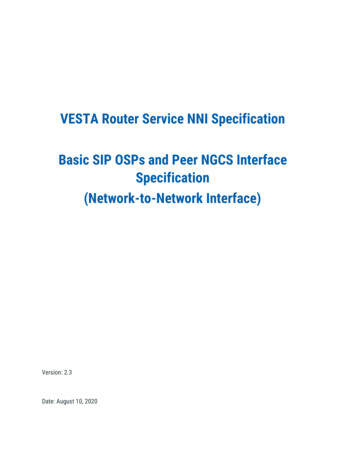
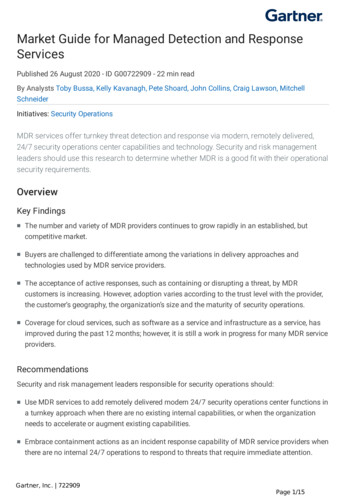
OVERALL BUSINESS/ECONOMIC OUTLOOKDespite the overwhelming challenges of the past year and a half, survey respondents were strongly optimisticregarding the overall economy’s near-term prospects. Three-quarters (75%) reported being either “somewhat” or“very” optimistic about the potential for economic growth, improvements in employment/productivity, and furtherinnovation over the next 1-3 years, while only 10% expressed some level of pessimism; 15% were neutral (Figure1). This optimism was even more pronounced when respondents were asked to consider their own business’soutlook—80% reported being “somewhat” or “very” optimistic about their business’s prospects over the next 1-3years, while only 4% reported being “somewhat” pessimistic; none were “very” pessimistic.Figure 1. Near-term Business and Economic Outlooks among Survey RespondentsWhat is your level of optimism regarding the economy’s prospects over the next 1–3 years?PessimisticOptimistic7%15%51%24%What is your level of optimism regarding your business’s prospects over the next 1–3 years?PessimisticOptimistic4%Very pessimisticSomewhat pessimistic16%45%Neither pessimistic nor optimistic35%Somewhat optimisticVery optimisticIn combination, over a third of respondents (35%) were “somewhat” optimistic about both the economy andtheir business, while 1/5 (21%) were “very” optimistic about both. Just 27% of respondents reported mixed orpessimistic views overall (Figure 2). Even among those respondents that reported decreases in employmentsince the start of 2020, the majority (67%) were still optimistic regarding their business’s prospects goingforward (Figure 3).Figure 2. Combined Business/Economic Outlooks among Survey RespondentsEconomic OutlookVerypessimisticSomewhatpessimisticNeither pessimisticnor optimisticSomewhatoptimisticVeryoptimisticSomewhat pessimistic1%2%1%Neither pessimistic nor optimistic1%1%11%2%Somewhat optimistic1%2%3%35%3%13%21%Business OutlookVery pessimisticVery optimistic3 2021 Index Survey Report1%
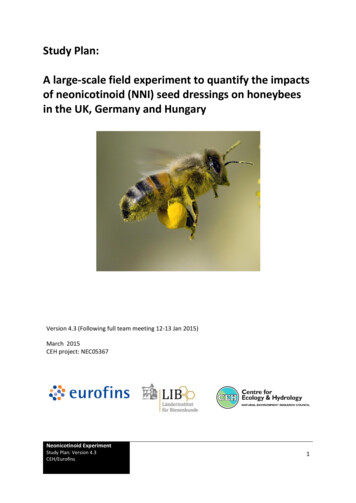
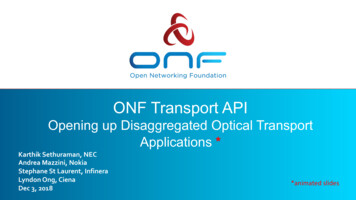
Figure 3. Respondents’ Business Outlook Given Reported Changes in EmploymentSince the start of 2020, paid employment has:67%Decreased21%13%79%No Change18%93%Increased0%20%7%40%60%Level of optimism regarding business’s outlook, next 1-3 years:80%OptimisticNeutral100%PessimisticHowever, it is also worth noting that the Washington D.C. metropolitan area (D.C. MSA) and the Northern Virginiaregion have fared better economically than the rest of the country as well as other highly populated metro areas(MSAs) since the beginning of the COVID-19 pandemic, which could contribute to higher levels of optimismamong regional employers. This is due, in part, to the relative strength/resiliency of the regional labor market.While both Northern Virginia and the D.C. MSA have historically had lower unemployment rates than the restof the country, rates in our region did not increase as drastically at the start of the pandemic as in other areas(Figure 4) and have consistently remained lower than in other large MSAs. Similarly, a smaller share of jobs waslost in Northern Virginia at the pandemic’s outset than elsewhere, and Northern Virginia’s rate of jobs recoveryexceeded the national rate through at least July (Figure 5).Figure 4. Unemployment Rate – Percentage Point Difference from 2019 Average12%Northern Virginia10%Washington D.C. MSAUnited StatesTop 10 MSAs8%6%4%2%0%-2%Jan 2020Mar 2020May 2020Jul 2020Sep 2020Nov 2020Jan 2021Mar 2021May 2021Jul 2021NOTE: The top 10 MSAs in the United States, ranked by population as of the 2020 census, included here are those that center on the followingmajor cities: New York City, Los Angeles, Chicago, Dallas-Fort Worth, Houston, Washington D.C., Philadelphia, Miami, Atlanta, and Boston.Sources: U.S. Bureau of Labor Statistics, Local Area Unemployment Statistics (LAUS) and Current Population Survey (CPS), Not Seasonally Adjusted.2021 Index Survey Report 4
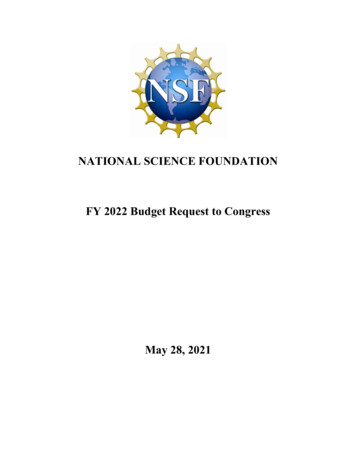
Figure 5. Employment – Percentage Change from 2019 Average3%Northern Virginia0%Washington D.C. MSAUnited StatesTop 10 MSAs-3%-6%-9%-12%-15%Jan 2020Mar 2020May 2020Jul 2020Sep 2020Nov 2020Jan 2021Mar 2021May 2021Jul 2021Source: U.S. Bureau of Labor Statistics, Current Employment Statistics (CES), Seasonally Adjusted.EMPLOYMENT CHANGESThis relative stability in the regional labor market was reflected in survey responses, with many respondents(43%) reporting no significant change in employment since the start of 2020. Slightly more respondents reportedincreases in employment (31%) than declines (26%), although slightly more reported significant declines thansignificant increases (Figure 6). When disaggregated by business sector and size, it appears that smallerbusinesses (those with fewer than 20 employees) were more likely to report employment declines than increases,and the majority of respondents in the leisure and hospitality sector reported significant declines.Figure 6. Past and Future Employment Changes Among Survey RespondentsSince the start of 2020, how have levels of paid employment changed at your business?Decrease11%Increase15%43%22%9%How does your business anticipate its levels of paid employment will change over the next 12 months?DecreaseIncrease32%Significant decrease ( 15%)Decrease ( 15%)No significant change47%Increase ( 15%)15%Significant increase ( 15%)This highlights the extent to which Northern Virginia’s resiliency during the pandemic has been a product ofits industry landscape and economic reliance on large firms in the professional/technical services and publicsectors. These businesses were able to transition more easily to remote work and better weather the businessimpacts of the pandemic. It is also worth keeping in mind that businesses in these sectors were more heavilyrepresented among survey respondents, even when considering their comparatively higher concentration acrossthe regional economy, which may affect the distribution of results seen here.5 2021 Index Survey Report
Most respondents (63%) anticipated employment growth over the next 12 months, while another 32%anticipated no significant change (Figure 6). Only 6% of respondents anticipated declines in employment, withmost of these being very small businesses (those with less than 10 employees total). Combined, over a quarterof participants reported both past and projected employment increases (27%) while another 41% reported eithermixed increases in employment (past or future) or no significant changes (Figure 7).Figure 7. Combined Past/Future Employment Changes Among Survey RespondentsPast ChangeFuture/Anticipated ChangeSignificantdecrease ( 15%)Decrease ( 15%)Significant decrease ( 15%)No significantchangeIncrease ( 15%)Significantincrease ( 15%)2%Decrease ( 15%)2%1%No significant change4%4%20%2%1%Increase ( 15%)6%7%15%17%3%Significant increase ( 15%)1%2%4%3%4%COVID-19 IMPACTSWhen specifically asked about changes to their business’s level of activity compared to before the COVID-19pandemic, more than half of respondents indicated that they had either not experienced a decline in activity(31%) or that business had returned to its pre-pandemic “normal” (27%). Of those that indicated businesshad not yet returned to normal as of the time of the survey (July/August 2021), most (27% of all respondents)expected it would take longer than 6 months to do so (Figure 8).Figure 8. Impact of COVID-19 on Business ActivityHas your business’s activity (orders, sales, revenue, contracts, etc.) returned to pre-pandemic levels?If not, how long do you anticipate it will take before activity returns to normal?31%No decline in business activity due to the pandemic27%Business activity has returned to normalExpect that business will return to normal in one month or less3%Expect that business will return to normal in 2-3 months11%Expect that business will return to normal in 6 months or moreDo not expect business to return to normal27%0%2021 Index Survey Report 6
This distribution of responses largely reflects those provided to a similar question asked in the Census Bureau’sSmall Business Pulse Survey (SBPS)iv where, over the most recent survey period (from 8/16 – 9/5/2021),businesses across the Washington D.C. MSA were similarly split primarily between those for whom business hadalready returned to normal or never declined (37% on average), and those facing longer recoveries (40%).2 Whileattempts to draw direct comparisons between the values of these two surveys’ results should be avoided, around9% of SBPS respondents did not expect business to return to normal; none of the respondents to this surveyindicated the same. One possible reason for this discrepancy could be this survey’s inclusion of businesses largerthan 500 employees (not included in the SBPS), and its higher concentration of businesses larger than 100.Indeed, evidence has shown that smaller businesses were impacted more severely by the pandemic than others.3This is further reinforced by the finding that most of those respondents expecting future declines in employmentwere small businesses. So, while the overall economic and employment picture in Northern Virginia is largelypositive, it is important to acknowledge that there are a portion of businesses, particularly small businesses, thatare expecting a much longer recovery than others.It is also important to recognize the changing dynamics of the period during which this survey was administered(July to August 2021). Analysis by the Stephen S. Fuller Institute highlights that the region’s economicrecovery showed signs of slowing in June and July 2021 and expects that this trend continued into Augustand September.4 Due in part to rising infections and hospitalizations from the Delta variant of COVID-19, thisslowdown likely had an impact on businesses’ expectations regarding the length of recovery in the near-term (atleast among those respondents for whom business had not yet returned to normal).The impacts of a more prolonged or uneven recovery have been particularly evident in the recent hiring difficultiesfaced by employers. Record levels of job openings and quits—10.9 million and 3.98 million in July, respectively5—indicate significant supply challenges in the labor market nationwide, with many businesses reporting difficultylocating much-needed talent.6 These challenges were similarly reflected in our survey, where 50% of respondentsreported that, since the start of 2021, it has been more difficult than usual to attract and hire job candidates(Figure 9). While 31% indicated that hiring was about the same as usual, only a few (6%) indicated that it waseasier than usual; 14% either have not hired recently or weren’t sure of their answer.Figure 9. COVID-19 Effects on Recent HiringSince the start of the year, to what extent has it been more difficult than usualfor your business to attract potential candidates and/or hire for necessary positions?23%Much more difficult than usual27%Slightly more difficult than usual31%About the same as usual6%Slightly easier than usualMuch easier than usual0%8%Not applicableDon’t know/Not sure6%iv The SBPS is a weekly nationwide survey of 90,000 single-location employer businesses with 1-499 employees and receipts of morethan 1,000.7 2021 Index Survey Report
HIRING & RETENTIONLabor supply shortages were further identified by respondents as a primary source of recent hiring challenges.Just under half (42%) reported that an overall shortage of interested or available candidates was a barrier tohiring over the last 12 months (Figure 10). This was cited by respondents more frequently than a shortage ofcandidates with the necessary education, experience, or skills to fill open positions, which has often beenidentified by employers as their top hiring concern.7 By comparison, roughly the same percentage of respondents(36%) either reported no barriers to hiring or did not do any appreciable hiring over the last 12 months (i.e.,responded “not applicable” to the question).Figure 10. Barriers to HiringIn the last 12 months, which of the following barriers have prevented you from hiring or expanding employment as necessary?42%Overall shortage of candidatesShortage of candidates with neccessary education/experience36%19%None16%Not Applicable15%COVID-related restrictions12%Shortage of candidates with security clearance10%Shortage of candidates with necessary certifications8%Shortage of candidates with basic credentials (e.g. driver's license)7%Other3%Non-COVID-related government policies or regulationsDon’t know/not sure1%While we might have assumed that COVID-19-related restrictions would be reported as a more prevalent barrierto hiring, the time frame respondents were asked to consider (roughly summer 2020 to summer 2021) fell aftermany of the initial social distancing and capacity restrictions began to ease in Virginia. This barrier might havealso been more prevalent if respondents had included a higher concentration of those businesses that facedthe most direct restrictions such as in hospitality, retail, and food services. Given the higher concentration ofprofessional and business services respondents, however, it is surprising that a shortage of candidates withsecurity clearances was not seen as a barrier among more respondents (just 12%), as this has historicallybeen a significant pain point for technology and government contracting employers in Northern Virginia and thesurrounding region.8 This further highlights the extent to which challenges getting candidates in the door mayhave overshadowed other barriers that have been reported by employers more prominently in the past.When looking for candidates to hire, respondents reported relying on the conventional options of online jobboards and word of mouth nearly across the board, with 84% using each (Figure 11). Other common sourcesincluded hiring/advancement internally (62%), posting to company-specific job boards (57%), and usingrecruiters (55%). Among those sources used less frequently by employers were internships, direct college2021 Index Survey Report 8
recruitment, and apprenticeships. If labor shortages continue to make it challenging to locate and hire talentthrough more conventional channels, however, businesses may want to look to these programs as anothermeans of getting workers in the door.Figure 11. Hiring SourcesWhich of the following sources does your business utilize to hire or recruit talent, regardless of frequency?Online job boards84%Word of mouth/employee referral84%62%Internal hiring/advancement57%Company/business job board55%Recruiters43%Internships33%Direct college recruitment32%Staffing agencies13%ApprenticeshipsOther7%While these options generally require employers to invest additional resources into training or developing talent,internship and apprenticeship programs—if well-constructed, with equity and inclusion as a focus—provideaccess to more diverse pools of talent, opening opportunities to workers with unique perspectives and skill setswho may not traditionally be considered due to a lack of formal credentials or direct industry experience.9 Bycontrast, recruiting and hiring primarily through online job boards or by word of mouth is more likely to producelimited candidate pools that largely resemble a business’s existing workforce.These considerations are particularly important as over half of respondents (66%) anticipated that an increasedemphasis on diversity, equity, and inclusion will continue to re-shape hiring practices over the next one to threeyears, more than any other identified hiring trend (Figure 12). Second to this was the anticipation of increaseduse of remote hiring methods (57%) and increased consideration of candidates from other cities or states(46%). Of course, these are likely top of mind due to the turn to remote work during the COVID-19 pandemic.Technological changes such as the need to hire candidates for increasingly digitized jobs, or the increasing use ofautomated hiring software, were less prominent.9 2021 Index Survey Report
Figure 12. Changes and Trends in Hiring PracticesIn which of the following ways do you anticipate hiring or recruitment practices will change for your business in the next 1–3 years?66%Increased emphasis on diversity, equity, and inclusion57%Increased use of remote hiring methods46%Increased consideration of candidates from other cities/states (remote workers)41%Increased use of internal recruiting and advancement31%Increased use of part-time, contract, or temporary workers29%Increase in digitization of jobs and required technology skills27%Increased use of automated hiring software12%Don't know/not sureOther1%The turn towards remote work has also impacted the ways that regional employers are approaching the retentionof talent, with 62% of respondents indicating that telework and remote work options have been among thosebenefits or perks that have been most successful (Figure 13). The three other benefits and perks that wereselected most frequently, and by a similar proportion of respondents, can also be seen as COVID-19-related:flexible scheduling for salaried workers (important for those dealing with shifting childcare needs, for example);generous healthcare benefits; and generous vacation and sick time benefits. Despite being a relatively easyoption, however, in-office perks were only selected by a handful of respondents, likely also a consequence of theCOVID-19 shift to increased remote work.It remains to be seen, of course, whether these strong short-term impacts of COVID-19 on how regional employersare thinking about and approaching hiring and retention strategies will continue to stand up in future instances ofthe survey, and whether they will become ingrained as long-term shifts in the regional employment landscape.2021 Index Survey Report 10
Figure 13. Benefits and Perks Aimed at RetentionOf those offered by your business, which of the following benefits or perks have been the most successful in retaining talented employees?Telework/remote work options62%Flexible scheduling for salaried workers59%Generous healthcare benefits59%57%Generous vacation and sick time benefits35%Tuition reimbursement or individual learning accounts26%Predictable scheduling for hourly workers24%Paid parental/family leaveFormal mentoring22%15%In-office perks (free snacks, recreational options, etc.)Employee ownership options (including stock)11%Other5%Don't know/not sure5%Paid sabbatical or professional development leave5%Not applicable3%REMOTE WORKBased on our survey, the extent to which respondents will continue offering remote work opportunities issomewhat mixed. While only 9% reported that none of their workforce will continue working remotely over halfof the time once operations have returned to normal, the highest percentage (27%) reported that a quarter orless of their workforce will remain primarily remote on a permanent basis. Just over a third of respondents (36%)reported that over half of their workforce would continue working remotely most of the time (Figure 14).Perhaps unsurprisingly, most of the respondents in this latter category were those in professional, business,and other services, while any goods-producing businesses (i.e., construction or manufacturing) or direct servicebusinesses (hospitality, healthcare, etc.) largely planned on less than half of their workforce remaining remote.Notably, this question also received the second highest rate of “don’t know/not sure” answers (10%), just behindasking respondents to predict future trends and changes in hiring practices, a question that contains moreinherent uncertainty.Even while the future of remote work remains uncertain, it is clear that offering more remote work opportunities inthe current environment is seen as advantageous by businesses, particularly given high demand among workers.Of those survey responses that indicated that none of their workforce would remain remote for over 50% of theirwork time, a handful still indicated that they would offer remote work as a perk aimed at retaining employees.11 2021 Index Survey Report
Figure 14. Continuation of Remote WorkWhat percentage of your busine
their business, while 1/5 (21%) were "very" optimistic about both. Just 27% of respondents reported mixed or pessimistic views overall (Figure 2). Even among those respondents that reported decreases in employment since the start of 2020, the majority (67%) were still optimistic regarding their business's prospects going forward (Figure 3).