Transcription
GLOBAL ECONOMICCONDITIONSUpdated June 2022Globalization InstituteFederal Reserve Bank of Dallas
Table of ContentsSpecial Section: COVID-19Average Daily Percent Change in the Google Mobility Index inMajor Advanced EconomiesOxford Stringency Index in Major Advanced EconomiesCOVID-19 Deaths Per Million in Major Advanced EconomiesCOVID-19 Tests Per Case in Major Advanced Economies1. Indicators of Real ActivityChart 1. Global GDP GrowthChart 2. OECD Industrial ProductionChart 3. Global Purchasing Managers IndexChart 4. Unemployment in Major Advanced EconomiesChart 5. Unemployment in OECD EconomiesChart 6. Volume of World Merchandise TradeChart 7. Volume of World Merchandise TradeChart 8. Baltic Dry Index4. Public FinancesChart 18. General Government Net Lending/Borrowing in MajorAdvanced EconomiesChart 19. General Government Net Lending/Borrowing in MajorEmerging EconomiesChart 20. General Government Gross Debt in Major AdvancedEconomiesChart 21. General Government Gross Debt in Major EmergingEconomies5. Monetary PolicyChart 22. Central Bank Policy Rates in Major AdvancedEconomiesChart 23. Central Bank Policy Rates in Major EmergingEconomiesChart 24. Money Supply Growth in Major Advanced EconomiesChart 25. Money Supply Growth in Major Emerging Economies2. Inflation Indicators6. U.S. External AccountsChart 9. Commodity PricesChart 26. U.S. Terms of TradeChart 10. Inflation in OECD Economies (CPI)Chart 27. U.S. Nominal Trade Balance, Customs ValueChart 11. Global Inflation (Headline CPI)Chart 28. U.S. Current Account BalanceChart 12. Inflation in Major Advanced Economies (Headline CPI)Chart 29. Nominal Value of the U.S. DollarChart 13. Inflation in Major Emerging Economies (Headline CPI)Chart 30. Real Value of the U.S. Dollar3. Money and Capital Markets7. Current AnalysisChart 14. Money Market SpreadsChart 31. Global Current Account BalancesChart 15. 10-Year Government Bond Yields in Major AdvancedChart 32. Bond Spreads for Select Euro Area EconomiesEconomiesChart 16. Stock Market Indexes in Major Advanced EconomiesChart 17. Stock Market Indexes in Major Emerging Economies
Special Section:COVID-19Globalization InstituteFederal Reserve Bank of Dallas
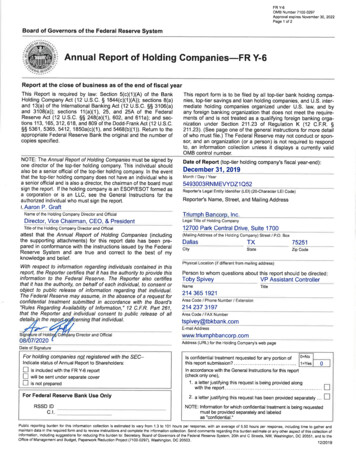
Percent7-Day Moving Average of the Google Mobility Index inMajor Advanced Economies100-10-20-30-40-50-60U.S.Euro AreaJapan-70U.K.-80CanadaNOTES: Categories from the Google Mobility Index included in the 7-day simple average are retail & recreation, grocery &pharmacy, transit stations, and workplaces. Data last updated June 21, 2022.SOURCE: Google Mobility Index, tion InstituteFederal Reserve Bank of Dallas
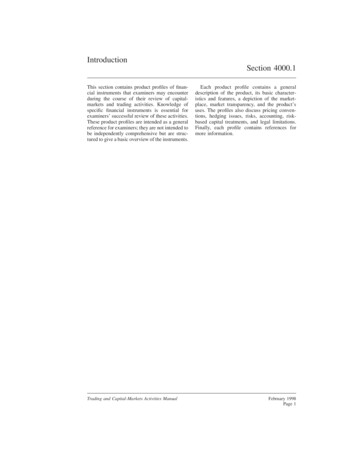
Oxford Stringency Index in Major Advanced EconomiesU.S.Euro AreaJapanU.K.Canada1009080706050403020100SOURCE: Hale, Thomas, Sam Webster, Anna Petherick, Toby Phillips, and Beatriz Kira (2020). OxfordCOVID-19 Government Response Tracker, Blavatnik School of Government. Data use policy: CreativeCommons Attribution CC BY standard.Globalization InstituteFederal Reserve Bank of Dallas
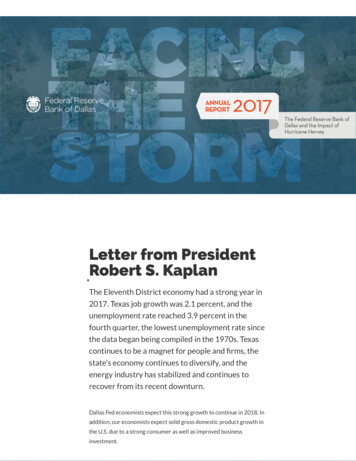
COVID-19 Cumulative Deaths Per Million in MajorAdvanced a150010005000SOURCES: Haver, John Hopkins.Globalization InstituteFederal Reserve Bank of Dallas
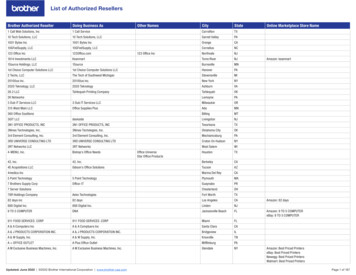
COVID-19 Tests Per Case in Major AdvancedEconomies600500U.S.Euro Area400JapanU.K.300Canada2001000NOTES: Data last updated June 21, 2022. COVID-19 tests per case is equal to the 7-day moving average of the number oftests divided by the number of cases per day.SOURCE: Our World in Data (OWID).Globalization InstituteFederal Reserve Bank of Dallas
Indicators of RealActivityGlobalization InstituteFederal Reserve Bank of Dallas
Chart 1. Global GDP GrowthPercent, Year/Year15129630-3World (2022 Q1 4.19)-6Advanced Economies (ex. U.S.) (2022 Q1 4.4)-9Emerging Economies (2022 Q1 4.3)-12-15U.S (2022 Q1 3.5)200520072009201120132015201720192021NOTE: The advanced economies (ex. U.S.) aggregate includes the Euro Area, Japan, the U.K., Canada, Australia, SouthKorea, Switzerland and Sweden. The emerging economies aggregate includes China, Brazil, Russia, India, Mexico,Indonesia, Turkey, Argentina, South Africa and Colombia. The world aggregate includes these countries, which make upapproximately 80 percent of world GDP computed using purchasing power parity (PPP)-adjusted GDP weights.SOURCES: National Statistical Offices, International Monetary Fund; Haver AnalyticsGlobalization InstituteFederal Reserve Bank of Dallas
Chart 2. OECD Industrial ProductionIndex, 2005 100120LastLastObservation:Observation: MarMar 2015201720192021NOTE: Countries included in the industrial production index are all members of the Organization for Economic Cooperation andDevelopment, or OECD (Australia, Austria, Belgium, Canada, Chile, Czech Republic, Denmark, Estonia, Finland, France, Germany,Greece, Hungary, Iceland, Ireland, Israel, Italy, Japan, South Korea, Luxembourg, Mexico, Netherlands, New Zealand, Norway,Poland, Portugal, Slovak Republic, Slovenia, Spain, Sweden, Switzerland, Turkey, United Kingdom and United States).SOURCES: OECD; Haver AnalyticsGlobalization InstituteFederal Reserve Bank of Dallas
Chart 3. Global Purchasing Managers IndexIndex656055504540Manufacturing (May 52.4)35Services (May 52.2)3025Composite (May 51.5)202018201920202021NOTE: This index measures purchasing managers' perspectives of current business conditions. An index value greaterthan 50 indicates economic expansion from the previous month, while a value below 50 indicates contraction.SOURCES: JPMorgan; BloombergGlobalization InstituteFederal Reserve Bank of Dallas
Chart 4. Unemployment in Major Advanced EconomiesPercent161412U.S. (May 3.6)Euro Area (Apr 6.8)Japan (Apr 2.5)U.K. (Apr 3.8)Canada (May 5.1)10864202005 2006 2007 2008 2009 2010 2011 2012 2013 2014 2015 2016 2017 2018 2019 2020 2021 2022NOTE: The chart plots harmonized unemployment data for the U.K.SOURCES: National Statistical Offices, EUROSTAT; Haver AnalyticsGlobalization InstituteFederal Reserve Bank of Dallas
Chart 5. Unemployment in OECD EconomiesPercent9Last Observation:Observation: AprMar 5.05.4Last876543210200020022004SOURCES: OECD; Haver lization InstituteFederal Reserve Bank of Dallas
Chart 6. Volume of World Merchandise TradeIndex, 2000 bservation:Apr NOTE: This series includes data from 23 industrialized and 60 emerging market economies and covers approximately 97percent of total world trade. Trade volume is calculated as the arithmetic average of world export volumes and world importvolumes.SOURCES: Netherlands Bureau for Economic Policy Analysis; Haver AnalyticsGlobalization InstituteFederal Reserve Bank of Dallas
Chart 7. Volume of World Merchandise TradeExportsImportsIndex, 2000 10036032028024020016012080World (Apr 198.4)World (Apr 199.9)Advanced Economies (Apr 171.2)Emerging Economies (Apr 327.6)400'05'07'09'11'13'15'17'19'21Advanced Economies (Apr 172.5)Emerging Economies (Apr 272.7)'05'07'09'11'13'15'17'19'21NOTE: Import and export series include data from 23 industrialized and 60 emerging market economies and coverapproximately 97 percent of total world trade.SOURCES: Netherlands Bureau for Economic Policy Analysis; Haver AnalyticsGlobalization InstituteFederal Reserve Bank of Dallas
Chart 8. Baltic Dry IndexIndex, 1/4/1985 1,00014,000Last Observation: June 23 01120132015201720192021NOTE: The Baltic Dry Index is a maritime shipping index that measures charter rates for shipping dry bulk commoditiessuch as coal, grain and iron ore.SOURCES: Baltic Exchange; BloombergGlobalization InstituteFederal Reserve Bank of Dallas
Inflation IndicatorsGlobalization InstituteFederal Reserve Bank of Dallas
Chart 9. Commodity PricesIndex, Jan. 2007 100350300Precious Metals (Jun 23 269.0)Agriculture and Livestock (Jun 23 172.9)Energy (Jun 23 177.8)Industrial Metals (Jun 23 103.4)2502001501005002005 2006 2007 2008 2009 2010 2011 2012 2013 2014 2015 2016 2017 2019 2020 2021 2022SOURCES: Goldman Sachs; Haver AnalyticsGlobalization InstituteFederal Reserve Bank of Dallas
Chart 10. Inflation in OECD Economies (CPI)Percent, Year/Year8Headline Inflation (May 6.7)Core Inflation (May 21NOTE: The headline consumer price index (CPI) is the broadest measure of price changes consumers face in their day-today living expenses. The core CPI excludes energy and food prices.SOURCES: OECD; Haver AnalyticsGlobalization InstituteFederal Reserve Bank of Dallas
Chart 11. Global Inflation (Headline CPI)Percent, Year/YearWorld (May 6.7)Advanced Economies (May 6.6)Emerging Economies (May 92021NOTES: Calculations are based on a representative sample of 40 countries. Aggregated using U.S. trade weights.SOURCES: Database of Global Economic Indicators; Haver Analytics.Globalization InstituteFederal Reserve Bank of Dallas
Chart 12. Inflation in Major Advanced Economies(Headline CPI)Percent, Year/Year1086420U.S. (May 8.5)Euro Area (May 8.1)Japan (May 2.4)U.K. (May 9.1)Canada (May 7.6)-2-4-620052007200920112013SOURCES: National Statistical Offices, European Central Bank; Haver Analytics2015201720192021Globalization InstituteFederal Reserve Bank of Dallas
Chart 13. Inflation in Major Emerging Economies(Headline CPI)Percent, Year/YearBrazil (May 11.9)Russia (May 17.1)India (Apr 6.3)Indonesia (May 3.5)China (May 2.1)South Africa (May 6.6)20151050-52005200720092011SOURCES: National Statistical Offices; Haver Analytics20132015201720192021Globalization InstituteFederal Reserve Bank of Dallas
Money and CapitalMarketsGlobalization InstituteFederal Reserve Bank of Dallas
Chart 14. Money Market SpreadsBasis Points400350300U.S. Dollar (Jun 23 11.7)Euro (Jun 23 6.6)Japanese Yen (Jun 23 1)U.K. Pound Sterling (Jun 23 12.9)2502001501005002005 2006 2007 2008 2009 2010 2011 2012 2013 2014 2015 2016 2017 2018 2019 2020 2021 2022-50NOTE: The chart plots the spread, or difference, between 3-month interbank offered rates (Libor for the dollar, yen and poundsterling; Euribor for the euro) and the overnight index swap rate for each currency.SOURCES: Bloomberg, Haver AnalyticsGlobalization InstituteFederal Reserve Bank of Dallas
Chart 15. 10-Year Government Bond Yieldsin Major Advanced EconomiesPercent654U.S. (Jun 24 3.1)Euro Area (Jun 24 1.4)Japan (Jun 23 0.2)U.K. (Jun 22 2.5)Canada (Jun 23 3.3)3210-1-22005 2006 2007 2008 2009 2010 2011 2012 2013 2014 2015 2016 2017 2018 2019 2020 2021SOURCES: Financial Times, Reuters, Bank of Canada; Haver AnalyticsGlobalization InstituteFederal Reserve Bank of Dallas
Chart 16. Stock Market Indexes in Major AdvancedEconomiesIndex, Jan. 2007 100350300250200U.S. (Jun 24 254)Euro Area (Jun 24 86)Japan (Jun 24 154)U.K. (Jun 24 116)Canada (Jun 24 153)1501005002005 2006 2007 2008 2009 2010 2011 2012 2013 2014 2015 2016 2017 2018 2019 2020 2021 2022NOTE: Stock market indexes are the Dow Jones Industrial Average Index for the U.S, the EURO STOXX 50 Price Index forthe Euro Area, the Nikkei 225 Average Index for Japan, the FTSE 100 Index for the U.K. and the S&P/TSX Composite Indexfor Canada.SOURCES: Financial Times, Wall Street Journal; Haver AnalyticsGlobalization InstituteFederal Reserve Bank of Dallas
Chart 17. Stock Market Indexes in Major EmergingEconomiesIndex, Jan. 2007 100500450400350Brazil (Jun 23 233)Russia (Jun 24 79)India (Jun 24 389)Indonesia (Jun 24 395)China (Jun 24 117)South Africa (Jun 24 269)3002502001501005002005 2006 2007 2008 2009 2010 2011 2012 2013 2014 2015 2016 2017 2018 2019 2020 2021 2022NOTE: Stock market indexes are the Bovespa Index for Brazil, the RTS Index for Russia, the Bombay SENSEX for India, theJakarta Composite for Indonesia, the New Shanghai Stock Exchange Composite Index for China and the JohannesburgStock Exchange Top 40 Index for South Africa.SOURCES: Financial Times, Wall Street Journal; Haver AnalyticsGlobalization InstituteFederal Reserve Bank of Dallas
Public FinancesGlobalization InstituteFederal Reserve Bank of Dallas
Chart 18. General Government Net Lending/BorrowingPercent of GDP420-2-4-6-8U.S. (2021 -4.8)Euro Area (2021 -4.3)-10Japan (2021 -7.8)-12U.K. (2021 -4.3)-14Canada (2021 -2.2)-162005200720092011SOURCES: International Monetary Fund; Haver Analytics20132015201720192021Globalization InstituteFederal Reserve Bank of Dallas
Chart 19a. General Government Net Lending/BorrowingBrazil (2021 -7.6)Russia (2021 -4.0)Percent of GDPPercent of 02008India (2021 -9.9)2011201420172020Indonesia (2021 -4.0)Percent of GDP0Percent of RCES: International Monetary Fund; Haver Analytics200520082011201420172020Globalization InstituteFederal Reserve Bank of Dallas
Chart 19b. General Government Net Lending/BorrowingChina (2021 -7.7)South Africa (2021 -5.8)Percent of GDP4Percent of GDP400-4-4-8-8-12-1220052008201120142017SOURCES: International Monetary Fund; Haver Analytics2020200520082011201420172020Globalization InstituteFederal Reserve Bank of Dallas
Chart 20. General Government Gross DebtPercent of GDP300Percent of GDP160140250120200100801506010040US (2022 125.6)Euro Area (2022 95.2)2050UK (2022 87.8)Japan (2022 262.5)Canada (2022 101.8)002005200720092011SOURCES: International Monetary Fund; Haver Analytics20132015201720192021Globalization InstituteFederal Reserve Bank of Dallas
Chart 21a. General Government Gross DebtPercent of GDP105Brazil (2022 91.9)Percent of GDP60Russia (2022 16.8)50954085307520651055020052000 2003 2006 2009 2012 2015 2018 20212008India (2022 86.9)Percent of GDP958520112014201720202023Indonesia (2022 42.7)Percent of GDP60407520650552005 2008 2011 2014 2017 2020 2023SOURCES: International Monetary Fund; Haver Analytics2005200820112014201720202023Globalization InstituteFederal Reserve Bank of Dallas
Chart 21b. General Government Gross DebtChina (2022 77.8)Percent of GDP90807060504030202005 2008 2011 2014 2017 2020 2023SOURCES: International Monetary Fund; Haver AnalyticsSouth Africa (2022 70.2)Percent of zation InstituteFederal Reserve Bank of Dallas
Monetary PolicyGlobalization InstituteFederal Reserve Bank of Dallas
Chart 22. Central Bank Policy Rates in Major AdvancedEconomiesPercent7U.S. (Jun 24 1.625)6Euro Area (Jun 24 0.00)Japan (Jun 24 -0.10)5U.K. (Jun 24 1.25)Canada (Jun 24 1.50)43210-12005 2006 2007 2008 2009 2010 2011 2012 2013 2014 2015 2016 2017 2018 2019 2020 2021 2022NOTES: The chart plots the federal funds rate for the U.S., the main refinancing operation rate for the Euro Area, the baserate for the U.K., the overnight target rate for Canada and the uncollateralized overnight call rate for Japan applied until April3, 2013, before the main operating policy target changed to expanding the monetary base. On February 16, 2016, the Bank ofJapan (BoJ) adopted negative interest rates applied to excess reserves that financial institutions hold at the BoJ. The Bankalso introduced an interest rate target of around 0 percent for its 10-year government bond yields in September 2016.SOURCES: National Central Banks; Haver AnalyticsGlobalization InstituteFederal Reserve Bank of Dallas
Chart 23a. Central Bank Policy Rates in Major rnight SELIC Target Rate (Jun 24 10864202021 2005Repo Rate (Jun 24 4.90)64Reverse Repo Rate (Jun 24 52021IndiaPercent102Bank of Russia Key Rate (Jun 24 9.50)7-Day Reverse Repo Rate (Jun 24 3.50)Bank of Indonesia Rate (Aug 2016 6.50)2009201320172021NOTE: The Reserve Bank of India utilizes the repo rate to inject liquidity into the monetary system and the reverse repo rateto remove liquidity. On August 19, 2016, the Bank of Indonesia changed its policy rate from the BI rate to the 7-day reverserepo rate.SOURCES: National Central Banks; Haver AnalyticsGlobalization InstituteFederal Reserve Bank of Dallas
Chart 23b. Central Bank Policy Rates in Major EmergingEconomiesChinaPercent10Central Bank Policy Rate (Jun 17 3.70)86421-Year Deposit Rate (Jun 24 1.50)02005 2007 2009 2011 2013 2015 2017 2019 2021SOURCES: National Central Banks; Haver AnalyticsSouth AfricaPercent1412108642Average Repo Rate (Jun 24 4.75)02005 2007 2009 2011 2013 2015 2017 2019 2021Globalization InstituteFederal Reserve Bank of Dallas
Chart 24. Money Supply Growth in Major AdvancedEconomiesPercent, Year/Year302520U.S. (Apr 8.0)Euro Area (Apr 6.6)Japan (May 3.2)U.K. (Apr 4.9)Canada (Apr 5.9)151050-5-102005 2006 2007 2008 2009 2010 2011 2012 2013 2014 2015 2016 2017 2018 2019 2020 2021 2022NOTE: The chart plots M2 in the Euro Area, U.S., Japan and Canada and M4 in the U.K.SOURCES: National Central Banks; Haver AnalyticsGlobalization InstituteFederal Reserve Bank of Dallas
Chart 25. Money Supply Growth in Major EmergingEconomiesPercent, Year/Year70605040Brazil (Feb 8.9)Russia (Apr 15.7)India (May 11.7)Indonesia (Apr 13.6)China (May 11.1)South Africa (Apr 6.2)3020100-10-20-302005 2006 2007 2008 2009 2010 2011 2012 2013 2014 2015 2016 2017 2018 2019 2020 2021 2022NOTE: The chart plots M2 for each country.SOURCES: National Central Banks; Haver AnalyticsGlobalization InstituteFederal Reserve Bank of Dallas
U.S. External AccountsGlobalization InstituteFederal Reserve Bank of Dallas
Chart 26. U.S. Terms of TradeIndex, Jan. 1990 100125Terms of Trade (May 92.4)Terms of Trade (Excluding Oil) (May 15201720192021NOTE: U.S. terms of trade are calculated as the import price index/export price index.SOURCES: U.S. Bureau of Labor Statistics; Haver AnalyticsGlobalization InstituteFederal Reserve Bank of Dallas
Chart 27. U.S. Nominal Trade Balance, Customs ValueBil. U.S. Dollars0Last Observation: Apr 2015201720192021NOTE: The chart plots the nominal trade balance in goods.SOURCES: Census Bureau; Haver AnalyticsGlobalization InstituteFederal Reserve Bank of Dallas
Chart 28. U.S. Current Account BalancePercent of GDP0Last Observation: 2022 Q1 2021NOTE: All values are nominal.SOURCES: U.S. Bureau of Economic Analysis; Haver AnalyticsGlobalization InstituteFederal Reserve Bank of Dallas
Chart 29. Nominal Value of the U.S. DollarIndex, Jan. 2000 100150140130120110100908070Nominal Exchange Value of the U.S. Dollar (May 113.9)60U.S. Dollar vs. Major Currencies (May 100.0)U.S. Dollar vs. Other Important Trading Partners (May 136.2)50200520072009201120132015201720192021NOTE: Countries or regions whose currencies are included in the major currencies index are the Euro Area, Canada, Japan,United Kingdom, Switzerland, Australia and Sweden. Countries included in the other important trading partners index areMexico, China, Taiwan, Korea, Singapore, Hong Kong, Malaysia, Brazil, Thailand, Philippines, Indonesia, India, Israel, SaudiArabia, Russia, Argentina, Venezuela, Chile and Colombia. An increase in each index represents an appreciation of the U.S.dollar and a decrease represents a depreciation.SOURCES: Federal Reserve Board; Haver AnalyticsGlobalization InstituteFederal Reserve Bank of Dallas
Chart 30. Real Value of the U.S. DollarIndex, Jan. 2000 1001201101009080Real Exchange Value of the U.S. Dollar (May 110.4)70U.S.Dollar vs. Major Currencies (May 117.4)U.S.Dollar vs. Other Important Trading Partners (May 105.9)60200520072009201120132015201720192021NOTE: Countries or regions whose currencies are included in the major currencies index are the Euro Area, Canada, Japan,United Kingdom, Switzerland, Australia and Sweden. Countries included in the other important trading partners index areMexico, China, Taiwan, Korea, Singapore, Hong Kong, Malaysia, Brazil, Thailand, Philippines, Indonesia, India, Israel, SaudiArabia, Russia, Argentina, Venezuela, Chile and Colombia. An increase in each index represents an appreciation of the U.S.dollar and a decrease represents a depreciation.SOURCES: Federal Reserve Board; Haver AnalyticsGlobalization InstituteFederal Reserve Bank of Dallas
Current AnalysisGlobalization InstituteFederal Reserve Bank of Dallas
Chart 31. Global Current Account BalancesUSBil. U.S. DollarsChina1500JapanOthersOil 201120132015201720192021NOTE: Oil exporting countries are Algeria, Indonesia, Iran, Iraq, Kuwait, Libya, Nigeria, Oman, Qatar, Saudi Arabia, UnitedArab Emirates and Venezuela. The remaining countries not already listed for which there is data comprise "Others". Stripedcolumns denote forecasts.SOURCES: International Monetary Fund; Haver AnalyticsGlobalization InstituteFederal Reserve Bank of Dallas
Chart 32. Bond Spreads for Select Euro Area EconomiesBasis Points400035003000Greece (Jun 24 238)Ireland (Jun 24 66)Portugal (Jun 24 109)Spain (Jun 24 113)Italy (Jun 24 207)250020001500100050002005 2006 2007 2008 2009 2010 2011 2012 2013 2014 2015 2016 2017 2018 2019 2020 2021 2022NOTE: The chart shows the spread, or difference, in interest rates between 10-year government bonds for various countriesand German 10-year government bonds.SOURCES: Reuters; Haver AnalyticsGlobalization InstituteFederal Reserve Bank of Dallas
Chart 23. Central Bank Policy Rates in Major Emerging Economies Chart 24. Money Supply Growth in Major Advanced Economies Chart 25. Money Supply Growth in Major Emerging Economies 6. U.S. External Accounts Chart 26. U.S. Terms of Trade Chart 27. U.S. Nominal Trade Balance, Customs Value Chart 28. U.S. Current Account Balance