Transcription
IJRET: International Journal of Research in Engineering and Technology eISSN:2319-1163 pISSN: 2321-7308A COMPARATIVE FLOW ANALYSIS OF NACA 6409 AND NACA 4412AEROFOILMD. Safayet Hossain1, Muhammad Ferdous Raiyan2, Mohammed Nasir Uddin Akanda3, NahedHassan Jony41Department of Mechanical Engineering, CUET, Chittagong, BangladeshDepartment of Mechanical Engineering, CUET, Chittagong, Bangladesh3Department of Electrical Engineering, CUET, Chittagong, Bangladesh4Department of Mechanical Engineering, CUET, Chittagong, Bangladesh2AbstractIn this work, flow analysis of two aerofoils (NACA 6409 and NACA 4412) was investigated. Drag force, lift force as well as theoverall pressure distribution over the aerofoils were also analysed. By changing the angle of attack, variation in differentproperties has been observed. The outcome of this investigation was shown and computed by using ANSYS workbench 14.5. Thepressure distributions as well as coefficient of lift to coefficient of drag ratio of these two aerofoils were visualized and compared.From this result, we compared the better aerofoil between these two aerofoils. The whole analysis is solely based on the principleof finite element method and computational fluid dynamics (CFD). Finally, by comparing different properties i.e drag and liftcoefficients, pressure distribution over the aerofoils, it was found that NACA 4412 aerofoil is more efficient for practicalapplications than NACA 6409 aerofoil.Keywords: NACA, Drag Lift, CFD, ANSYS FLUENT, -----------------------------------------------1. INTRODUCTIONAerodynamics is a branch of science that deals with theanalysis of flow over a body. The rapid evolution of CFDhas been driven for faster and accurate method for solvingproblems related to aerodynamics. The flow of air over theaerofoils is the most important thing that has to beconsidered during designing an aircraft, missile, sportvehicles or any other aerodynamic objects. Analysing theflow of a compressible fluid is always complex and consistsof different terms and characteristics. By using ANSYS,flow analysis becomes more effective as it investigateseverything more thoroughly than experimental method.Computational fluid dynamics provides a qualitative andsometimes even quantitative prediction of fluid flow bymeans of mathematical modelling, numerical method andsoftware tools. CFD analysis enables an engineer tocompute the flow numerically in a ‘virtual flow laboratory’.The analysis consists of several steps such as: problemstatement, mathematical modelling, mesh generation, spacediscretization, time discretization, iterative solver,simulation run, post processing, and verification.ANSYS is vast computational software that enablesresearchers to analyse the problems related to differentengineering sectors. It is used to solve problems related toheat transfer, fluid flow, turbulence, industrial machineries,explicit dynamics, and structural analysis with the assistanceof numerical analysis.Chervonenko [1] showed the effect of attack angle on thenon-stationary aerodynamic characteristics and flutterresistance of a grid of bent vibrating compressor blades.Bacha et al. [2] presented drag prediction in transitionalflow over two-dimensional aerofoils. Eleni et al. [3]evaluated the turbulence models for the simulation of theflow over NACA 0012 aerofoil. Ramdenee et al. [4]investigated on modelling of aerodynamic flutter on aNACA (National Advisory Committee for Aeronautics)4412 aerofoil with application to wind turbine blades.Johansen [5] also evaluated laminar/turbulent transition inaerofoil flows. Launder et al. [6] showed the numericalcomputation of turbulent flows. 2D analysis of NACA 4412aerofoil was done by Kevadiya et al.[7]. Mentar [8]presented two-equation eddy-viscosity turbulence modelsfor engineering applications. Mashud et al. [9] showed theeffect of spoiler position on aerodynamics characteristic ofan aerofoil. Gulzar et al. [10] represented the impact ofvariation in angle of attack in NACA 7420 aerofoil intransonic compressible flow using Spalart-Allmarasturbulence model. . Aerodynamic stall suppression onaerofoil sections using passive air-jet vortex generators wereinvestigated by Prince et al. [11] Shih et al. [12] showed anew k- ε eddy-viscosity model for high Reynolds numberturbulent flows. Bensiger et al. [13] analysed a bi convexaerofoil by using CFD at supersonic and hypersonic speed.Sutherland W [14] evaluated the viscosity of gases andmolecular force.Aerofoils and aerodynamic shaped objects are extensivelyused in all types of air vehicles for example space shuttle,aircrafts, helicopters and even in various types of missiles.Volume: 03 Issue: 10 Oct-2014, Available @ http://www.ijret.org342
IJRET: International Journal of Research in Engineering and Technology eISSN:Besides, when it comes to fluid machineries such as pump,turbine, windmill, the shape of impeller, propeller is veryimportant. All the parameters which are important to expressthe characteristics of aerofoils must be inspected with highprecision. That’s why analysis of flow over aerofoils is veryimportant.In this investigation, pressure distribution was analysedalong with coefficient of lift and coefficient of drag of twoparticular NACA aerofoils. Later, coefficient of lift tocoefficient of drag ratio was compared between theseaerofoils to find out the more practical one.2319-1163 pISSN: 2321-7308vortices which are responsible for creating drag by creatingnegative pressure in that region. Wake doesn’t occur only inbluff bodies. Wake can occur in an aerodynamic body with arelatively large angle of attack (larger than 15 degree formost aerofoils). This is known as stalling point. Negativepressure and drag force become dominant from stallingpoint.Separation of boundary layer depends on Reynolds number.For higher values of Reynolds number, it exhibits an earlytransition from laminar to turbulent flow. The higher theReynolds number, there will be greater tendency that theflow is turbulent.2. THEORETICAL ANALYSISThe force which is exerted on a body by a flowing fluid inthe direction of flow is called drag. The component of thisforce normal to the body is called lift force. If pressure andshear forces acting on a differential area ofon a surfaceisandrespectively, the differential drag and liftforces acting on dA are(1)(2)Reynolds numberis defined by,(7)Here x is the thickness of boundary layer where thetransition from laminar to turbulent starts.For analysing the pressure distribution over the aerofoil withpressure p and boundary layer thickness x, Navier-Stokesequation is used which can be defined as,Now the drag force is,(8)(3)And lift force is,(4)For steady flow, the pressure p is the function of x only, thepartial derivative may, therefore, be replaced by the totalderivativeform,and Eq. (8) can be expressed in the followingDrag force and lift force can also be written by using coefficient of drag and co-efficient of lift respectively.(5)(9)By integrating,(10)(6)Besides, the lift phenomenon can also be explained by usingBernoulli’s equation. According to Bernoulli’s equation, foran incompressible steady state flow, pressure increases if theflow velocity decreases and vice versa. When the air passesover the aerofoil, velocity increases as the air continues toflow from its leading edge to the upper surface of theaerofoil. The pressure is decreased in that area. But on theother hand, velocity decreases as the air passes through thebottom of the aerofoil and the pressure is increased. Thispositive pressure acting upward acts as the key ingredientfor generating lift.When a fluid separates from a body, it forms a separatedregion between the body and the fluid stream. This lowpressure region behind the body where recirculation andbackflows occur is called the separated region. The largerthe separated region, the larger the drag force. Wake can bedefined as a region of flow trailing the body where theeffects of the body on velocity are felt. Wake consists ofFinally, the simplified Navier-Stokes equation maybewritten as,(11)Combining Eq. (9) and Eq. (11), the steady flow equationcan be written as,(12)And the continuity equation for the two-dimensional steadyflow is(13)Eq.(12) and Eq.(13) are known as the Prandtl’s boundarylayer equation.Volume: 03 Issue: 10 Oct-2014, Available @ http://www.ijret.org343
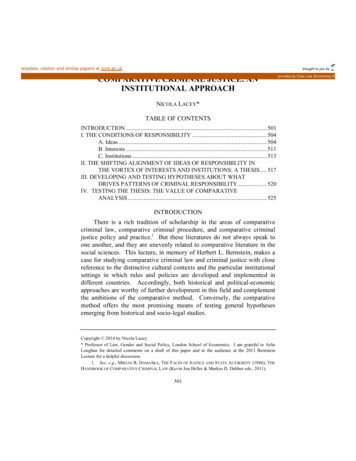
IJRET: International Journal of Research in Engineering and Technology eISSN:Although the above equation is meant for rectilinear flow,they are applicable to curved flow too.2319-1163 pISSN: 2321-7308Here, the surrounding area of aerofoil was divided into tinyelements in order to facilitate the numerical analysis basedon finite element method.3. ANALYTICAL METHODIn this process, the chosen aerofoils were generated by usingan online aerofoil generator [15] from which the coordinates were imported to create the geometry of thoseaerofoils. After obtaining the co-ordinates, they wereimported to SolidWorks 2013 for creating the desiredgeometry. The 2D view of these aerofoils was shown in Fig.1 and 2 respectively. The CFD analysis of these aerofoilswas done by ANSYS.Fig- 4: Enlarged view of generated mesh.Fig- 1: 2D view of NACA 6409 aerofoil.Fig- 2: 2D view of NACA 4412 aerofoil.Analysis began after the visualization of the output from thesimulation process. As the simulation process was verylengthy, the number of nodes was set at 25755 and elementsat 25500. Accuracy depends on the number of elements andnodes. The result would be more specific and accurate if thenumber of nodes and elements could be increased in themesh. But it was set around 25000 for reducing the tardinessand complexities of simulation. With the increase in numberof nodes and elements, the finite element analysis can beperformed more accurately. The input values at thebeginning of simulation were set according to the values ofTable 1 given below.Table- 1: Initial values for NACA 6409 aerofoil3.1 NACA 6409 Aerofoil AnalysisThe mesh was generated at the beginning according to Fig. 3and 4 respectively. This meshing process and principle arebased on the theory of finite element analysis method.Number of elements in mesh25500Number of nodes in the mesh25755Number of iterations forgenerating mesh500ModelViscous laminarLaminar flow velocity1 m s-1Air density1.225 kg m-3Viscosity1.7894e-05 kg s m-2Fig- 3: Complete mesh generation of NACA 6409 aerofoil.Volume: 03 Issue: 10 Oct-2014, Available @ http://www.ijret.org344
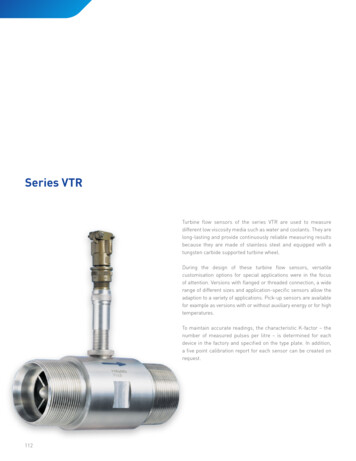
IJRET: International Journal of Research in Engineering and Technology eISSN:2319-1163 pISSN: 2321-7308Fig-: 5 Coefficient of drag for 0 degree angle of attack forNACA 6409.Fig- 7: Coefficient of drag for 5 degree angle of attack forNACA 6409.Fig- 6: Coefficient of lift for 0 degree angle of attack forNACA 6409.Fig- 8: Coefficient of lift for 5 degree angle of attack forNACA 6409.Like the previous one, coefficient of lift and drag wereplotted in Fig. 7 and 8 as the number of iteration was goingon until it reached to a steady value. After 158th iterations,convergence was obtained and the values of CL and CD as3.7830e-04 and 5.6594e-04 were found respectively. As theiteration process continued, the value of CL became morestable and accurate and stable.Coefficients of lift and drag were plotted in Fig. 5 and 6 asthe number of iterations were going on until it reached to asteady value. After 188th iterations, convergence wasobtained and the values of CL and CD as 2.1854e-04 and5.6133e-04 were found respectively. Convergence historyshowed that these obtained graphs became more accurate asthe number of iterations increased. At the initial stage, thecoefficient values were changing with the increase ofiteration. After certain iterations (500), the values becamesteady and were not changing with the number of iterations.Volume: 03 Issue: 10 Oct-2014, Available @ http://www.ijret.org345
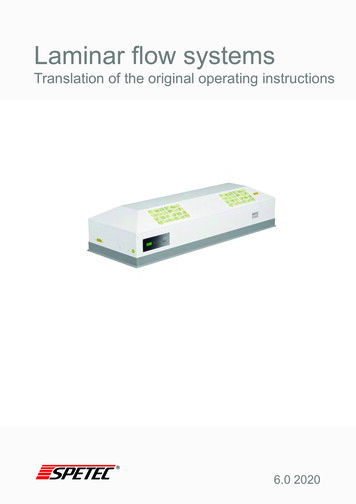
IJRET: International Journal of Research in Engineering and Technology eISSN:2319-1163 pISSN: 2321-7308Fig- 11: Vector profile at the trailing edge of NACA 6409air foil for an angle of attack of 0 degree.Fig- 9: Total pressure distribution over NACA 6409 aerofoilfor an angle of attack 0 degree.Fig-10: Total pressure distribution over NACA 6409aerofoil for an angle of attack 5 degree.Fig- 12: Vector profile at the trailing edge of NACA 6409aerofoil for an angle of attack of 5 degree.From simulation, coefficient of drag and coefficient of liftwere found for different angle of attack. Finally the ratio ofCL to CD was calculated. In Fig. 9 and 10, the pressuredistribution over the aerofoil is shown. It is also seen fromboth Fig. 9 and 10 that negative pressure was created on theupper end surface of the aerofoil and simultaneouslypositive pressure at the lower surface thus generating lift. Asthe flow passed over the aerofoil, separation started to occurat the trailing edge thus creating wake with negativepressure at that region. With the increase in angle of attack,the lift also began to increase. But it should be noted that liftcontinues to increase with angle of attack up to a certainpoint. After that point, with the increase of angle of attack,lift continues to decrease and drag increases.Now, in Fig. 11 and 12, we can see the vector profile overthe aerofoil body. The streamlines started to detach from theupper surface as the air passed over the lower end of theaerofoil. This is the region where small vortices are createdand thus it creates a small amount of negative pressure.These vortices and negative pressure consequently inducedwakes near the separation point of the streamlines over theaerofoil.All the aerofoils used in aerodynamics applications mustproduce larger amount lift with least amount of drag toexhibit better performance. It is necessary to compareamong different aerofoils to find out the most effective one.Therefore, a measure of performance for aerofoils is the liftto-drag ratio which is equivalent to the ratio of the lift andVolume: 03 Issue: 10 Oct-2014, Available @ http://www.ijret.org346
IJRET: International Journal of Research in Engineering and Technology eISSN:2319-1163 pISSN: 2321-7308drag coefficients. In other words, lift to drag coefficient isthe mean of performance for aerofoils. This information canalso be obtained by plotting CL and CD versus differentangle of attack. As the lift-to-drag ratio increases with theincrease of angle of attack, it was found from simulation thatthe ratio was also increased for an increase in angle ofattack. Lift to drag ratio is a performance parameter foraerofoils. This is typically one of the major goals in aircraftdesigns. Coefficient of lift and coefficient of drag for NACA6409 aerofoil are listed in the following table.Table- 2: Coefficient of drag and lift for different angle ofattacksAngle of Coefficient of drag Coefficient of lift(CD)(CL)attack (05.6133e-042.1854e-04-0455.6594e3.7830e-04Table- 3: Coefficient of lift to drag ratio for different angleof attack.Angle of attackCL/CD00.3950.663.2 NACA 4412 Aerofoil AnalysisThe following section discussed about the analysis for theNACA 4412 aerofoil. It should be noted that samecalculation and theoretical knowledge is applicable forNACA 4412 like the previously discussed NACA 6409aerofoil. The mesh generation was shown in Fig. 12 and 13respectively.Fig- 14: Enlarged view of generated meshAfter completing the simulation, the output was visualized.In this case, the number of nodes was set at 26462 andelements 26200. Accuracy depended on the number ofelements and nodes. The result would be more specific andaccurate if the number of nodes and elements could beincreased in the mesh. But it was set around 26000 forreducing the tardiness and complexities of simulation. Withthe increase of number in nodes and elements, the finiteelement analysis is performed more accurately. The inputvalues at the beginning of simulation were set according tothe values of Table 4 given below.Table- 4: Initial values set for NACA 4412 aerofoilNumber of elements in mesh26200Number of nodes in the mesh26462Number of iterationsgenerating meshModel500forViscous laminarLaminar flow velocity1 m s-1Air density1.225 kg m-3Viscosity1.7894e-05 kg s m-2Fig-13: Complete mesh generation of NACA 4412 aerofoil.Fig- 15: Coefficient of drag for 0 degree angle of attack forNACA 4412Volume: 03 Issue: 10 Oct-2014, Available @ http://www.ijret.org347
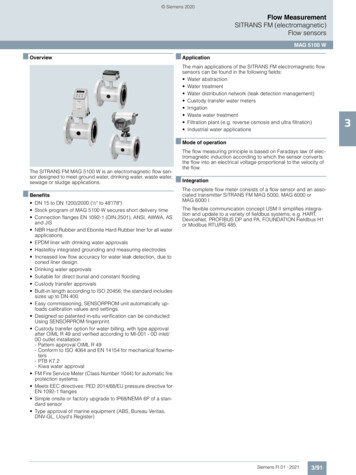
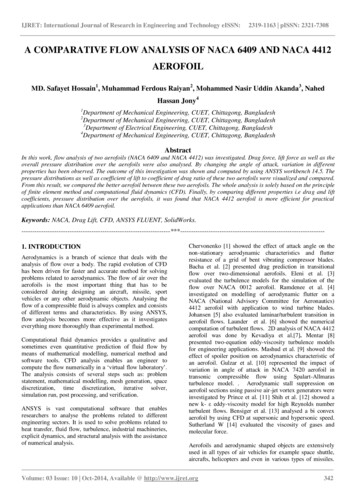
IJRET: International Journal of Research in Engineering and Technology eISSN:2319-1163 pISSN: 2321-7308From Fig. 17 and 18, after 105th iterations, convergence isobtained and the values of CL and CD were 5.7556e-04 and1.0694e-04 respectively for 5 degree angle of attack. As theiteration process continued, the value of CL became morestable and accurate.Fig- 16: Coefficient of lift for 0 degree angle of attack forNACA 4412After 130th iterations, convergence was obtained and thevalues of CL and CD were found as 3.47274e-04 and 1.0318e04respectively for 0 degree angle of attack. It is seen fromFig. 15 and16 and also from convergence history that theobtained graph is more accurate as the number of iterationsincreases.Fig- 17: Coefficient of drag for 5 degree angle of attack forNACA 4412Fig- 19: Total pressure distribution over NACA 4412aerofoil for an angle of attack 0 degree.Fig- 20: Total pressure distribution over NACA 4412aerofoil for an angle of attack 5 degree.From simulation, coefficient of drag and coefficient of liftfor different angle of attack were found. Finally the ratio ofCL to CD was calculated. From the flow visualization, thepressure distribution over the aerofoil was obtained. It canbe seen from both Fig. 19 and 20 that negative pressure wascreated on the upper end surface of the aerofoil andsimultaneously positive pressure at the lower surface thusgenerating lift. As the flow passed over the aerofoil,separation started to occur at the trailing edge thus creatingwake with negative pressure at that region. As the angle ofattack increased, the lift also begins to increase.Fig- 18: Coefficient of lift for 5 degree angle of attack forNACA 4412Volume: 03 Issue: 10 Oct-2014, Available @ http://www.ijret.org348
IJRET: International Journal of Research in Engineering and Technology eISSN:2319-1163 pISSN: 2321-7308Table-5: Coefficient of lift and drag for different angle ofattackAngle of Coefficient of drag Coefficient of lift(CD)(CL)attack �� 6: Coefficient of lift to drag ratio for different angleof attackAngle of attackCL/CD03.36555.3824. RESULTS AND DISCUSSIONFig- 21: Vector profile at the trailing edge for NACA 4412aerofoil for an angle of attack of 0 degree.The sole purpose of this simulation based experiment was tocompare the different parameters of NACA 6409 andNACA 4412 aerofoil and thus finding out which one is themost efficient between these two. It is obvious that therewere significant differences among various properties ofthese two aerofoils. From the simulation, overall pressuredistribution on these two aerofoils was found. It is clear thatthere was less negative pressure developed on the uppersurface of NACA 4412 aerofoil than the upper surface ofNACA 6409 aerofoil. Streamlines that is vector profileswere more attached within the vicinity of NACA 4412 thanin NACA 6409 thus creating less wake in the first one.Finally, the lift to drag ratios for NACA 4412 aerofoil withan angle of attack 0 degree and 5 degree were respectively3.365 and 5.382. On the other hand, the lift to drag ratios forNACA 6409 aerofoil with an angle of attack 0 degree and 5degree were respectively 0.39 and 0.66.Fig- 22: Vector profile at the trailing edge for NACA 4412aerofoil for an angle of attack of 5 degreeNow from Fig. 21 and 22, the vector profile over theaerofoil body can be seen. The streamlines started to detachfrom the upper surface as the air passed over the lower endof the aerofoil. This is the region where small vortices arecreated and thus creating a small amount of negativepressure. This vortices and negative pressure consequentlyinduced wakes near the separation point of the streamlineover the aerofoil.An important consequence of this periodic generation ofvortices downstream is referred as vortex shedding. It isdesirable for aerofoils to generate the most amount of liftwhile producing the least amount of drag. Therefore, ameasure of performance for aerofoils is the lift-to-drag ratiowhich is equivalent to the ratio of the lift and dragcoefficients. This information was obtained by plotting CLor CD versus different angle of attack. As the lift-to-dragratio increases with the increase of angle of attack, it wasalso found from simulation that the ratio was increased foran increase in angle of attack. The value of lift-to-drag ratiocan be of the order of 100 for a two dimensional aerofoil.The better aerofoil always has a higher lift to drag ratiowhen it is compared with other aerofoils. In this case,NACA 4412 exhibited higher lift to drag ration than NACA6409. So it is obvious that NACA 4412 is best suited foraerodynamic applications than NACA 6409 with higher liftto drag ratio and less wake generation.5. CONCLUSIONSAfter successfully completing this simulation basedexperiment, the decisions were finally confined into thefollowing points. Static pressure distribution on these two aerofoilswas visualized. It was found that for same angle ofattack, NACA 4412 has less negative pressure onthe upper surface than NACA 6409. Vector profile and wake generation were also foundfrom the simulation. Wake generation is less inNACA 4412 than NACA 6409 for same angle ofattack. Coefficient of drag and coefficient of lift were foundfor different angle of attack from the simulation. Finally, lift to drag ratio for these two aerofoils werecompared to find out the better aerofoil. In this case,NACA 4412 is better than NACA 6409.Volume: 03 Issue: 10 Oct-2014, Available @ http://www.ijret.org349
IJRET: International Journal of Research in Engineering and Technology ][12]A.G Chervonenko, 1991, Effect of attack Angle onthe Nonstationary Aerodynamic Characteristics andFlutter Resistance of a Grid of Bent VibratingCompressor Blades, Ukrainian Academy ofSciences, Plenum Publishing Corporation, Ukraine,Volume 39, No. 10, pp. 78-81.Bacha WA, Ghaly WS, 2006, Drag Prediction inTransitional Flow over Two-Dimensional Airfoils,Aerospace Sciences Meeting, USA, AIAA 20062048.Douvi C. Eleni, Tsavalos I. Athanasios and MargarisP. Dionissios, 2012, Evaluation of the TurbulenceModels for the Simulation of the Flow over anAerofoil,Journal of Mechanical EngineeringResearch, Greece, Volume 4, No.3, pp. 100-111.Drishtysingh Ramdenee, H. Ibrahim, N.Barka,A.Ilinca, 2013, MODELING OF AERODYNAMICFLUTTER ON A NACA 4412 AIRFOIL WINDBLADE, International Journal of Simulation andProcess Modelling, Inderscience Publishers, Canada,Volume 8, No. 1 , pp. 79-87.Johansen J, 1997, Prediction of Laminar/TurbulentTransition in Airfoil Flows, Journal of Aircraft,Aerospace Research Central, Denmark, Volume 36,No. 4, pp. 731-734.Launder BE, Spalding DB, 1974, The NumericalComputation of Turbulent Flows, ComputerMethods in Applied Mechanics and Engineering,ScienceDirect, UK, Volume 3, No. 2, pp. 269-289.Mayurkumar Kevadiya, Hemish A. Vadiya, 2013,2D Analysis of NACA 4412 Airfoil, InternationalJournal of Innovative Research in ScienceEngineering and Technology, India, Volume 2, No.5 , pp. 168-1691.Menter FR, 1994, Two-Equation Eddy-ViscosityTurbulence Models for Engineering Applications,AIAA Journal, USA, Volume 32, No. 8, pp. 15981605.Mohammad Mashud, Mausumi Ferdous, ShahriarHossain Omee, 2012, Effect of Spoiler Position onAerodynamic Characteristics of an onics Engineering, Bangladesh, Volume 12,No. 6.Ovais Gulzar, S. Gulzar, S. Bhatele, N. Soni, 2014,Impact of Variation in Angle of Attack on NACA7420 Airfoil in Transonic Compressible Flow UsingSpalart-Allamaras Turbulence Model, IJRMET,India, Volume 4, No. 2, pp. 35-39.S.A. Prince, V. Khodagolian, C. Singh, T.Kokkalis,2009, Aerodynamic Stall Suppression on AirfoilSections Using Passive Air-Jet Vortex Generators,AIAA Journal, India, Volume 47, No. 9, pp. 22322242.Shih TH, Liou WW, Shabbir A, Zhu J, 1995, A Newk-ε eddy – Viscosity Model for High ReynoldsNumber Turbulent Flows, National Aeronautics andSpace Administration, USA, pp. 1-32.[13][14][15]2319-1163 pISSN: 2321-7308S.S Benadict Bensiger and N. Prasanth, 2012,Analysis of Bi-Convex Airfoil Using CFD Softwareat Supersonic and Hypersonic Speed, ElixirInternational Journal, Elixirpublishers, India,Volume 53, pp. 11695-11698Sutherland W, 1893, The Viscosity of Gases andMolecular Force, Encyclopaedia of AustralianScience, Australia, Volume 36, pp. .BIOGRAPHIESMD. Safayet Hossain was born in 1992 inChittagong. He is accomplishing BSc inMechanical Engineering from ChittagongUniversityofEngineeringandTechnology (CUET) and will completehis course in 2014(expected). His researchinterests contain Computational Fluid Dynamics, RenewableEnergy, Aerodynamics, Heat Transfer and SustainableEnergy.Muhammad Ferdous Raiyan was born in1990 in Chittagong. He has recentlyaccomplished BSc in MechanicalEngineering from Chittagong Universityof Engineering and Technology (CUET).HisresearchinterestsincludeComputational Fluid Dynamics, Aerodynamics, HeatTransfer, Materials Science, Turbo Machinery andThermodynamics.Mohammed Nasir Uddin Akanda wasborn in 1991 in Chittagong. He iscurrently accomplishing his BSc inElectrical and Electronics EngineeringfromChittagongUniversityofEngineering and Technology (CUET).His research areas are focused on telecommunicationengineering, signal processing, 3 phase induction motor,simulation science and programmable logic controllers(PLC).Nahed Hassan Jony was born in 1993 inChittagong. He is now completing hisBachelor in Mechanical EngineeringfromChittagongUniversityofEngineering and Technology (CUET).His research areas are primarily focusedon Aeronautical Engineering, Automobile Engineering andRobotics.Volume: 03 Issue: 10 Oct-2014, Available @ http://www.ijret.org350
Fig- 1: 2D view of NACA 6409 aerofoil. Fig- 2: 2D view of NACA 4412 aerofoil. 3.1 NACA 6409 Aerofoil Analysis The mesh was generated at the beginning according to Fig. 3 and 4 respectively. This meshing process and principle are based on the theory of finite element analysis method. Fig- 3: Complete mesh generation of NACA 6409 aerofoil.