Transcription
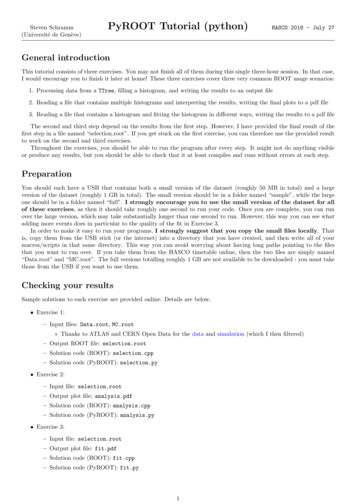
Steven Schramm(Université de Genève)PyROOT Tutorial (python)HASCO 2018 - July 27General introductionThis tutorial consists of three exercises. You may not finish all of them during this single three-hour session. In that case,I would encourage you to finish it later at home! These three exercises cover three very common ROOT usage scenarios:1. Processing data from a TTree, filling a histogram, and writing the results to an output file2. Reading a file that contains multiple histograms and interpreting the results, writing the final plots to a pdf file3. Reading a file that contains a histogram and fitting the histogram in different ways, writing the results to a pdf fileThe second and third step depend on the results from the first step. However, I have provided the final result of thefirst step in a file named “selection.root”. If you get stuck on the first exercise, you can therefore use the provided resultto work on the second and third exercises.Throughout the exercises, you should be able to run the program after every step. It might not do anything visibleor produce any results, but you should be able to check that it at least compiles and runs without errors at each step.PreparationYou should each have a USB that contains both a small version of the dataset (roughly 50 MB in total) and a largeversion of the dataset (roughly 1 GB in total). The small version should be in a folder named “sample”, while the largeone should be in a folder named “full”. I strongly encourage you to use the small version of the dataset for allof these exercises, as then it should take roughly one second to run your code. Once you are complete, you can runover the large version, which may take substantially longer than one second to run. However, this way you can see whatadding more events does in particular to the quality of the fit in Exercise 3.In order to make it easy to run your programs, I strongly suggest that you copy the small files locally. Thatis, copy them from the USB stick (or the internet) into a directory that you have created, and then write all of yourmacros/scripts in that same directory. This way you can avoid worrying about having long paths pointing to the filesthat you want to run over. If you take them from the HASCO timetable online, then the two files are simply named“Data.root” and “MC.root”. The full versions totalling roughly 1 GB are not available to be downloaded - you must takethose from the USB if you want to use them.Checking your resultsSample solutions to each exercise are provided online. Details are below. Exercise 1:– Input files: Data.root, MC.root Thanks to ATLAS and CERN Open Data for the data and simulation (which I then filtered)– Output ROOT file: selection.root– Solution code (ROOT): selection.cpp– Solution code (PyROOT): selection.py Exercise 2:– Input file: selection.root– Output plot file: analysis.pdf– Solution code (ROOT): analysis.cpp– Solution code (PyROOT): analysis.py Exercise 3:– Input file: selection.root– Output plot file: fit.pdf– Solution code (ROOT): fit.cpp– Solution code (PyROOT): fit.py1
Exercise 1: Processing dataIf you are working with ROOT, then the odds are you will need to work with reading simulated or real data from trees atsome point. The TTree is the primary ROOT storage object which handles the interface between transient information(variables that you have in the computer memory) and persistent information (variables that you have written to yourhard drive). If you ever work with data from an experiment or Monte Carlo (MC) simulation, you will likely be usingfiles that are stored in the form of a TTree.The idea of a TTree is that each event, corresponding to an interaction of interest, is independent from all otherevents. For example, there is no correlation between what happens in two subsequent beam crossings at the LHC.However, every event should have a given set of information that describes it. At the most basic level, this may be theelectronic signals associated with a given part of a detector, or the PDG ID of a particle in MC simulation. This set ofpotential information should be the same for every event, and thus the variables that you need to describe an event arefixed. The TTree provides such functionality, by defining a TBranch to represent each variable, and where the value ofthat TBranch is updated each time you tell the TTree to go to the next event.The TTree therefore provides a detailed representation of an event. On the other hand, it is possible to calculatesummary information that describes the properties of the ensemble of all events of interest. This is typically done usinghistograms, all of which derive from the base class TH1 (T for a ROOT object, H for histogram, and 1 for one-dimensional).There are also two and three dimensional histograms (TH2 and TH3), as well as more specialized histogram types.One of the most fundamental tasks is to read a full TTree, representing the detailed description of a given set of data,and using that data to fill a set of histograms representing the features of interest. Once this is done, it is useful to writethese histograms to an output file for further study or to make publication-quality plots. This process is the focus of thefirst exercise: reading a TTree from a file, using it to fill a TH1, and writing that histogram to a new output file.The final result that you are aiming to achieve is provided as the file selection.cpp. Please try to avoid usingthat file directly. Instead, the below steps will guide you towards obtaining that result, and you should only look at therelevant part of the solution if you get really stuck or if you are finished and want to compare to my version. Step 1: create the basic structure of a PyROOT script– PyROOT scripts are the same as any other python script, they just have to “import ROOT”.– Create the script with something like the below to get started.import ROOTprint " This is my script "– Run the script using python:python myScript.py Step 2: define the script arguments– We want this script to run over a file and write the results to a new file. As such, we want two arguments, onefor each file name.– Enforce this behaviour using the sys library to check the number of arguments, similar to the belowimport ROOTimport sysif len ( sys . argv ) ! 3:print " USAGE : % s input file output file " %( sys . argv [0])sys . exit (1)inFileName sys . argv [1]outFileName sys . argv [2]print " Reading from " , inFileName , " and writing to " , outFileName– Run the script using python:python myScript.py Data.root hist.root Step 3: open the input file for reading– Once we have the file name, it is time to open the file– ROOT handles interactions with files by using the TFile class– Open the file using:inFile ROOT . TFile . Open ( inFileName , " READ " )2
– The first argument is the name of the file and the second is what we want to do with the file. In our case, wejust want to read from it, not write to it. Step 4: retrieve the TTree from the file– After opening the file, we want to get the TTree from it. This is done by using “Get” on the file. As this ispython, that’s all we have to do, it will figure out the type by itself.– The name of the TTree in the file is “HASCO”– Get the TTree using:tree inFile . Get ( " HASCO " ) Step 5: declare the variables that we want to read from the file– Thanks to using python, we can skip this step. See the C document for examples of how to do this morespecifically, but it’s not necessary in python if we take advantage of python’s variable access flexibility. Step 6: create the histogram that we want to fill– We want to look at the di-lepton invariant mass. This is a floating point quantity, so we want either TH1F (Ffor float) or TH1D (D for double). Let’s use a double-precision histogram in this case. We want to plot thisquantity by itself, not with respect to another quantity, so we only need a one-dimensional histogram.– Let’s create a 1D histogram. Note that the variables in the tree are in units of MeV, but the LHC is highenergy and thus everything will be in the thousands of MeV (aka in GeV). As such, we will need to createbins in the GeV range.– Let’s create 150 bins, starting from 50 GeV (50 103 MeV) and ending at 200 GeV (200 103 MeV):mll ROOT . TH1D ( " data " ," m { ll } , data " ,150 ,50. e3 ,200. e3 )mll . Sumw2 ()– The last part is configuring the way that we want to handle statistical uncertainties in the histogram. Most ofthe time, you want uncertainties to be calculated using the sum of weights squared, or Sumw2. That is alsotrue in this case. Step 7: loop over the TTree entries– We now have a tree and a histogram. The next step is to actually loop over all of the events in a tree so thatwe can fill the histogram.– Loop over the events in the TTree as follows:for entryNum in range (0 , tree . GetEntries ()):tree . GetEntry ( entryNum ) Step 8: calculate the pairs of lepton four-vectors for each event and the di-lepton invariant mass– Each time GetEntry is called in python, all of the variables we defined are written to the tree object. We cannow check that there are two leptons in the event and make their four-vectors, then use that to calculate thedi-lepton invariant mass.– We have to check that there are actually two leptons, as we can’t calculate a di-lepton mass if there is only onelepton in the event. If there are not two leptons, then we should skip this event (continue to the next event).– We will use the special python function named “getattr” (get attribute) to retrive variables from the treeafter they have been loaded into memory. This is not possible in C for entryNum in range (0 , tree . GetEntries ()):# Previous code in the loop is hereif getattr ( tree , " lep n " ) ! 2:continue– After we have confirmed that there are two leptons, we can build their four-vectors and store them asTLorentzVector objects, which contain lots of useful functions.for entryNum in range (0 , tree . GetEntries ()):# Previous code in the loop is herelepton0 ROOT . TLorentzVector ()lepton1 ROOT . TLorentzVector ()pt getattr ( tree , " lep pt " )eta getattr ( tree , " lep eta " )phi getattr ( tree , " lep phi " )nrg getattr ( tree , " lep E " )lepton0 . SetPtEtaPhiE ( pt [0] , eta [0] , phi [0] , nrg [0])lepton1 . SetPtEtaPhiE ( pt [1] , eta [1] , phi [1] , nrg [1])3
– We now have four-vector representations of the two leptons. However, we want the di-lepton system, which isthe four-vector sum of the two leptons. Then, we want to store the mass of that system.for entryNum in range (0 , tree . GetEntries ()):# Previous code in the loop is heredilepton lepton0 lepton1dileptonMass dilepton . M () Step 9: fill the histogram– We now have the di-lepton mass, so we want to fill the histogram. This is the last thing that we need to doin the loop.for entryNum in range (0 , tree . GetEntries ()):# Previous code in the loop is heremll . Fill ( dileptonMass ) Step 10: change the histogram scope/lifetime– Once the histogram has been filled, we want to make sure that it doesn’t disappear. By default, histogramsare linked to the last file that was opened, so when you close the file the histogram may disappear.– We want to change this behaviour, to say that the histogram we just created has no parent file, and thusshould not be removed when any files are closed.mll . SetDirectory (0) Step 11: close the input file– Now that we have set the histogram to have a global scope, we can safely close the input file.– It is a good practice to close files when we are done using them to help with memory management and toavoid multiple file access problems.inFile . Close () Step 12: write the histogram to the output file– Now that we have filled the histogram and closed the input file, we want to open a new file to store the results.We will open it using the “RECREATE” mode, which means that we are opening it for writing AND if a filewith the specified name already exists, we are ok to overwrite it with our new file.outHistFile ROOT . TFile . Open ( outFileName , " RECREATE " )– After opening the file, we need to switch our scope to being within that fileoutHistFile . cd ()– Now we can write our histogram (and as many other histograms as we want) to the filemll . Write ()– Finally, we have to close the output file, which is what triggers it to be written to disk rather than living inmemoryoutHistFile . Close () Step 13: run the program– At this point, the program is complete! Hopefully you have been running it throughout the steps to ensurethat nothing was going wrong (syntax errors or similar).– Make sure to run the program now. If everything went well, you should now have an output file with the namethat you specified as the second argument to the program. Step 14: check the output file– Now that we have made a file, we should check that it actually has done what we wanted. Does it contain ahistogram? Does that histogram look reasonable?– Let’s open the output file and open it with a TBrowserroot -l hist . root4
– You should see messages like the following:root [0]Attaching file hist.root as file0.(TFile *) 0x3234d10root [1]– Now, open the TBrowser:TBrowser t ;– This will give you a window with the file listed. Double click on the file, then double click on the name of thehistogram. You should then see the histogram, and it should look something like this:– You’ve found the Z-boson! Good job! NOTE - this is the end of the main part of this exercise, while the below is adding more complexfunctionality. If you are short on time, you can download the file named “selection.root” and usethat for the next two exercises. Step 15: extend the program to handle both data and MC– Normally in physics, we want to compare our data with our simulation, representing the Standard Modelexpectation– For example, is the peak we saw in the last part representative of the Z, or is it too small or too large?– To do this, we need our program to be able to run over both data and MC– Steps 3 through 11 can be placed in a function (read a file, fill a histogram, close the file, and return thehistogram)– This function can then be used for both data and MC– Add one more argument to the script (so that the user can specify the names of both the data and MC inputfiles)– Once this is done, you can run the program again and get two histograms in the output file (make sure toname them differently). Step 16: add weights for the MC– The MC might be different than the data, either because of how it was generated or because of non-perfectmodelling of physics effects. The former effect is generally addressed with a MC weight, while the later isaddressed by the use of scale factors. We have this information in the TTree as well and can retrieve it.– We have to calculate the total weight to apply, which is just the product of the four values.for entryNum in range (0 , tree . GetEntries ()):# Previous code in the loop is hereweight 1.0if isMC :weight * getattr ( tree , " mcWeight " )weight * getattr ( tree , " s ca le Fa ct or P IL EU P " )weight * getattr ( tree , " scaleFactor MUON " )weight * getattr ( tree , " s ca l e Fa c t or T RI G G ER " )// Later code in the loop is here– Then, when we are filling the histogram, apply this weight:5
for entryNum in range (0 , tree . GetEntries ()):# Previous code in the loop is heremll . Fill ( dileptonMass , weight )– Now your MC has been corrected to more correctly model the expected data distribution. That’s it! You’re done exercise 1. You should now have a ROOT file that contains two histograms, one for the MCand one for the data.6
Exercise 2: Data analysis – plottingYour thesis will certainly involve some plots, and many (or all) of them will likely be made using ROOT. Plots are theway in which you convey your scientific results to the larger community, and it is very important that they are clear andeasy to understand. Your plots may also be shown independent of their accompanying captions, such as in conferencetalks. As such, it is important that any key information required to understand the plot is listed directly on the plot inthe form of labels. In this exercise, we will go through the process of creating a nice publication-style plot. Step 1: create the basic structure of a PyROOT script, with arguments– Create the script with something like the below to get started.import ROOTimport sysif len ( sys . argv ) ! 3:print " USAGE : % s input file output file " %( sys . argv [0])sys . exit (1)histFileName sys . argv [1]plotFileName sys . argv [2]print " Reading from " , histFileName , " and writing to " , plotFileName– Run the script using python:python myScript.py selection.root plots.pdf– The input ROOT file should be the one produced at the end of Exercise 1, or the one that I have provided foryou. Step 2: open the input histogram file for reading– Once we have the file name, it is time to open the file– ROOT handles interactions with files by using the TFile class– Open the file using:histFile ROOT . TFile . Open ( histFileName , " READ " )– The first argument is the name of the file and the second is what we want to do with the file. In our case, wejust want to read from it, not write to it. Step 3: retrieve the two histograms from the file– Just like in exercise 1, where we were retrieving the TTree, we will use the Get function. This function returnsthe object of the requested name, assuming that it exists. If you are using my input file, then the names ofthe two histograms are “data” and “MC”.dataHisto histFile . Get ( " data " )mcHisto histFile . Get ( " MC " )– It is also important to check that we retrieved the histograms, as we don’t want the program to crash if weget the name of the histogram wrong.if not dataHisto :print " Failed to get data histogram "sys . exit (1)if not mcHisto :print " Failed to get MC histogram "sys . exit (1) Step 4: set histogram scope and close the input file– Once the histograms have been retrieved from the file, we want to make sure that they don’t disappear. Bydefault, histograms are linked to the last file that was opened, so when you close the file the histogram maydisappear.– We want to change this behaviour, to say that the histograms we just retrieved should live beyond their parentfile, and thus should not be removed when any files are closed.– Then, close the input file.7
dataHisto . SetDirectory (0)mcHisto . SetDirectory (0)histFile . Close () Step 5: prepare to save plots to an output file– Any time you draw a plot in ROOT, you are using a TCanvas. There is a default canvas, but you can’tmanipulate the default canvas so easily. Instead, it is useful to define your own canvas and use that instead.– We have to give the TCanvas a unique name, but it doesn’t have to be anything original. Below, we havenamed it simply “canvas”.– We also have to specify that we want to use the canvas, which is the second command below.canvas ROOT . TCanvas ( " canvas " )canvas . cd ()– Once we have a canvas, we can also set it to be written out to a plot file. In particular, pdf and ps files arevery useful because they can have multiple pages (unlike eps or png). We can therefore write several plots tothe same file.– If we want to write several plots to the same file, then we can use the below command. The name of a filefollowed by “[” tells ROOT that we want to print several plots to the same file. The same command withoutthe “[” will write the current canvas to the file and that’s it, so that’s what you would use for eps, png, orsimilar.canvas . Print ( plotFileName " [ " )– The above is a fancy way to add a “[” to the end of the string. If plotFileName is “plots.pdf”, then theabove is equivalent to:canvas . Print ( " plots . pdf [ " )– After you have drawn all of your plots (see below), the very last command you should use is the one to closethe plot file. Without this, your plots may not be readable, as the program will exit without actually writingthe plots from memory to disk. This is done using a closing bracket, “]”.canvas . Print ( plotFileName " ] " )– Again, if plotFileName is “plots.pdf”, then the above is equivalent to:canvas . Print ( " plots . pdf ] " ) NOTE - for all of the below steps, the new code should be added between the opening and closingcommands listed in the previous step. That is, all plotting commands should be after the openingof the plot file, and before the closing of the plot file. Step 6: draw the two histograms and write them as two separate plots to the same pdf file– Draw the MC histogram as a histogram (connected lines with vertical transitions at each bin boundary) andthen write it to the output file:mcHisto . Draw ( " h " )canvas . Print ( plotFileName )– Now draw the data histogram as points with error bars and write it to the output file:dataHisto . Draw ( " pe " )canvas . Print ( plotFileName )– If you now run the script, you should get a file with two plots:60 10mll, MC9mll, datadataMCEntriesMeanStd Dev2076058.97e 049733EntriesMeanStd Dev7000627568.945e 041.068e 160180 102008306080100120140160180 102003
NOTE - whenever you are changing the style of a plot, you have to add the new code to modify theplots before the relevant Draw and Print commands. Step 7: fix the basic style– The statistics box in the top right corner of each plot is not useful for these plots. Let’s remove it.mcHisto . SetStats (0)dataHisto . SetStats (0)– Let’s also change the colours of the two histograms so that they can be easily told apart. Let’s also increasetheir width from “1” to “2” such that they are thicker and easier to see.mcHisto . SetLineColor ( ROOT . kRed )dataHisto . SetLineColor ( ROOT . kBlack )mcHisto . SetLineWidth (2)dataHisto . SetLineWidth (2)– Finally, let’s add axis labels to the plots. You may know what your plot shows, but if you are showing it tosomeone else, they will not understand the plot without axis labels. This should really be done for every singleplot you make. Even if you make a plot and know what it is now, when you go to use it a few months or yearslater in your thesis, you will probably forget the specific details.mcHisto . GetYaxis (). SetTitle ( " Number of events " )dataHisto . GetYaxis (). SetTitle ( " Number of events " )mcHisto . GetXaxis (). SetTitle ( " m { ll } [ MeV ] " )dataHisto . GetXaxis (). SetTitle ( " m { ll } [ MeV ] " )60 10mll, MC9mll, dataNumber of eventsNumber of events– If you now run the script, you should get a file with two 00120140160 10180200mll [MeV]306080100120140160180 10200mll [MeV]3 Step 8: change to a logarithmic view– The plots are very sharply peaked, which means that it is hard to see anything other than the peak. We canchange this by using a logarithmic y-axis, which is done by changing the canvas (not the histogram).canvas . SetLogy ( True )– Now if you run the script, you should get a file with two plots:mll, dataNumber of eventsNumber of eventsmll, MC101110101041031091021081010711066080100120140160 10180200mll [MeV]36080100120140160180 10200mll [MeV]3 Step 9: normalize the MC histogram– If you look at the plots, you will see that the y-axis has a very different range. The y-axis of the MC plotseems to be roughly 7 orders of magnitude larger than the data y-axis!9
– There are several reasons for this, but for now, the main point is that this is an artificial difference. As such,we want to normalize the MC histogram to data to remove this offset.– We don’t want to normalize it in a way that makes the distributions agree bin-by-bin, as they we could neversearch for new physics or measure the standard model properties. Instead, we want to just get the overallscale correct. One way to do this is to scale by the total number of events in data vs the number of eventsin MC. This is done using the integral of the histograms (which is the total number of events, as the y-axis isjust the number of events in a given bin).mcHisto . Scale ( dataHisto . Integral ()/ mcHisto . Integral ())– Now if you run the script, you should get a file with the same two plots as before, but now the y-axis rangefor the MC and data are essentially identical (up to roughly 104 events). Step 10: draw the data and MC on the same plot– Now that we have set the histograms to the same scale, we can compare them in a sensible manner. Let’sstart by drawing them on the same plot (a third plot, created after the previous two).– We are drawing the MC histogram with solid lines and the data as points, so we should draw the MC histogramfirst. This way, we can see points on top of solid lines where the two histograms overlap, instead of the solidlines hiding any points underneath.– The “same” option is what tells ROOT to draw a given object on top of the previous one(s).mcHisto . Draw ( " h " )dataHisto . Draw ( " pe , same " )canvas . Print ( plotFileName )– Now if you run the script, you should get a file with three plots, where the third plot is as below.Number of eventsmll, MC1041031021016080100120140160180 10200mll [MeV]3 Step 11: Make a split-panel plot– There is reasonably good agreement between the data and MC. To quantify how good the agreement is, wemay want to take a ratio. However, we want to also see the non-ratio plot to understand the situation better,and so we can see whether we are in the peak or not. As such, we want a split-panel plot, with the currentplot on top and a ratio on the bottom.– First, let’s prepare by creating a histogram which is the ratio of the data divided by the MC. Do this bycreating a copy of the data histogram (to avoid modifying the original one) and dividing that histogram bythe MC.ratio dataHisto . Clone ()ratio . Divide ( mcHisto )ratio . SetLineColor ( ROOT . kRed )– Next, we should clear the current canvas, as we are going to do something more complicated and don’t wantthe old plot to be hiding in the backgroundcanvas . Clear ()– Now, create a TPad (a sub-canvas) with a horizontal extent of the full range (0, y, 1, y) and a vertical extend ofthe upper 70% of the range (x, 0.3, x, 1). That is, this sub-canvas should be the upper 70% of the full canvas.– Set the sub-canvas to have a logarithmic y-axis, draw the sub-canvas on the canvas, set the sub-canvas to bethe owner of whatever is drawn next, and then draw the MC and data histograms (not their ratios) on thisupper sub-canvas.10
pad1 ROOT . TPad ( " pad1 " ," pad1 " ,0 ,0.3 ,1 ,1)pad1 . SetLogy ( True )pad1 . Draw ()pad1 . cd ()mcHisto . Draw ( " h " )dataHisto . Draw ( " pe , same " )– Now, go back to the full canvas and make a second sub-canvas covering the bottom 30% of the plot, and thendraw the ratio on that sub-canvas. Note that this sub-canvas is a linear scale, not logarithmic, as this is aratio.canvas . cd ()pad2 ROOT . TPad ( " pad2 " ," pad2 " ,0 ,0.05 ,1 ,0.3)pad2 . Draw ()pad2 . cd ()ratio . Draw ( " pe " )canvas . Print ( plotFileName )– With all of this done, if you run the script, you should get the following fourth plot in the same file after theprevious three. It’s a nice plot, but it can definitely be improved.Number of eventsmll, MC41031021010136080100120140160180140160180 10200mll [MeV]Number of eventsmll , data765432106080100120 10200m ll [MeV]3 NOTE - whenever you are changing the style of a plot or pad, you must change the style beforecalling the Draw() command. This applies to both histograms and pads. Step 12: Change the pad spacing to better use canvas space– First, remove the border spacing on the bottom of the top padpad1 . SetBottomMargin (0)– Now, remove the border spacing on the top of the bottom pad. Also add a bit of extra space on the bottomof the top pad so that we have some space for later.pad2 . SetTopMargin (0)pad2 . SetBottomMargin (0.25)– Once this is done, the upper and lower plots touch, which makes sense as you only need to have one x-axislabel for the two plots (they are the same axis). You should now have a plot like the below.Number of eventsmll, MC410310210101Number of events3760801006080100120m , datall1401601801401601806 10200mll [MeV]54321012011 10200m ll [MeV]3
Step 13: adjust the size and contents of axis labels and markers– First, get rid of the x-axis labels on the top plot, this removing the random 103 on the far right of the plotmcHisto . SetTitle ( " " )mcHisto . GetXaxis (). SetLabelSize (0)mcHisto . GetXaxis (). SetTitleSize (0)– Then increase the size of the y-axis label, which is necessary because the pad is only 70% of the full verticalrange, so we need to increase the text size to get back to a reasonable value.mcHisto . GetYaxis (). SetTitleSize (0.05)– Now do the similar things to the bottom panel, also increasing the text sizes everywhere as this is now only30% of the full vertical range. Note that the title offset is changed at one point to bring the label closer to theaxis (so it doesn’t go off the canvas).ratio . SetTitle ( " " )ratio . GetXaxis (). SetLabelSize (0.12)ratio . GetXaxis (). SetTitleSize (0.12)ratio . GetYaxis (). SetLabelSize (0.1)ratio . GetYaxis (). SetTitleSize (0.15)ratio . GetYaxis (). SetTitle ( " Data / MC " )ratio . GetYaxis (). SetTitleOffset (0.3)Number of events– Once this is done, you should have a plot like the 180 10200mll [MeV] Step 14: improve the ratio plot range and axis– The ratio plot right now isn’t very useful, as there are very large uncertainties for large values of the di-leptonmass which are making the y-axis range quite large. Let’s specify the range we want to see, focusing in on therange close to the value of 1 (0.5 to 1.5), such that we can see where the two distributions agree or not.ratio . GetYaxis (). SetRangeUser (0.5 ,1.5)– Next, the y-axis labels are quite dense. Let’s reduce this by manually specifying the number of divisions touse. See th
{ PyROOT scripts are the same as any other python script, they just have to \import ROOT". { Create the script with something like the below to get started. importROOT print"Thisismyscript" { Run the script using python: python myScript.py Step 2: de ne the script arguments { We want this script to run over a le and write the results to a .