Transcription
This file was created by scanning the printed publication.Mis-scans identified by the software have been corrected;however, some errors may remainUnited StatesDepartment ofAgricultureForest ServicePacific NorthwestForest and RangeExperiment StationResearch PaperPNW-322August 1984Estimating Tree Bole and LogWeights From Green DensitiesMeasured With the BergstromXylodensimeterDale R. Waddell, Michael B Lambert, and W. Y. Pong
AuthorsDALE R. WADDELL is a research forester, MICHAEL B LAMBERT is a mechanical engineer, and W. Y. PONG is a research forest products technologist, PacificNorthwest Forest and Range Experiment Statron, P.O. Box 3890, Portland,Oregon 97208
Contents123345IntroductionObjectivesMethodsStudy AreaSelection of Sample TreesMeasuring Green Density by the Wood Disk Technique(1981 Sample)6 Measuring Green Density With the Xylodensimeter(1981 and 1982 Samples)8 Comparison of the Wood Disk Technique With theXylodensimeter Technique (1981 Sample)9 Calculating Log Weights From Densities Obtained With theXylodensimeter (1982 Sample)11 Measuring Log Weights (Lifted Weights) and ComparingThem With Calculated Weights (1981 Sample)11 Calculating Bole Weights From Densities Measured Withthe Xylodensimeter (1982 Sample)13 Measuring Lifted Weights and Comparing Them WithCalculated Bole Weights (1982 Sample)13 The Development and Validation of Bole PredictionEquations (1982 Sample)13 Results13 Comparison of the Wood Disk Technique With theXylodensimeter Technique14 Comparison of Lifted and Calculated Log Weights14 Evaluation of Weight Prediction Equations16 Discussion17 How To Use the Xylodensimeter for Measuring Log andBole Weights17 Problems and Further Applications18 Conclusions18 Acknowledgment18 Metric Conversions18 Literature Cited
AbstractWaddell, Dale R.; Lambert, Michael B; Pong, W. Y. Estimating tree bole and logweights from green densities measured with the Bergstrom xylodensimeter.Res. Pap. PNW-322. Portland, OR: U.S. Department of Agriculture, ForestService, Pacific Northwest Forest and Range Experiment Station; 1984.18 p.The performance of the Bergstrom xylodensimeter, designed to measure thegreen density of wood, was investigated and compared with a technique that derived green densities from wood disk samples. In addition, log and bole weightsof old-growth Douglas-fir and western hemlock were calculated by variousformulas and compared with lifted weights measured with a load cell attached toa front-end loader. The Bergstrom xylodensimeter accurately measured greenwood density and is useful for estimating log weights.Keywords: Log measurements, boles, wood density, cubic volume measure, measuring equipment, old-growth stands.SummaryAerial logging or neavy material requires accurate estimates to load weight forsafety and for economical production. Green wood density is an important element in estimating log and tree bole weight. This study was conducted to evaluatethe Bergstrom xylodensimeter, an instrument consisting of a calibrated hydrometer and flotation chamber that measures the green density of an increment core.Results obtained with the xylodensimeter were compared with results using thestandard wood disk technique. Log weights calculated from measured greendensities multiplied by the volume of the log were compared with actual weights.Calculated weights of tree boles were also compared with lifted weights. Bias andaccuracy statistics were also presented.The study was conducted in the Wind River Experimental Forest, Gifford PinchotNational Forest, in southwest Washington; green density and log weights of bothDouglas-fir and western hemlock were tested.Results indicated acceptable values of bias and accuracy for many applicationsin aerial logging. Further refinements in methodology and additional research arerecommended. Examples of how to apply the techniques are provided.
IntroductionIn the last 20 years, there has been an emphasis in forestry on developing aeriallogging systems including heavy-lift helicopters, balloons, and airships. They increase yarding efficiency through larger lift capacities, better access to remotetimber, and less road construction. The result can be lower primary transportationcosts per unit volume of timber with potentially less impact on the environment.For most timber harvesting systems, a substantial increase in production rates cancan be accomplished by the accurate estimation of log weights (Conway 1976,Dykstra 1975, Hartsough and others 1983). In cable yarding systems, the sizeof the cable line is often dictated by the weight of the heaviest logs in a sale unit.Poor estimates of load weights in aerial logging periodically result in aborts causedby overloading and in extra flight hours when payloads do not approach liftcapacity; therefore, the larger the lift capacity of the airborne system and thehigher the percentage of time spent transporting logs from the woods to the landing, the greater the requirement to accurately estimate the weight of the load.Although accurate determination of log weights is critical to the success of aeriallogging systems, estimation of log weights has received limited research attention.The need for accurate weights was recognized in the early 1960's when weightscaling and heavy-lift aerial logging attracted the interest of foresters.Generally, the two variables required to provide an estimate of the weights of thewhole bole or of segments are volume and green density (dry density plus moisture). This paper deals primarily with the measurement of green density and represents one step in a system that will eventually help solve various problemsrelated to the prediction of weight.The Bergstrom xylodensimeter1/ was designed to estimate the green density ofwood in the field. Bergstrom developed the device after observing partially submerged logs in a millpond. He noted that logs with similar dimensions floatat varying depths, presumably because of differences in green density. Afterinvestigating further, however, he found that others had noted that floating logsin millponds may not accurately reflect their density. He assumed that this wascaused by uneven taper, sweep, crook, or other dimensional features of the log.He hypothesized that if a uniform sample from a log could be obtained, thisproblem might be overcome. He then constructed a portable device to measurethe displacement of water in a plastic container when an increment corewas submerged.1/The xylodensimeter ("xylo" meaning wood) was designed byGary Bergstrom, presently working as a logging specialist,USDA Forest Service, Rogue River National Forest, Medford,Oregon.1
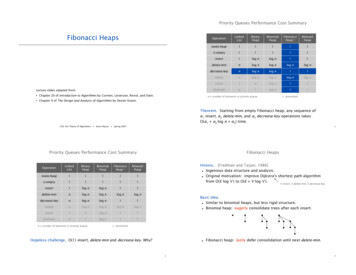
The Bergstrom xylodensimeter consists of a hydrometer and a plastic cylinder(flotation chamber) containing water. The hydrometer is calibrated to house anincrement core of a specific diameter and length (fig. 1). The hydrometer is constructed of thin-walled aluminum and plastic. An increment core is inserted inthe hydrometer and then floated in the plastic cylinder filled with distilled water.Green density (pounds per cubic foot) is read directly from the waterline on thegraduated scale of the hydrometer. The instrument has been tested and successfully calibrated with homogeneous materials of known densities. The measurementof the green density of wood, essentially a heterogeneous material, and its application to estimating log weights is the next logical step in the evaluation process.This study was designed to answer three questions about the performance of theBergstrom xylodensimeter as a tool for estimating log and bole weights:1. How accurately can it measure the green density of wood in recently cut logscompared with standard wood disk techniques?2. Can this measurement of green density, combined with the volume of the log,estimate the weight of logs accurately?3. How well do models developed from measurements on a small subsample oftrees predict the weights of boles for trees in the same stands and from differentstands?We conducted two field studies with the Bergstrom xylodensimeter, one in thesummer of 1981 and the other in the summer of 1982. After qualitative evaluations were conducted in the 1981 study, structural changes were made on thehydrometer element (fig. 1) to provide an easier means of inserting fragileincrement cores.Objectives2Objectives were to estimate: (1) the accuracy and bias of the Bergstrom xylodensimeter in the measurement of green wood density, (2) the accuracy and biasof estimated log weights from calculated volumes and green densities measuredwith the Bergstrom xylodensimeter, and (3) the accuracy and bias of predictedtree bole weights from regression equations developed for one population of treesand applied to other populations.
Figure 1.-A schematic of the Bergstrom xylodensimeter.MethodsStudy AreaFour study plots (three 5-acre plots and one 20-acre plot) were selected in theWind River Experimental Forest (Trout Creek Hill Unit) on the Gifford PinchotNational Forest, southwest Washington. The principal species in the area areold-growth Douglas-fir (Pseudotsuga menziesii (Mirb.) Franco) and westernhemlock (Tsuga heterophylla (Rat.) Sarg.). Secondary species are western redcedar (Thuja plicata Donn ex D. Don) and true firs (Abies spp.).3
Selection ofSample TreesStudy trees from the four plots were selected from old-growth merchantableDouglas-fir and western hemlock, ranging in diameter at breast height (DBH) 2/from 10 to 60 inches. 3/ The total number of western hemlock and Douglas-fir onthe four plots was 1,876. This includes the combination of all trees for both the1981 and 1982 studies. Each tree was assigned a sequential number. After stratification by species and diameters, 30 trees of each species were randomlyselected from three 5-acre plots (1981 sample; plots 1 to 3) and 50 trees perspecies from one 20-acre plot (1982 sample; plot 4) (table 1). Because ofproblems in the load cell during weighing, one western hemlock and oneDouglas-fir tree were deleted from the 1981 sample, leaving 79 trees per speciesfor the entire study.2/Diameter of tree bole at 4 ½ feet above ground level as measured on the uphill side of the tree.3/Trees selected in the three 5-acre plots (1981 samples) werescreened for major defects and external damage determinedby a concurrent study of tree crowns. If defect or damage in atree would jeopardize the safety of a tree climber, the tree wasnot selected.Table 1—Distribution of 79 sample trees by species and diameter class, southwestern Washington1/ Diameter at breast height4
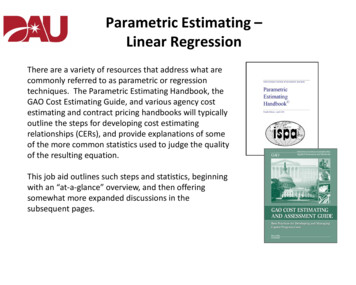
Trees were felled and bucked into segments with length restricted so that theweight of individual logs would not exceed the capacity of the front-end loaderused to lift the logs for weighing. The bucking of logs began as a trial and errorprocess until approximations of maximum log lengths could be established for agiven diameter class. All logs were identified with coded tags after bucking.Measuring Green Densityby the Wood DiskTechnique (1981 Sample)Immediately after the felling operation, wood disks were cut from the large end ofthe butt log and at various intervals to the top of the bole (fig. 2). Four wedgeshaped pieces were cut radially along perpendicular diameters of each disk. Eachwedge was divided into sapwood and heartwood zones. From each zone a sample,approximately 1.5 x 1.5 x 4 inches, was taken. These samples provided material fordetermining the radial profile of green density in the sapwood and heartwoodFigure 2.—The measurement of green density by the disk method.An example of a "weighted average green density" computation fora single disk.Green density averages (four samples per component):3Sapwood component 52 Ib/ft .3Heartwood component 48 Ib/ft .Volume calculation:3zVolume (ft ) (π)(radius) (disk thickness)/1728.2Total wood volume in the disk (π )(45 inches/2) (4 inches)/17283 3.68 ft .2Heartwood volume in the disk (π )(22 inches/2) (4 inches)/17283 0.88 ft .33Sapwood volume in the disk 3.68 ft - 0.88 ft3 2.80 ft .33Sapwood weight (52 Ib/ft )(2.80 ft ) 145.60 Ib.33Heartwood weight (48 lb/ft )(0.88 ft ). 42.24 Ib.Total weight 187.84 Ib.3Weighted average green density 187.84 lb/3.68 ft3 51.04 Ib/ft .5
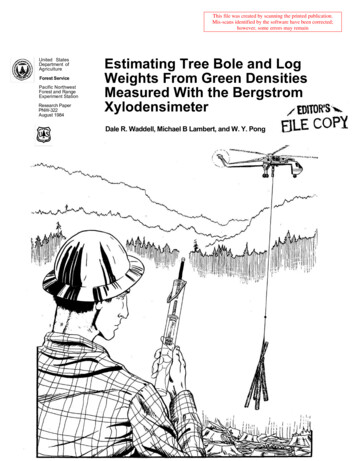
regions of the disk. Each density sample was labeled so that its location in thetree could be traced radially and longitudinally. The number of disks cut per treedepended on tree size and log length. Logs with small diameters had only oneradial sample taken for each wedge-shaped section because of the lack of heartwood in logs of the upper crown. Samples were taken to the laboratory in sealed,tared containers for further analysis.In the laboratory, the green weight of each sample was measured and the volumewas determined by immersing the sample in water (Brown and others 1952). Thegreen density of the sample was calculated by dividing the weight of the sampleby its green volume. An average green density was computed for the four radialsamples extracted from the sapwood and heartwood zones of the disk. A singleweighted green density was then determined from volumetric proportions of sapwood to heartwood. An example is presented in figure 2.Measuring Green DensityWith the Xylodensimeter(1981 and 1982 Samples)After disk sampling (1981 samples), two increment cores were taken at eachsample point (one core from above and one from below the disk sample). Volumetric proportions of sapwood to heartwood in the logs were duplicated in thecores by cutting them to a 6-inch length in approximately the same percentage,by volume, of the sapwood and heartwood components in the log. Two radialmeasurements were needed so that appropriate proportions of sapwood to heartwood could be applied to the core for each sample point; these were the diameterinside bark (DIB) and inches of sapwood (IOS). The DIB was measured from thecross section of the log at the sampling point (average of the long and shortdiameters). The IOS was measured directly from the extracted core.The following equation provides the percentage of sapwood (%S) needed in thecore to duplicate the proportion of sapwood in the log:%S (DIB) 2 -((DIB)-2(IOS)) 2 (100) 4(IOS)(DIB-IOS)(DIB)2(DIB)2(100).(1)Equation 1 was programed into a calculator and was also presented as a series ofcurves for various combinations of DIB and IOS (fig. 3); for example, from eitherequation 1 or figure 3, a log with a 30-inch DIB and 3.3 inches of sapwood wouldhave 39 percent sapwood'The increment core was placed in a "core length cutter guide" and cut with asharp knife to the correct length (fig. 4). The metal L-shaped device has a scalefor percentage of sapwood inscribed on the surface. The heartwood to sapwoodtransition of the core was placed adjacent to the inscribed %S, as calculated fromequation 1 or read from the curves, (fig. 3), and the core was cut flush at bothends of the guide. The process results in a 6-inch increment core with the sameestimated ratio of heartwood to sapwood volume as that of the og.6
Figure 3.—Curves showing percentage of sapwood.4(IOS)(DIB-IOS)Sapwood (percent) (100).Figure 4.—Core length cutter guide.7
The core was then placed in the hydrometer and lowered into the water-filledflotation chamber (fig. 1). A reading taken at the intersection of the waterline withthe graduated scale of the hydrometer gave the green density of the core. Figure5 illustrates the procedure.Figure 5—The process of measuring green density with theBergstrom xylodensimeter.Comparison of the WoodDisk Technique Withthe XylodensimeterTechnique (1981 Sample)8Estimates of green density by the wood disk technique were compared with.estimates by the xylodensimeter in terms of the mean of the differences and themean of the absolute differences for paired observations in both western hemlockand Douglas-fir. The comparison provided an estimate oi bias (mean of thedifferences) and absolute error (mean of the absolute differences): for the xylodensimeter in terms of the values obtained from the wood disk measurement.
Calculating Log WeightsFrom Densities ObtainedWith the Xylodensimeter(1982 Sample)Each log was scaled for gross cubic volume after it was sampled for density. Logend diameters (outside bark) were measured on the cross section of the log to thenearest (0.1) inch and the lengths to the nearest (0.1) foot. Volumes for Douglasfir butt segments were calculated by Bruce's (1982) butt log equation:V CL(0.25D2 0.75d2);(2)for western hemlock butt segments by the sub-neiloid rule, for midsegments ofboth species by the Smalian rule, for top segments of both species by the twoend conic rule (Dilworth 1981):sub-neiloid rule:(D d)2V CL;2(3)Smalian rule:(D2 d2)V CL;2two-end conic rule:(d2 D2 Dd)V CL3(4);( 5)where:V volume of the log in cubic feet;C 0.005454 (unit conversion factor);L length of the log in feet;D average diameter outside bark for the large end of the log in inches; andd average diameter outside bark for the small end of the log in inches.The end area of the log was used as the weighting factor to calculate a greendensity value for each log:(D)2 (K) (d)2(k)Average green density (D d) 222(6)where:K green density of the core measured at the large end of the log in pounds per cubicfoot (Ib/ft3); andk green density of the core measured at the small end of the log in Ib/ft3.9
Figure 6 illustrates a typical Douglas-fir butt log with various dimensions anddensities. The calculated average green density for this particular log equals38.0 Ib/ft3. The volume multiplied by the weighted green density equals the calculated weight (6,881 Ib). Note that the bark is considered part of the gross woodvolume and receives an average density value equal to that calculated for thewood. Log weights were not calculated from densities by the wood disk technique because of insufficient sampling points along the bole of each tree.Figure 6—A technique for calculating log weights with theBergstrom xylodensimeter.Measurements:D1 longest diameter (DOB) 50 inches.D2 shortest diameter (DOB) 40 inches.Average diameter (D) 45 inches.BT1 single bark thickness .2.5 inches.BT2 single bark thickness 2.25 inches.d1 longest diameter (DOB) 45 inches.d2 shortest diameter (DOB) 40 inches.Average diameter (d) 42.5 inchesIOS 1 inches of sapwood (large end of the log) 2.25 inches.Percentage of sapvyood (see eq, 1) 21.3Density reading of the large end 39 Ib/ftlOS 2 inches of sapyvood (small end of the jog) 2 inches.Percentage of sapwood 20.3Density reading of the small end 37 Ib/ft10
Calculations:2Average density of the log 2(45) (39) (42.5) (37) 38.09 lb/ft32L log lengthVolume (eq. 2)2[(45 42.5)/2] 17.8 feet.22 (0.005454)(17.8) [(0.25)(45) (0.75)(42.5) ]3 180.66 ft .Calculated weight33of the log (180.66 ft ) (38.09 Ib/ft ) 6,881 Ib.Measuring Log Weights(Lifted Weights) andComparing Them WithCalculated Weights(1981 Sample)Each log was weighed by use of a load cell attached to a front-end loader.Weights of logs lifted by the load cell were compared with calculated weights interms of bias and absolute error.Calculating Bole WeightsFrom Densities MeasuredWith the Xylodensimeter(1982 Sample)Sample trees of both species were divided into two random subsamples of 25 treesfor model construction measurements and for model validation purposes (20-acreplot only). After felling, each tree was partitioned into a lower section (approximately one-third of the merchantable height) and an upper section (the remainingbole). The merchantable height was to a 6-inch top (DIB). Diameter outside bark(DOB) and bark thickness were measured in the lower section every 3 feet fromthe stump; DOB was measured with a diameter tape or steel calipers, and barkwas measured with a steel ruler after it was chopped. An increment core was extracted every 6 feet and a modified Bergstrom xylodensimeter (fig. 1) was used todetermine density of the extracted cores. This procedure produced a successionof diameter and density readings for the bole.Volumes were calculated by the Smalian rule (eq. 4) for each 3-foot subsectionand were converted to green weight by multiplying the values by an appropriategreen density. The weights of all the 6-foot subsections were totaled for the weightof the lower bole.The upper section of the merchantable bole was divided into eight equal subsections. Diameters outside bark and bark thickness were measured at each division. Increment cores were extracted for measurement of density at the fourth andsixth diameter locations (fig. 7).The volumes of the upper subsections were calculated by Newton's formula(Dilworth 1981):(d2 4M2 D2)V CL;( 7)6where:M diameter outside bark for the middle of the log in inches.Because green density was not measured for each corresponding volume calculation (subsection), green density values were interpolated by calculating the changein green density as a function of length between actual density measurements(fig. 7). In the extreme upper bole, the green density at the sixth diameter locationwas used for the remaining subsection(s). The weights for each subsection wereadded to produce the weight for the upper bole. The lower and upper sectionswere then added together to determine the calculated bole weight.11
Figure 7.—Calculation of bole weights.Lower bole:22(D d )Volume, Smalian (V I ) CL -—-—2Weight of a subsection (W i) (Vi)(ki).Weight of the lower bole Upper bole:Interpolated green density (A 1) k6 (k7 - k6)(D2 4M2 d2)Volume, Newton (V 1 ) 6(C) (L 2 ) .Weight of a subsection (W 1 ) (V 1 )(A 1 ).Weight of the upper bole Where:D diameter outside bark, large end.M diameter outside bark, middle.d diameter outside bark, small end.C 0.005454.L length of segment.L i length in feet, i 1, 2, ., n.k i measured green density; i 1, 2,., n.A i - interpolated green density; i 1,2,., n .Ae extrapolated green density; e 5, 612(Li).L3
Measuring Lifted Weightsand Comparing ThemWith Calculated BoleWeights (1982 Sample)Logs from the lower and upper sections were weighed by use of a load cellattached to a front-end loader. The bias and absolute error were computed tocompare the calculated weight of the entire bole with the lifted weight. The procedure provides the means to investigate weight relationships for single logs,groups of logs, and entire boles.The Development andValidation of BolePrediction Equations(1982 Sample)For both Douglas-fir and western hemlock, calculated bole weight (calculatedvolume multiplied by the measured green density is the dependent variable) wasregressed against DBH and total tree height (the independent variables) to produce weight prediction models. The validation subsamples and additional offsitesamples provided an indication of bias and absolute error for the calculated boleweight equations.ResultsTable 2 shows the comparison of green densities derived from the wood disktechniques with green densities from the xylodensimeter. The estimates of greendensity were similar to those of the wood disk technique. The bias was negligible,and the absolute error was within 8 percent for all positions along the bole.Comparison of theWood Disk TechniqueWith the XylodensimeterTechniqueTable 2—Comparison of the wood disk technique with the xylodensimetertechnique, 1981 sample logs1/ Numoer of paired samples.2/ Volumetricaily weighted green wood (sapwood heartwood) densities.3/ Bias is the mean of the differences between the disk and thexylodensimeter densities.4/ Bias divided by wood disk mean multiplied by 100.5/ Accuracy measure; the mean of the absolute differences between the diskand the xylodensimeter densities.6/ Mean absolute difference divided by wood disk mean multiplied by 100.13
Comparison of Liftedand CalculatedLog WeightsTable 3 shows the comparison of calculated weights derived from an averagedensity applied to an appropriate volume formula with lifted weights measured bya load cell. The bias was slightly negative for both species and all log positions.The absolute error was under 9 percent.Table 3—Lifted weights and calculated weights, 1981 sample logs1/ Number of paired samples.2/ Measured with a load cell.3/ Calculated with a xylodenismeter density and cubic volume formula.4/ Bias Is the mean of the differences between the lifted and the calculated weights.5/ Bias divided by mean lifted weight multiplied by 100.6/ Accuracy Measure; the mean of the absolute differences between the lifted and the calculatedweights.7/ Mean absolute difference divided by mean lifted weight multiplied by 100.Evaluation of WeightPrediction Equations14Table 4 summarizes the regression equations developed from the calculatedweights. Total tree height was not a significant variable (F-test) for Douglas-fir.Equations for the calculated weights were used in predicting weights for wholeboles of the 25 validation trees (table 5). By use of the same equations, boleweights for trees felled and bucked in 1981 from the three 5-acre plots were alsopredicted. With the exception of plot 3, the bias and absolute error of the prediction models remained within 20 percent. The large error in plot 3 was presumablydue to the small size of the trees. Note the lower mean lifted weights for plot 3compared with the other plots in table 5. This difference may be indirectly theresult of the biological and physical factors of the site or a change; in greendensity with time from 1981 to 1982 or both. Because of the lack of specific siteinformation (for example, soil type, water-holding capacity), conclusions regardinginfluence of the site require further research.
Table 4—Calculated weight prediction equations, 1982 sample1/ W green weight of the bole in pounds; exp 2.7183 to the power enclosed in parentheses; In natural logarithm; D6H diameter at breast height in inches; HT totalheight of the tree in feet.2/ Coefficient of determination.3/ For logarithmic functions, the mean square error of the residuals was calculated asthe sum of the predicted minus the sum of the observed divided by the degrees offreedom, transformed to arithmetic units.4/ The mean square error of residuals from transformed data divided by 2 was added tothe intercept regression coefficient to correct for transformation bias (Baskerville1972).Table 5—Bias and accuracy evaluation of bole weight, 1982 samples1/ Observations used to build the regression equations. The equations were singlepredictor models (DBH) developed from the calculated weights. The western hemlock equationis weight (lb) exp(l.794 2.315(1 n(OBH)) and the Douglas-fir equation Is weight (1b) expd.594 2.292(In (DBH)). Validation trees were used to test the accuracy and bias of theequations. Model trees and validation trees are from plot 4 and were sampled in the summerof 1982. Trees in plots 1 to 3 are from 3 different areas measured in the summer of 1961.2/ Number of paired samples.3/ Measured with a load cell.4/ Calculated with a xylodensimeter.5/ Bias 1s the mean of the differences between the lifted and the calculated weights.6/ Bias divided by mean lifted weight multiplied by 100.7/ Accuracy measure; the mean of the absolute differences between the lifted and thecalculated weights.8/ Mean absolute difference divided by mean lifted weight multiplied by 100.15
DiscussionThis study examines two phases of weight estimation for heavy-lift logging: greendensity measurement and model development. The first phase (1981) comparestwo techniques for measuring green density of wood, the Bergstrom xylodensimeter and the standard wood disk technique (table 2). The absolute error betweenthe two techniques ranged from about 3 pounds per cubic foot in the butt logs tojust over 2 pounds per cubic foot in the crown logs for old-growth Douglas-fir.The absolute error was higher for western hemlock; the butt logs were slightlyunder 4 pounds per cubic foot, the crown logs just over 4 pounds. The bias wasnegligible for both species and all bole positions.Qualitative differences also exist between the two techniques. The primary advantage of the disk method is the ability to measure green density for individualstructural components such as sapwood, heartwood, and bark. Dry density, greendensity, and moisture content may be considered separately for each sampledisk. In addition, variation around the circumference of the bole is taken intoaccount when the samples within a single disk are averaged. This may explain, inpart, the observed absolute error between the two techniques. The disadvantagesof the wood disk method include the high costs of sampling because of the timeand labor needed for each measurement, the requirement of a laboratory withexpensive scales and ovens, the destruction of the bole for each sample tree, andthe inability to record density measurements directly in the field.The attractive qualitative feature of the xylodensimeter technique is the ability tomeasure the green density of a log with the appropriate ratios of sapwood andheartwood contained in the sample. The method is not labor intensive andmaterials are inexpensive. Furthermore, numerous measurements can be takenrelatively fast along the length of the bole. The readings are recorded directly inthe field, and the technique is not as destructive to the bole as is the disk method.The principal disadvantage of this technique is the limited amount of informationobtained per observation. The increment core is quite small in proportion to thesize of the log; for example, an increment core with a diameter of 0.169 inch and alength of 6 inches has a volume equal to 0.000078 cubic foot. The sample corevolume from the butt log in figure 6 is only equal to 0.00004 percent of the logvolume. In addition, unless increment cores are taken around the bole at eachheight, the circumferential variation in density is not considered
The Bergstrom xylodensimeter1/ was designed to estimate the green density of wood in the field. Bergstrom developed the device after observing partially sub-merged logs in a millpond. He noted that logs with similar dimensions float at varying depths, presumably because of differences in green density. After