Transcription
Proceedings of the International Conference on Industrial & Mechanical Engineering and Operations ManagementDhaka, Bangladesh, December 26-27, 2021Quality Improvement of a Garment Industry in Myanmarusing Total Quality Management ToolsSu Nandar Hlaing and Aung Myo LwinDepartment of Mechanical Engineering,Yangon Technological UniversityYangon, Myanmarsuapril3490@gmail.com, amlaml27@gmail.comAbstractMyanmar's garment industry is one of the most important sectors for sustainable development and creates anumber of formal jobs for women. The Myanmar Garment Manufacturers Association estimates that its nearly 600member factories employ approximately 500,000 workers. The combination of inexpensive labour and strictadherence to product quality are two important factors that make Myanmar an attractive place to outsource for garmentproducts. Profitability of the garment industry depends on the productivity and quality improvement. Therefore, thequality improvement is vital in a garment industry. This paper is about the study on the quality of puffer jacketproduction in Zhejiang Clothing Co., Ltd. The main aim of this paper is to improve the product quality using totalquality management (TQM) tools (Check sheet, Histogram, Pareto chart, cause and effect diagram). Case studymethodology was applied step-by-step procedure. Data Collection and observation were done in the selectedproduction line where the most defects were found. Then the TQM tools were applied to reduce the defects for theproduct quality improvement. After applying the proposed methodology, the Defect per hundred-unit (DHU)percentages were compared in terms of initial and final states and it was analyzed that there was a 66.762% decreasein Defect per hundred unit (DHU). These observations indicate that an industry can achieve increase productivity byimproving quality constraints by minimizing rework activities.KeywordsQuality improvement, Defect, TQM tools, DHU, Rework activities.1. IntroductionMyanmar’s garment industry has established itself as an important engine for sustainable development.Myanmar has received orders from international retailers such as Adidas, Gap, H&M and Marks & Spencer. Leadingthe country’s manufactured goods export sector, Myanmar’s apparel exports increased from US 349 million in 2010to almost US 4.6 billion in 2018, which represents about 10 percent of export earnings of the country. The countrymainly exports CMP (Cut-Make-Pack) products to Japan, followed by several European countries, South Korea, theUSA and China. According to the government data, roughly 65 percent of the total investment companies in the sectoris China. The Myanmar Garment Manufacturers Association estimates that its nearly 600 members factories providejobs for approximately 500,000 workers. The majority of these workers are young women, so empowering them isvery important. Production line efficiency is lower than the competitors in neighboring ASEAN nations. Garmentindustries in Myanmar are facing low productivity, long production lead-time, and low salary. Quality improvementand productivity are very important factors of garment manufacturing industry in competitive market environment.Garment Industries are always trying to improve their production and quality. There are many ways to improve thequality and productivity in garment industry [1].Quality improvement (QI) is the framework used to systematically improve processes and systems [2].Quality improvement is a systematic approach to avoid or reduce rework, rejects and losses in the production process.Quality improvement aims to create efficiency and meet customer needs. There are 9 steps to quality improvement,namely (i) List and prioritize improvement opportunities (ii) Define improvement goals (iii) Define requirements (iv)Collect and organize data (v) Select causes (vi) Generate possible solutions (vii) Select best solutions (viii) Implementthe solution and evaluate the results (ix) Continue searching [3]. Total Quality Management (TQM) is an ongoingprocess for identifying and reducing or eliminating manufacturing defects, streamlining supply chain management,improving the customer experience, and ensuring employees get training quickly. This approach focuses on exceedingcustomer expectations, identifying problems, building engagement, and promoting open decision-making among IEOM Society International267
Proceedings of the International Conference on Industrial & Mechanical Engineering and Operations ManagementDhaka, Bangladesh, December 26-27, 2021employees. And then, the focus of total quality management is to improve the quality of an organization's outputs,including goods and services, through the continual improvement of internal practices. Total Quality Managementaims to hold all parties involved in the production process responsible for the overall quality of the end product orservice. There are many key principles of TQM. They are customer orientation, employee engagement, processcentered, integrated system, strategic and systematic approach, fact-based decision-making, communication andcontinuous improvement [4]. There are eight principals of total quality management, Customer focus, Leadership,Involvement of People, Process Approach, System approach to management, continuous Improvement, Factualapproach to decision Making and Manual beneficial supplier relationship. There are seven basic techniques of totalquality management. These are (i) flow chart (ii) Histogram (iii) cause-and-effect diagram (iv) check sheet (v) scatterdiagram (vi) control chart (vii) pareto chart [5]. This study will emphasize on check sheet, histogram, pareto chart,cause and effect diagram for the quality improvement. The contribution of this paper is how to apply TQM tools forthe quality improvement of garment production line. The paper will be provided empirical solutions of puffer jacketproduction line of Zhejiang Clothing Co., Ltd. for the quality improvement. The factory can expand to other productionlines for the quality improvement.2. Literature ReviewQuality is fitness for use and conformance to specifications and producing the very best products andexcellence in products and services. Quality is totally a customer satisfaction and exceeding customer expectations.Quality may be thought to have two main divisions: the quality of a manufactured product and the quality of servicereceived. From a manufacturing standpoint quality is simply a conformance to specifications. The ultimate customercould describe quality as fitness for use.Quality improvement is to change or to get rid of parts of the process that do not work well. MD FaisalHanif, Halima Tus Sadia and Mehedi Hasan Chain (2020) studied the quality improvement in readymade garmentsindustry by traffic light system. The study focuses on high quality products at minimum cost. Reducing such wastecan be a profitable option for the manufacture as well as buyers. A traffic light system was implemented to minimizethe defect rates of production. That study shows that the average error rate drops from 4.13 to 1.25 pieces with eighthours of daily production. The main purpose is to raise the quality and production saving lead-time and makes betterthe supply chain performance [6]. M.M. Rahman and A.K.M. Masud et.al studied the quality improvement in garmentsindustry through TQM Approach. The study focuses on the improvement quality and reduces manufacturing cost byreducing rework and scrape. TQM methods are widely used in the RMG area. Several implementations have proventhat the TQM approach actually works in practice and in some situations even increases quality levels by 90% ormore. The RMG sector is a large industrial sector in Bangladesh, Quality improvement can play an important role inincreasing productivity as well as the economic development of the country. The main purpose of this study is toimprove the product and process quality by using the TQM tools, which can give remarkable improvement by reducingdefect. The objective of this research is to identify the basic pillars required to implement TQM in practice and toimprove the quality of a garment industry of Bangladesh by implementing TQM approach. The methodology of thisresearch is firstly, an extensive literature review conducted to identify the pillars required to implement TQM inpractice. Secondly, conduct an analysis of product to find the current status [7]. A.M Amirul studied that QualityManagement System in Garment Manufacturing. The study focuses on customer requirement and satisfaction throughcombine effort of the whole organization management by setting up a work standard. The main aim is to meet buyerrequirements and improve its effectiveness and efficiency on a continuous basis quality control and improvement.Mazharul Islam Kiron studied the Quality control system in Garment industry. The main aim of this paper is tounderstand, establish & accept the customer’s quality requirements. The objective of this paper is to maximize theproduction of goods within the specified tolerances correctly the first time and to achieve a satisfactory design of thefabric or garment in relation to the level of choice in design, styles, colours, suitability of components and fitness ofproduct for the market [8]. Mohammad Faizur Rahman and G.A. Chowdhury studied the Quality Management inGarment Industry of Bangladesh. The study focuses on the product quality calculation in term of quality and standardof fibers, yarns, fabric construction, color fatness, designs and the final finished garments. 5 S (Sort, set in order,Shine, Standardize, Sustain), DWM (Daily Work Management) and Six Sigma were used in this paper [9]. AemonSaleem studied the quality management system in garment industry. The paper is focused on the ensuring efficiencyand perfection in all processes ranging from product design and development to selling and after-sales service. Theobjective of this research is to make sure that the customers get the best quality product and can attain the maximumutility from buying that product. This research uses the quality management system that is a series of interdependentand interlinked techniques that aim at achieving the maximum level of satisfaction [10]. Nitesh Sahoo studied theefficiency improvement by reducing rework and rejection on the shop floor. The paper is focus on the qualityimprovement of garment industry by applying the quality tools such as checklist, cause and effect diagram and traffic IEOM Society International268
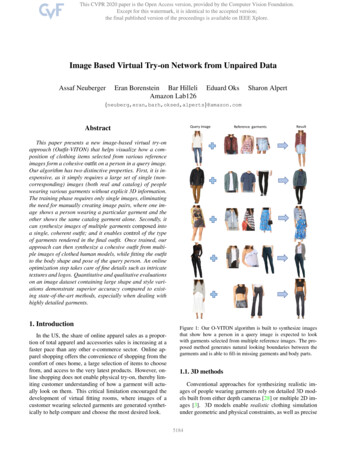
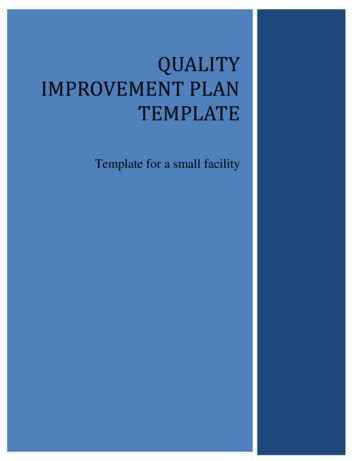
Proceedings of the International Conference on Industrial & Mechanical Engineering and Operations ManagementDhaka, Bangladesh, December 26-27, 2021light system. The purpose of this research is to reduce the reworks rate with improved quality by eliminating theloopholes of quality and provide the guidelines to control the rejection and rework through reduction of defect ingarment industry by identifying the root causes and traffic light system. [11]3. Research MethodologyIn this study, quality management system tools are applied to improve the quality. Among the seven-qualitycontrol tools, check sheet, histogram, pareto chart, cause and effect diagram were applied for the quality improvement.Methodology is considered a step-by step procedure as shown in Figure 1. Firstly, the existing literatures werereviewed and the ideas were developed for quality improvement. After that the ideas were gathered to apply for thequality improvement. And then the puffer jacket production line of the garment factory was selected for this researchwork. The defective data were collected using the check sheet. After that the histogram was drawn to determine thehierarchical defect and the pareto chart was drawn to show the cumulative defect frequency and determine how manydefective factors have to be analyzed for the targeted improvement. And then cause and effect diagrams were drawnto analyze the root causes of the problems. Finally, the root causes of the problems were solved and the product qualitywas improved.Review the LiteratureDevelop the ideaGather the ideasSelect the production lineCollect defective data using check sheetDraw the histogramDraw the pareto chartDraw cause and effect diagramSolve the root causeImprove the product qualityFigure 1. Research Methodology Flow Chart.4. Data Collection and ObservationsOne of the garment factories from Myanmar was selected for the practical implementation of this researchwork. It has 35 sewing lines and 2729 workers and it is located in Shwe Lin Pan Industrial Zone, Hlaing Thar YarTownship, in Yangon. For this research work, the puffer jacket production line was selected. There are about 24operations in the research product. The defect data of the puffer jacket was collected with the check sheet according IEOM Society International269
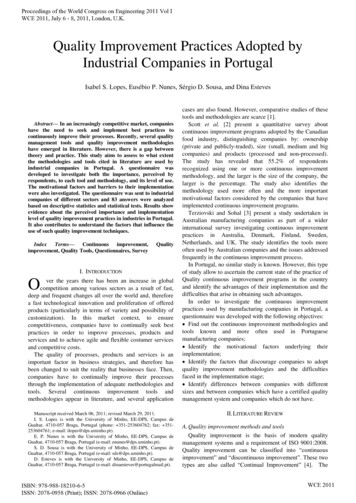
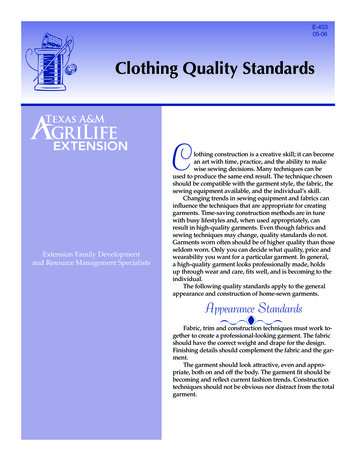
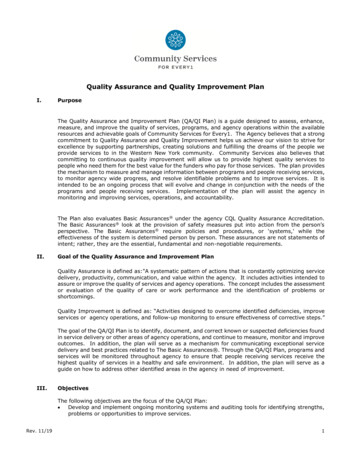
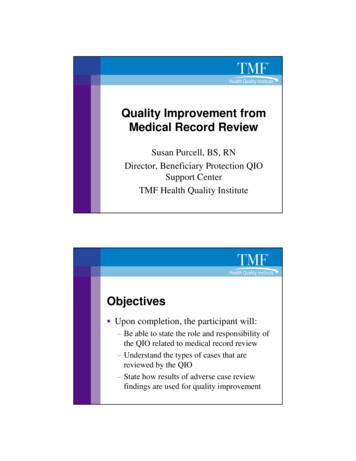
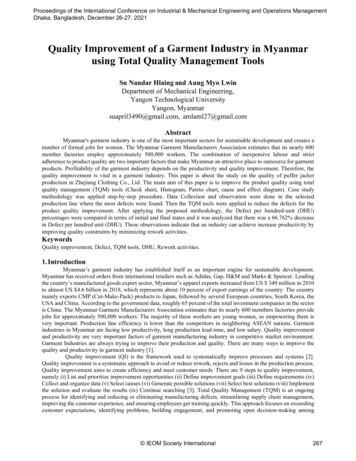
Proceedings of the International Conference on Industrial & Mechanical Engineering and Operations ManagementDhaka, Bangladesh, December 26-27, 2021to the defective categories. There are nine defective categories as shown in Table 1. The ten days defect data wascollected in the selected production line. The check sheet, also known as the “Disability Concentration Diagram”, isbasically a data collection sheet. By using check sheet, the frequency of defects and the defect per hundred unit (DHU)of these ten days were calculated. After using the check sheet, the number of defect and the defect categories wereused to draw the histogram to know the hierarchical defect as shown in Figure 2. A histogram is a bar graph with ameasurement scale on one axis and a frequency or percentage scale on the other. The histogram is a picture of afrequency distribution and is generally used to show the distribution pattern of a large sample of data. The histogramis based on the defect categories and number of defects. After drawing the histogram, the number of defect andcumulated defect percentage were calculated to draw the pareto chart as shown in Table 2. A Pareto chart is a barchart that ranks problems in descending order of frequency. It uses the pareto principle the idea that by doing 20% ofwork, 80 % of the advantage of doing the entire job can be generated. In term of quality improvement, a large majorityof problems (80%) are produced by a cause few key causes (20%). According to the pareto chart as shown in Figure3, 40% of defects come from the two defective factors which are the low and high edge of the collar is not equal andthe placket size on the collar is not equal. So, these two defective factors were analyzed by using cause and effectdiagram to identify the root cause of the problems as shown in Figure 4 and Figure 5. Cause and Effect diagram is achart that identifies the potential causes for quality problems. This chart is often known as the fishbone diagram. Thepotential causes are related to method, environment, manpower, machine and material. The root causes of the problemsof two defective factors were identified and took corrective action to solve the root cause as shown in Table 3 andTable 4. After solving the root causes, DHU were decreased.Table 1. The Check Sheet for Data collection(From 1.9.2021 to 11.9.2021) (defect categories of Puffer jacket)NoDefect categoriesDays1234Total5671The Placket size on the collar is notequal11963432The low and high edge of the collaris not equal10964223The Zipper contort54Vacate the piping5The thread skips of hood stitch6The two-pocket size on each otheris not equal7The hemline contorts78The mouth of the pocket causes thegap59Fitting the inverse of the label23563824Inspection100Passed6276Defect 11918110110899161142417%101219%93254Total 9210310510811016%16%14%13%10% IEOM Society International8%270
Proceedings of the International Conference on Industrial & Mechanical Engineering and Operations ManagementDhaka, Bangladesh, December 26-27, 2021Number of defectsThe histogram for knowing the hierarchical defect4540353025201510503937defect frequency2521201814126The LowTheTheThe mouth The two Fitting the The thread The zipper vacate theand high placket size hemlineof the pocket size inverse of skip ofcontortpipingedge of the on thecontortpocketon each the labelhoodcollar is collar is notcauses the other is nottopstitchnot equalequalgapequalDefect categoriesFigure 2. The Histogram for knowing the hierarchical defectTable 2. The Calculation for drawing the Pareto ChartNoDefect categoriesDefectFrequencyPercentage of allshirtCumulative %1The low and high edge of the collar is not equal3920.31%20.31%2The placket size on the collar is not equal3719.27%39.58%3The hemline contorts2513.02%52.6%4The mouth of the pocket causes the gap2110.94%63.54%5The two-pocket size on each other is not equal2010.42%73.96%6Fitting the inverse of the label189.38%83.34%7The thread skips of hood topstitch147.29%90.63%8The Zipper contort126.25%96.88%9Vacate the piping63.13%100%192100%Total IEOM Society International271
Proceedings of the International Conference on Industrial & Mechanical Engineering and Operations ManagementDhaka, Bangladesh, December 26-27, 202145403530252015105039defect frequency3739.58% 25 52.60% 63.54%20.31%2173.96%2083.34%1896.88%90.63%1412The lowTheTheTheThe two Fitting the Theand high placket hemline mouth of pocket inverse of threadedge of size on contort the pocket size on the label skip ofthe collar the collarcauses the each otherhoodis notis notgapis nottopstitchequalequalequalDefect Categories100%6TheVacatezipper the pipingcontort120%100%80%60%40%20%0%Cummulative percentageThe Number of defectThe pareto chart showing the number of defect and cumulative percentageFigure 3. The Pareto Chart Showing the number of defect and the cumulative Percentage for 10 daysEnvironmentMethodMan ack of skillLack of TrainingRecklessnessThe low and high edge ofthe collar is not equalMachinebreakdowFabric typeHigh SpeedMachineMaterialFigure 4. The Cause-and-effect Diagram for the low and high edge of the collar is not equal defective factor IEOM Society International272
Proceedings of the International Conference on Industrial & Mechanical Engineering and Operations ManagementDhaka, Bangladesh, December 26-27, 2021CausesTable 3. The Solution of low and high edge of the collar is not equal defective factorAction Taken /ImplementationMan PowerFactory provides the necessary training to operators such as material handling to improve the skill.MethodThe body of the jacket is fold equally and made the proper marking. The neck of the collar is folded equally andmarked proper marking. Then stitch the coincidence marking line of the jacket’s body and the neck of the collar.MachineMaintenance workers adjust the speed of machine according to the operation and fabric. The machine ismaintained regularly.Factory selects the good quality of fabric and inspects the fabric quality carefully.Workplace must have sufficient light. The Supervisor should notice the operator and helper to work in theworkplace quietly and handle the disturbances.MaterialEnvironmentEnvironmentMan PowerMethodInsufficientLightImpropermarkingLack of skillIrregularthreadstitchingNoisyLack of TrainingDisturbanceThe placket size on thecollar is not erialFigure 5. Cause and effect diagram for the placket size on the collar is not equal defective factorCausesMan PowerMachineMethodTable 4. The Solution of the placket size on the collar is not equal defective factorAction TakenFactory provides the necessary training to operator to improve the skill.Maintenance department repairs the damage machine parts regularly and install the right needle.Operator put the pattern on the placket and makes the marking.MaterialFactory selects the good quality thread, which is free from flaws.EnvironmentThe bulbs are needed to assemble in the working place. The supervisor should notice the operator and helper towork in the workplace quietly and handle the disturbances. IEOM Society International273
Proceedings of the International Conference on Industrial & Mechanical Engineering and Operations ManagementDhaka, Bangladesh, December 26-27, 20215. Results and DiscussionThe defect per hundred-unit (DHU) percentages for the initial state is 17.143. After taking the action for thequality improvement, DHU is decreased to 5.698. According to the ten days defect data after taking the correctiveaction, the defect frequency of the low and high edge of collar is not equal is decreased from 39 to 0. Then, the defectfrequency of the placket size on the collar is not equal is decreased from 37 to 19. The other defective factors that are14 defect frequency of the hemline contorts, 19 defect frequency of the sticker missing and 20 defect frequency of thesleeve turning point is not correct become the highest defect frequency. So, quality improvement procedures have tobe done again to continue quality improvement. The decrease percentage of defect after using quality control tools is66.762%. The defect rates are decreased significantly and the productivity and line efficiency also are increased.6. ConclusionThe paper is focused on the quality improvement in readymade garment industry by using the total qualitymanagement tools. Total Quality Management (TQM) is also referred to as total productive maintenance and is theapproach of the management to achieve long-term success by focusing on customer satisfaction and then theorganization works towards a steady improvement in the quality at all stages of production. By focusing on customer,the organization could not survive without continuous improvement in their product quality and process in today’scompetitive market. The profitability of the industry largely depends on the quality imporvement. The percent decreaseof DHU was 66.762% if intial state and final state are compared. The producitity and line efficiency are increased.After applying the quality control tools in the quality improvement of garment production line, it will improve notonly for the product quality but also the productivity of the industry. This study shows that the quality improvementcan be achieved by reducing the defect and rework times.AcknowledgementsThe author would like to express her special thanks to Dr Aung Myo Lwin, Associate professor, YangonTechnology University, Mechanical Engineering Department, for his useful suggestion and technical guidance.Moreover, the author would like to thank all teachers from the Mechanical Engineering Department for their support,encouragement, useful suggestions, invaluable guidance and help till the completion of this research. Moreover, theauthor would like to express her special thanks to all staff and workers in Zhejiang Closing Company Limited,Myanmar, for providing their data information throughout this research.References[1] Thomas, J., Revamping Myanmar’s Garment Industry, Available: -garment-industry, July 19, 2019.[2] Schwartz, C., What is quality improvement, anyway? Available: https:// www.saskhealth.ca/ blog/ what is qualityimprovement- anyway, May 31 2021.[3] Anonymous., nine steps used in quality improvement, Available: http://www.realiasmedia.com/ articles/48423-9steps-used-in-quality improvement, December 1,1997.[4] Barone,A. Anderson, S., Perez, Y., Total Quality Management, Available: http;//www. Investopedia.com/terms/t/total- quality-management-tqm.asp, August 29, 2021.[5] Kobiruzzaman,M.M., Business Communication, Communication types, Corporate Communication, Available:https:// www.google.com/ search? client Firefox-b- &q 8 principal of total quality management, Sep 12,2020[6] Hanif ,M.D.F., Halima, T.S., Quality Improvement in Readymade Garments Industry by Traffic Light System ,Journal of Textile Engineering & Fashion Technology, volume 6, pp. 90-93,2020.[7] Radhman, M.M., Masud, A.K.M., Quality Improvement In Garments Industry Through TQM Approach ,Proceedings of the International Conference on Mechanical Engineering, Dhaka, Bangladesh December 18-20, 2011[8] Kiron M.I, Quality Control System in Garment Industry, Quality control system in Apparel Industry, Qualitycontrol system for Knitted Garment Industry, Avaliable: in-garmentsindustry, January 4, 2021[9] Rahman, M.F., Baral,L. M., Mannan,M.d.A., Khan,A.N.,Quality Management in Garment Industry of Banglash,Avaliable: , june 2009[10]Saleem,A.,Quality Managemen System in Garment Industry, Avaliable: https://www.scribd.com/document /405071738/ Quality-Managment-System-in-Garment-Industry, April 5, 2019.[11] Sahoo,N.K., Efficiency improvement by reducing rework and reduction on the Shoop floor, International Journalof Enginnering Research & Technology, June 2020, vol.9,no.6,pp. 1185-1191,2020. IEOM Society International274
Proceedings of the International Conference on Industrial & Mechanical Engineering and Operations ManagementDhaka, Bangladesh, December 26-27, 2021BiographiesSu Nandar Hlaing is an assistant Lecturer in the Mechanical Engineering Department of Myingyan GovernmentTechnology College. She also is an enthusiatic educator of industrial management. She is preaparing for Ph.D degreewith the title of “ Analysis and Improvement of Quality Management Systems of Garment Factories in Myanmar” inindustrial field at Mechanical Engineering Department of Yangon Technological University. She has got the Masterof Engineering in Mechanical from Yangon Technological University and a Bachelor of Engineering in Mechanicalfrom Pakokku Technological University. She has published conference papers.Aung Myo Lwin is an Associate Professor in Mechanical Engineering Department of Yangon TechnologicalUniversity, Myanmar. He also is an enthusiastic educator of Logistics and Supply Chain Management. His researchand teaching interests are logistics and supply chain management and industrial management. He has authored tenpapers that are tremendously effective to the industry he belongs. He is a faculty advisor of the MechanicalEngineering Students of Yangon Technological University. He worked as a trainer in the MYPOD project regardingproductivity, occupational health and safety and social dialogue improvement of ready-made garment industries inMyanmar. He holds a Ph.D. in Industrial and Manufacturing Engineering from Yangon Technological University, aMaster of Engineering in Logistics and Supply Chain Management from Sepuluh Nopember Institute of Technology,a Post Graduate Diploma in Hydrology from Indian Institute of Technology (Roorkee) and a Bachelor of Engineeringin Mechanical from Mandalay Technological University. IEOM Society International275
quality and productivity in garment industry [1]. Quality improvement (QI) is the framework used to systematically improve processes and systems [2]. Quality improvement is a systematic approach to avoid or reduce rework, rejects and losses in the production process. Quality improvement aims to create efficiency and meet customer needs.