Transcription
Investor PresentationQ1 2022TSX: DNTL
DisclaimerAny graphs, tables or other information demonstrating our historical performance or that of any other entity contained in this presentation are intended only to illustrate past performance and are not necessarily indicative of such entities’ future performance. Investors should not assume that the informationcontained in this presentation is accurate as of any date other than the date given, or where information is stated to be as of a date other than the date given, such other applicable date. Subject to our obligations under applicable Canadian securities laws, the information contained in this presentation isaccurate only as of the date of this presentation regardless of the time of delivery of this presentation. Unless otherwise indicated or the context otherwise requires, all references in this presentation to “dentalcorp”, the “Company”, “we”, “our”, “ours”, “us” or similar terms refer to dentalcorp Holdings Ltd.(formerly Dentalcorp Overbite Ltd.), together with its wholly-owned subsidiaries, dentalcorp Health Services Ltd. and DCC Health Services (Québec) Inc., as well as 100% of the accounts of certain other entities in which the Company does not hold an equity interest but which are consolidated by the Companyas a result of such other entities’ contractual relationships with the Company.Forward-Looking InformationThis presentation as well as oral statements made during the course of the oral presentation includes forward-looking information and forward-looking statements within the meaning of applicable Canadian securities legislation, including the Securities Act (Ontario) (collectively, “forward-looking statements”),which reflect management’s expectations regarding the Company’s future growth, results from operations (including, without limitation, future expansion and capital expenditures), performance (both operational and financial) and business prospects, future business plans and opportunities. Whereverpossible, words such as “plans”, “expects”, “scheduled”, “budgeted”, “projected”, “estimated”, “timeline”, “forecasts”, “anticipates”, “suggests”, “indicative”, “intend”, “guidance”, “outlook”, “potential”, “prospects”, “seek”, “strategy”, “targets” or “believes”, or variations of such words and phrases orstatements that certain future conditions, actions, events or results “will”, “may”, “could”, “would”, “should”, “might” or “can”, or negative or grammatical versions thereof, “be taken”, “occur”, “continue” or “be achieved”, and other similar expressions, have been used to identify forward looking statements.Such forward-looking information includes, but is not limited to, the forward-looking information related to the Canadian dental industry; addressable markets for our services; expectations regarding our revenue and our revenue generation potential; our business plans and strategies; and our competitiveposition in our industry.Forward-looking statements are necessarily based upon management’s perceptions of historical trends, current conditions and expected future developments, as well as a number of specific factors and assumptions that, while considered reasonable by management as of the date on which the statements aremade, are inherently subject to significant business, economic and competitive uncertainties and contingencies which could result in actions, events, conditions, results, performance or achievements to be materially different from those projected in the forward-looking statements. Such factors andassumptions include, but are not limited to, the Canadian dental industry; our ability to retain key personnel, our ability to maintain and expand geographic scope; our ability to execute on our business plans and strategies; our ability to obtain and maintain existing financing on acceptable terms; changes inlaws, rules, regulations and global standards; and the extent of the impact of COVID-19 on our operations and overall financial performance. While we consider these assumptions to be reasonable, many assumptions are based on factors and events that are not within our control and there is no assurance thatthey will prove to be correct.By their nature, forward-looking statements are subject to inherent risks and uncertainties that may be general or specific and which give rise to the possibility that expectations, forecasts, predictions, projections or conclusions will not prove to be accurate, that assumptions may not be correct and thatobjectives, strategic goals and priorities will not be achieved. Known and unknown risk factors, many of which are beyond the control of the Company, could cause actual results to differ materially from the forward-looking statements. Such risks include, but are not limited to, our potential inability tosuccessfully execute our growth strategy and complete additional acquisitions; our dependence on the integration and success of our acquired dental practices; the potential adverse effect of acquisitions on our operations; our dependence on the parties with which we have contractual arrangements andobligations; changes in relevant laws, governmental regulations and policy and the costs incurred in the course of complying with such changes; competition in the dental industry; increases in operating costs; the risk of difficulty complying with public company reporting obligations; and the risk of a failure ininternal controls.Although we have attempted to identify important factors that could cause actual actions, events, conditions, results, performance or achievements to differ materially from those described in forward-looking statements, there may be other factors that cause actions, events, conditions, results, performanceor achievements to differ from those anticipated, estimated or intended. There can be no assurance that forward-looking statements will prove to be accurate, as actual results and future events could differ materially from those anticipated in such statements. Forward-looking statements are provided for thepurpose of providing information about management’s expectations and plans relating to the future, as at the date they are provided. The Company disclaims any intention or obligation to update or revise any forward-looking statements whether as a result of new information, future events or otherwise, orto explain any material difference between subsequent actual events and such forward-looking statements, except to the extent required by applicable law. Accordingly, investors should not place undue reliance on forward-looking statements. All of the forward-looking statements are expressly qualified bythe foregoing cautionary statements.Presentation of Financial Information and Other InformationUnless otherwise specified, all references to “ ”, “dollars” or “Canadian dollars” are to Canadian dollars and references to “U.S. ” and “U.S. dollars” are to United States dollars. Amounts are stated in Canadian dollars unless otherwise indicated. Certain totals, subtotals and percentages throughout maynot precisely reconcile due to rounding.Non-IFRS and Other MeasuresThis presentation makes reference to certain non-IFRS and other financial measures. These measures are not recognized measures under IFRS and do not have a standardized meaning prescribed by IFRS and may not be comparable to similarly-titled measures reported by other companies. Accordingly, thesemeasures should not be considered in isolation nor as a substitute for analysis of our financial information reported under IFRS. Rather, these measures are provided as additional information to complement those IFRS measures by providing further understanding of our results of operations frommanagement’s perspective. The non-IFRS measures and industry metrics that we use include “Adjusted EBITDA”, “Adjusted EBITDA Margin”, “Adjusted free cash flow”, “adjusted net income (loss)”, “EBITDA”, “PF Adjusted EBITDA”, “PF Adjusted EBITDA Margin”, “PF Revenue”, “Practice-Level EBITDA”, “SamePractice Sales Growth”, and “Adjusted Same Practice Sales Growth”. For information on the most directly comparable IFRS measures, composition of the measures, a description of how we use these measures and an explanation of how these measures provide useful information to investors, refer to the“Non-IFRS and Other Measures” section of our management discussion and analysis as at and for the year ended March 31, 2022, available at on the Fund’s profile on SEDAR at www.sedar.com, which is incorporated by reference into this presentation.2
Our vision is to be Canada’s most trusted healthcare networkWe deliver the best patient experience and clinical outcomes through our network ofleading professionals, empowered by our unique technology, know-how and scaleHome to the verybest talent in theindustryPursuit of life-longlearning and skillsdevelopmentUnparalleled patientsafety cultureProprietary patienttechnology andengagement toolsUnwavering commitmentto our communities andthe next generation ofcliniciansExceptional care for Canadians3
Advancing the health and well-being of CanadiansINCREASE ACCESS TO ORAL CAREFOR CHILDREN AND VULNERABLECOMMUNITIES Commitment to pediatric dentistry,including more than 500kdonated to four of Canada’s largestchildren’s hospitalsSUPPORT THE NEXT GENERATIONOF CLINICIANSIMPROVE THEWELL-BEING OF CANADIANS More than 5 million donated Funding to develop world-leadingthrough academic partnerships Over 750k in tuitionreimbursementsdiagnostics and care standards toput Canada at the vanguard ofdental care Supporting causes dedicated to Over 2.8 million of free dentalraising the spirits and strength ofCanadian childrencare provided by the dentalcorpnetworkINCLUSION AND RESPONSIBILITY More than 51% of dentalcorpsenior management positions areheld by women High focus on corporateresponsibility - named one ofCanada's Best ManagedCompanies for eight consecutiveyears Embrace a culture of diversity,inclusion, and belonging to ensurea range of perspectives,experiences, and expertiseOUR VALUESWe make a differenceWe are oneWe are accountableWe innovateWe are courageous4
Clear market leader in 18 billion Canadian dental industryCanada’s #1 and only national provider covering approximately 77% of the entire populationDouble-digit growth every year in our historyCompelling financial profile with strong ROIC, high margins, low capex and working capital requirementsOver:1,500dentists1,800dental hygienists4,300 supporting team members 1.204 bn 234 mmLTM PF1.7 mmactive patients4.5 mmannual patient visits3.2 mmpatient chartsLocationCAGRLTM PF Adjusted EBITDA1545458445360345Supporting more 15175201622220172018201920202021Q1 2022Practices as at Year End1Non-IFRS financial measure, non-IFRS ratio or supplementary financial measure. See “Non-IFRS and Other Measures” section of this presentation and see "Overall Performance - Non-IFRS Measures" in the Company's Management Discussion and Analysis for the three months ended March 31,2022 which is incorporated by reference herein.5
Multi-pronged growth strategy12ORGANIC GROWTHACQUISITIVE GROWTH Drive new patientacquisition Increase frequency ofvisits Expand serviceofferings Practice acquisitionsto increase footprintacross Canada Patient chartacquisitions tomaximize practicelevel capacity3OPERATING PRODUCTIVITY Drive marginexpansion throughlabour and purchasingefficiencies andfully-scaled corporateinfrastructure4MARKET EXPANSION Expand into othergeographic regionsand private-payhealthcare verticals6
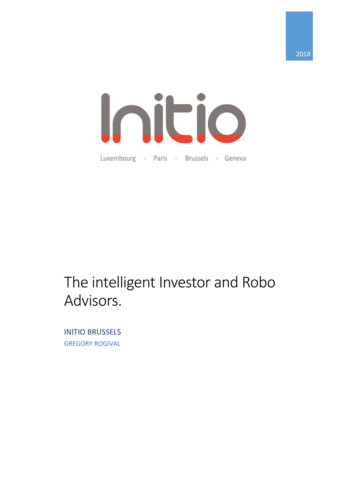
Dentistry is an essential healthcare service, insulated from economiccycles and disintermediation by technology 443CANADIAN DENTAL SERVICES EXPENDITURE PER CAPITA1 360Recessionary PeriodDental servicesexpenditure percapita growth hasoutpaced CPIin 7 of thelast 10 years, andin 38 of the last45 years'75 '76 '77 '78 '79 '80 '81 '82 '83 '84 '85 '86 '87 '88 '89 '90 '91 '92 '93 '94 '95 '96 '97 '98 '99 '00 '01 '02 '03 '04 '05 '06 '07 '08 '09 '10 '11 '12 '13 '14 '15 '16 '17 '18 '19CANADIAN ANNUAL AVERAGE CPI INFLATION2Period of High InflationDental services expenditure per capita has historically grown at an annual average rate of 11.8% during periods ofhigh inflation, outpacing CPI by 432bps7.5% annual avg. inflation'75 '76 '77 '78 '79 '80 '81 '82 '83 '84 '85 '86 '87 '88 '89 '90 '91 '92 '93 '94 '95 '96 '97 '98 '99 '00 '01 '02 '03 '04 '05 '06 '07 '08 '09 '10 '11 '12 '13 '14 '15 '16 '17 '18 '19Dental Services Expenditure per Capita Annual GrowthAnnual CPI InflationESSENTIAL HEALTHCARE FOR CANADIANS3Canadian Dental Associationrecommends dental visits at aminimum every 6 months1 CIHI. 80% of Canadians have aregular dentist 75% of Canadians see adentist every year 90% of Canadian childrensee a dentist every year 75% of Canadians havedental insuranceNational Health Care Spending 1975 - 2019.2 StatisticsCanada. Consumer Price Index, annual average 1975 - 2019, not seasonally adjusted.3 ”Essential Healthcare for Canadians” data is based on a market study delivered December 2017 commissioned by the Company from a third-party research firm.7
Positioned to sustain 10-year track record of double-digit growthINVESTMENT HIGHLIGHTSHigh-growthplatform with clearcompetitive moatsSector leadershipin recurring,non-discretionary careRepeatable acquisitionprogram driving attractiveeconomics at scaleProprietary technologyand playbooks driveattractive growth8
A highly recurring, unique cash-pay modelPrimarily directcash payLimited exposure to insurancecompanies or government payLimited days salesoutstandingPatients pay directlyat the time of serviceHigh-level of patientloyaltyDENTALCORP RECURRING Submit claim onbehalf of patientReimbursementPatient submits claimINSURANCE COMPANY1 Recurring visits refers to the percentage of patients visiting one of our practices in the relevant year who are returning patients that previously visited the same practice in prior years, based on historical visit data over the same timeperiod for a consistent cohort of 256 general practices owned by us at the end of 2019 in respect of which we have sufficiently detailed historical data to enable us to calculate recurring visits for each period presented.9
Significant tailwinds driving consolidationHEALTHCARE CONSUMERISMConsiderable resources to providepatients with a flexible,convenient and exceptional experiencePRACTITIONER SHIFT FROMINDEPENDENT PRACTICEAbility for independent practitionersto reduce administrative burdensINCREASING REGULATORY ANDADMINISTRATIVE COMPLEXITYScaled, technology-enabled platform toaddress the growing regulatory burdenDIGITAL ENHANCEMENTAbility to make significant investmentsin technology to drive operationalefficiencies and practice growth16Largest footprint and financial profileAttract morepractitioners, staffand patients5Best surveyed brand amongpractitioners with leadingreputation in the industry2Sophisticated corporateinfrastructure andtechnology platformADVANTAGE43Ecosystem where besttalent in dentistry thrivesIncreased patient attraction,retention and satisfactiondentalcorp’s scale and resources provide a clear value proposition forindependent operators to join a network of clinically and economically aligned practitioners10
Acquirer of choice for leading dentistsPROVEN VALUE PROPOSITION FOR ENTIRE MARKET OF CANADIAN DENTISTSUnburden administrativeresponsibilitiesClinical autonomySuccession planningEarning potentialMentorship, training anddevelopmentCompelling compensationProfessional supportNavigate increased healthcareconsumerismNetwork of like-mindedprofessionalsCanada’s home for the best talent in dentistry with over 90% dentist retention1 across dentalcorp network1 Representsmanagement’s estimate of the potential annual revenue lost due to dentists leaving the dentalcorp network. Departures are predominantly due to relocation, retirement or career change.11
dentalcorp helps partners to optimize clinical and financial outcomesDr. Scott MacLeanPartner since 2020Halifax,Nova Scotia80% reductionin time spent onadministrative tasksGrowth and developmentthrough clinical advancementprograms inperiodontics and implants15% reductionin consumables andequipment costsDalhousie University, DDS 1991“dentalcorp approaches dentistry in the best possible way looking after patients first.The reality is I can now do that better being a part of dentalcorp.” —Dr. MacLean12
Early stages of consolidating large addressable marketSignificant whitespace opportunity for expansion# of Locations andMarket Share194.0%INDEPENDENTPRACTICESdentalcorp500 3.3%Market ShareCompetitorsPeers 2-52-5 combined 400 2.7%Market ShareMarket leader with only 3.3% of totaladdressable marketdentalcorp is the clear partner of choice forleading dentists and is larger than the next fourcompetitors combinedDifferentiated model to address the entiremarketdentalcorp has greater market share1 than the next four competitors combined1 Marketshare based on number of practices.13
North American dental marketCanada TAM vs U.S. TAM1Canadian Dental MarketU.S. Dental MarketMARKET SIZE 18bn (C ) 180bn (C )NUMBER OFPRACTICES 15,000 136,00075%of the population70%of the populationVISIT DENTISTEACH YEARDSOs2DSOs 6.0%IndependentPractices 94.0%1 Source:Wall Street Research.demtalcorp and competitors 2-5 as described on previous slide2 Representing 30.0%IndependentPractices 70.0%14
Proven and repeatable acquisition program to consolidate a fragmented industry1ROBUST PIPELINE WITH 200 OPPORTUNITIES INMORE ADVANCED STAGES OF NEGOTIATION2ONE OF THE MOST ACQUISITIVE TEAMS INHEALTHCARE TODAYAcquired 174 mm in EBITDA and 290 locations since 2018 14,500 745 Practices in Canada notowned by dentalcorp 25 mm of acquired EBITDA in 2022Financial scale with fully automated, virtual integrationcapabilities to execute on acquisition planOpportunities in thecurrent pipelineACQUIRED ANNUAL PRACTICE-LEVEL EBITDA ( mm) 45 200 500Opportunities in moreadvanced stages ofnegotiationPractices currently ownedby dentalcorp 43 37 25 2420182019202020212022 YTD6742Locations Acquired64754215
Proven and repeatable playbook to drive organic growthACCELERATE GROWTH, FREQUENCY OFVISITS AND PROMOTE COMPREHENSIVE CAREOPPORTUNITIES TOEXPAND MARGINSEFFICIENCIES TO INCREASEOPERATING PRODUCTIVITYAttract new patients atexisting and newlyacquired locationsLabourExclusive technologyplatformsIncrease frequency ofvisitsProcurementProprietary playbooksExpansion of serviceofferings and capabilitiesacross the networkdentalcorp has significant upside remaining in its organic growth strategy16
Exclusive digital assets and playbooks drive patientgrowth and satisfactionTECHNOLOGY ENABLED PLATFORMPatient GrowthDRIVES ENHANCED PATIENT MANAGEMENT CAPABILITIESIntegrated communicationPatient insightsOnline directory and bookingTeledentistryEnhances customer retentionAND DRIVES CONSISTENT RESULTS1 Driven 1.2 mm in revenue in 2022; driven a total of 15.5mm since inception (March 2020)Practice Executionand Efficiencies 91% of reviews are 5-star Google reviews677,000 unique visitorsOver 2,400 Bookings per monthOver 2.5x increase in 5-star Google reviews per month5,300 bookings per month1Statistics are based on the quarter ending March 31, 2022 unless otherwise stated17
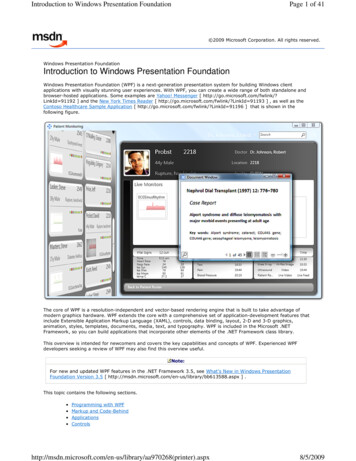
Long track record of driving double-digit growthPRACTICE GROWTH (Number of Practices)REVENUE AND PF REVENUE ( mm)CAGR1: 15.6%CAGR: 15.7%458500 1,204COVID-19 normalization 1,031397360PF Revenue (incl. annualization of acquisitions) 767 1,064– 881 215 666Dec 31, 2019Dec 31, 2020Dec 31, 2021Dec 31, 2019Mar 31, 2022Dec 31, 202012 months ended 100 14418.7% 50CAGR1: 12.6% 234 192 178 200 150PF Adjusted EBITDA (incl. annualization of acquisitions)COVID-19 normalization 250 19518.4% 6317.2% 11518.6%Dec 31, 2020Dec 31, 2021–Dec 31, 2019Mar 31, 2022ADJUSTED EBITDA AFTER RENT2 AND MARGIN ( mm)ADJUSTED EBITDA AND MARGIN ( mm; IFRS)CAGR1: 14.6%Dec 31, 202112 months ended12 months endedMar 31, D-19 normalization 250 196 200 150 156 150 120 100 50PF Adjusted EBITDA After Rent (incl. annualization of acquisitions) 157 6315.7% 8713.1%15.1%14.8%Dec 31, 2019Dec 31, 2020Dec 31, 2021Mar 31, 2022 040.0%35.0%30.0%25.0%20.0%15.0%10.0%5.0%0.0%12 months endedFor further discussion of how each of PF Revenue, Adjusted EBITDA, Adjusted EBITDA Margin, PF Adjusted EBITDA, PF Adjusted EBITDA after rent and PF Adjusted EBITDA Margin is calculated see "Overall Performance - Non-IFRS Measures" in the Company's Management Discussion and Analysis forthe three months ended March 31, 2021.1 Based2on Fiscal 2019 to 12 months ended March 31, 2022.PF Adjusted EBITDA after rent defined as PF Adjusted EBITDA less interest paid on leases and repayment of principal on leases.18
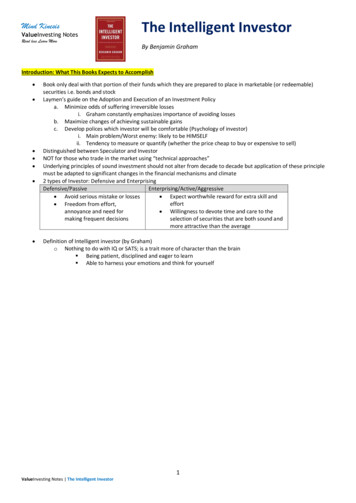
Consistent performance at scaleCompelling unit economics 2.4M2-4%Average Revenueper PracticeSame PracticeSales Growth122%1 Average PracticeEBITDA MarginSame Practice Sales Growth23.7%2.6%3.0%2.2%Adjusted EBITDA After Rent – Maintenance Capex, and Conversion %336.1%2.7%0.5%Adjusted EBITDA AfterRent - Capex ConversionSTRONG, PREDICTABLE CASH GENERATION ( mm)DRIVING ORGANIC GROWTH AT SCALE2.5% Average (based on 2015-LTM Feb 2020) 90% COVID normalization 22290.8% 172 122 10990.3%93.8%93.2%100.0% 142 146 14680.0%60.0% 6340.0% 722015201620172018(25.7%)2019 LTM Feb 2020 20212020 79 22( 28)12 months ended December 312019202020.0%2021Q1 2022–12 months endedCompelling financial profile with strong ROIC, high margins, low capex and working capital requirements1 Based2 Foron after rent figures (GAAP).additional information regarding Same Practice Sales Growth, see Management’s Discussion and Analysis of Financial Condition and Results of Operations for the three months ended Mar 31, 2022.3 Definedas (Adjusted EBITDA After Rent expense – Maintenance Capex) / Adjusted EBITDA After Rent expense.19
Investment highlights Clear market leader with the only national platform in the 18 billion Canadian dental industry Dentistry is a highly recurring, essential healthcare service, that is cash pay, insulated from economiccycles and disintermediation by technology Exclusive digital assets and clear value proposition position dentalcorp to capitalize on significantwhitespace opportunity Repeatable acquisition program, combined with proprietary technology and playbooks, equates to clearvisibility for sustained, double-digit growth Executive team with long-term economic alignment and an enviable track record of strongperformance at scale20
Appendix
Company senior leadershipGraham Rosenberg CEO & ChairmanFounded dentalcorp in 2011Serves on the Board of Directors of Northview Canadian High YieldResidential Fund and North York General Hospital FoundationCPA, Bachelor of Business Administration and MBA from SchulichSchool of Business in Toronto Guy Amini PresidentJoined dentalcorp in 2014Robust background in mergers and acquisitions, corporate financeand strategic commercial transactions.J.D. from the University of Toronto, Faculty of Law and HonoursBachelor of Business Administration from Wilfrid Laurier University Nate Tchaplia Chief Financial OfficerJoined dentalcorp in 2015Experienced financial professional having previously worked for aninternational advisory and consulting firm specializing in valuations,mergers & acquisitions and capital advisoryCPA and Bachelor of Commerce from McGill University Dr. Gary Glassman Chief Dental Officer Joined dentalcorp in 2016World-renowned Endodontist, full-time practicing dentist, global lecturerand on-staff at the University of Toronto, Faculty of DentistryGraduate of the University of Toronto, Faculty of Dentistry and theEndodontology Program at Temple UniversityMatthew Miclea Chief Operating Officer Joined dentalcorp in 2017Extensive experience driving operational improvement and excellence inmulti-unit retail and services organizations.Bachelor in Industrial Engineering and MBA from Northwestern UniversityNicola Deall Chief People Officer Joined dentalcorp in 2020Proven business leader with experience in high growth and large scale businessesacross financial services and media sectors, including organization development, HRconsulting, people strategy, talent acquisition, systems implementation and analytics.Bachelor of Business from the University of Technology Sydney.Martin Fecko Chief Marketing Officer Joined dentalcorp in 2021Extensive experience in consumer marketing, brand building, strategic planning, anddata-driven insights.Bachelor of Administrative Studies from York UniversityJeff Forbes Chief Technology Officer Joined dentalcorp in 2022Extensive experience in digital strategy and technology implementation,including end-to-end enterprise technology portfolio and other businessfacing applicationsBachelor of Information Systems specializing in ERP systems from St. FrancisXavier University
Board of DirectorsGraham Rosenberg CEO & Chairman Founded dentalcorp in 2011Serves on the Board of Directors of Northview Canadian High YieldResidential Fund and North York General Hospital FoundationCPA, Bachelor of Business Administration and MBA from SchulichSchool of Business in TorontoAndrew Taub Director Managing Partner at L Catterton with a focus on the Flagship Buyout FundDirector of several L Catterton portfolio companies, including JustFoodForDogs,PatientPoint Health Technologies, and FyidoctorsBachelor of Arts in Finance and Accounting from the University of Michigan andMBA from Columbia Business SchoolJeffrey Rosenthal Lead Director Managing Partner and co-founder of Imperial Capital, a mid-market privateequity firmBoard member for several portfolio companies, including Certus Pest Controland Keplr VisionBachelor of Arts in Commerce and Economics from the University of Torontoand MBA from York UniversityRajan Shah Director Principal at L CattertonPreviously Principal at Ontario Teachers’ Pension Plan, focused on globalopportunities in the consumer and healthcare services sectorsBachelor of Accounting and Finance and Master of Accounting from theUniversity of WaterlooChartered Accountant in CanadaSandra Bosela Director Global Head of Private Equity, Managing Director and Co-Head of thePrivate Markets Group at OPTrustPreviously spent over 12 years at EdgeStone Capital Partners, a mid-marketprivate equity firmHonours Business Administration degree from Western University andcompleted the General Management Program at Harvard Business SchoolGino Volpacchio Director Chairman, Chief Executive Officer, and co-founder of PetVet Care CentersFormer CEO of Watch World International and the former COO andCFO of J. Crew Retail and Benetton U.S.A.Bachelor of Science from Fairleigh Dickinson University and MBA fromPace UniversityRobert Wolf Director Served as the CFO of RioCan REIT from its inception in 1994 through 2008Since 2008, has served as a director for a number of TSX-listed companiesCPA, Bachelor of Commerce from McGill University and MBA fromYork UniversityStacey Mowbray Director Served as President of WW International (formerly Weight Watchers) from2014 to 2019CEO and President of Second Cup Limited from 2008 to 2014Bachelor of Business Administration from Wilfrid Laurier University and MBAat York University and holds the ICD.D designation
investors@dentalcorp.ca
Canadian Dental Association recommends dental visits at a minimum every 6 months 80% of Canadians have a regular dentist 75% of Canadians see a dentist every year 90% of Canadian children see a dentist every year 75% of Canadians have dental insurance. Dental services expenditure per capita growth has outpaced CPI in 7 of the last 10 years, and