Transcription
Data through July 25th, 2010August 2010 NewsletterETF Portfolio UpdateAll of the EZTracker ETF Portfolios were up for the month in a market that was less than optimal for investors. We continue to make changesto the portfolios as necessary to seek performance.You will also notice that there are name changes to the BIG 6 Portfolio and the EZ5 Portfolio. This was necessary to reflect the moreaccepted names of Aggressive and Moderate Portfolios. In the Aggressive ETF Portfolio: Sell SPDR Gold Shares (GLD) and buy SPDR S&P Emerging Asia Pacific (GMF) with the proceeds. In the Moderate ETF Portfolio: There are NO CHANGES to the Portfolio. In the Fidelity 25 ETF: Sell S&P Mid Cap 400 Value (IJJ) and the Russell 2000 Small Cap Value (IWN) and use the proceeds to buyequal dollar amounts of MSCI Emerging Markets (EEM) and S&P Mid Cap 400 (IJH) In the Vanguard 46 ETF: Sell Vanguard Small Cap (VB) and use the proceeds to buy Vanguard Large Cap (VV)Updated portfolios on pages 2‐4Each of the past four weeks has given us some significant market moves. Below are the week‐to‐week percentage changes for the S&P 500.We expect this volatility to continue while the market digests good earnings data and poor economic growth data. This conflictinginformation creates investor uncertainty and market instability.Week of:June 28July 5July 12July 19Weekly % change‐5.04% 5.42%‐1.22% 3.55%We’ve added two new ETF Portfolios to our ETF newsletter: The Vanguard 46 ETF Portfolio The Fidelity 25 ETF PortfolioThese two new portfolios in our ETF Newsletter are terrific opportunities for EZTracker subscribers who have accounts at Fidelityor Vanguard for their IRAs or other investments (as well as for anyone who is interested in starting an ETF portfolio). These ETFsprovide good coverage of the major market segments and the commission‐free status allows investors to start a portfolio with asmall amount of cash.Fidelity: Fidelity account holders may now trade 25 ETFs commission‐free. These ETFs represent major market sectors withexcellent liquidity. For more information use the following link: Vanguard: Vanguard account holders may trade 46 ETFs commission‐free. The Vanguard ETFs provide a wider range of marketsectors than the commission‐free ETFs at Fidelity but some of the individual funds may have lower trading volume requiring carein placing orders. For more information: T.srch 1.News You Can UseEach month we post our market comments on www.eztracker401k.com. We know many of you are interested in our observations as well asinformation about market trends so we encourage you to go the website every month. Go to www.eztracker401k.com and click on NewsYou Can Use in the green horizontal menu bar.This month you’ll also find links to several articles on a range of topics including the financial overhaul, earnings reports, and a continuationof mortgage‐market issues.
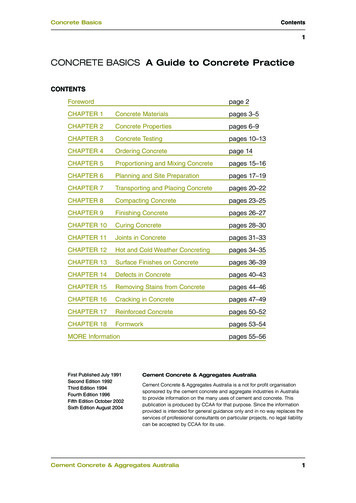
Aggressive & Moderate ETF PortfoliosPerformance ThroughJune 27, 2010Month6/27/10to7/25/102.11%3.59%2.41%Aggressive ETF PortfolioModerate ETF Portfolio*S & P 500 %15.39%NA10.88%*EZ5 Portfolio started 2‐26‐07Note: Past performance does not guarantee future results.The EZTracker and S&P 500 performance is based on total returns including dividends and capital gains.Returns exclude the impact of any trading costs (commissions).The ETF Portfolios seek to identify the top performing market segments for timely investment.The last three pages of the newsletter provide data on all of the ETFs tracked by EZTracker. The Aggressive portfolio consists of fundsselected based on performance and may include the use of a high performing country fund. The Moderate portfolio excludes sector,country and short funds.The EZTrackerETF portfolios do not use trailing stop‐loss orders. Individual investors should consider them for managing their portfolio (seepage 4).EZTrackerETF portfolios UPGRADE positions each month. Quite often we change positions monthly. These are not buy and hold portfolios.You need to keep current with the changes we make each month and make them when the newsletter is published. The EZTrackerETFportfolios are published on the last Sunday of every month.ETF Portfolios 07/25/2010AGGRESSIVE ETF PORTFOLIOLiquidate:SPDR Gold Shares (GLD)MODERATE ETF PORTFOLIOLiquidate:No Changes To PortfolioUse the proceeds to buy equal dollar amounts of:SPDR S&P Emerging Asia Pacific (GMF)Updated Aggressive Portfolio – July 25, 2010Ticker%SPDR S&P Emerging EuropeGUR16.8%IYR18.1%iShares DJ U.S. Real EstateKIE17.3%SPDR KBW InsuranceEPI16.2%Wisdom Tree India EarningsGMF15.1%SPDR S&P EM Asia PacificGML16.5%SPDR S&P Emerging Latin AmericaYour percentages may vary based on the start date of yourportfolio and the number of shares purchased.Moderate Portfolio – July 25, 2010TickerSPDR Barclays Capital High YieldJNKGURSPDR S&P Emerging EuropePowerShares High Yield DividendPEYAAXJiShares All Asia ex JapanGMLSPDR S&P Emerging Latin America%30.4%16.8%19.9%16.4%16.5%Your percentages may vary based on the start date of yourportfolio and the number of shares purchased.Data on all the ETFs tracked by EZTracker is provided on pages 7‐9.2
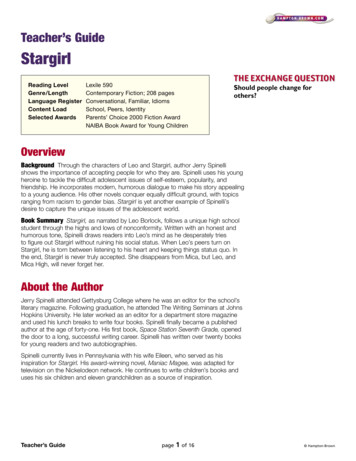
The Fidelity 25 PortfolioPerformance ThroughJuly 25, 2010Fidelity 25 Aggressive ETF PortfolioS & P 500 IndexMonth6/27/2010 to 7/25/20101.80%2.41%Since Inception 3/29/2010‐4.70%‐5.48%Fidelity account holders may now trade 25 ETFs commission‐free. This is a terrific opportunity for EZTracker subscribers who have accountsat Fidelity for their IRAs or other investments. The 25 ETFs provide good coverage of the major market segments while the commission‐freestatus allows investors to start a portfolio with a small amount of cash. For more information on this service, use the following /ETF.While the Fidelity 25 Portfolio has the benefit of trading commission‐free, it lacks the breadth of the options available to subscribers whouse the Aggressive ETF and Moderate ETF Portfolios where we select the top performers from a group of 145 options.The Fidelity 25 Portfolio is an aggressive portfolio constructed with the four top‐performing ETFs that trade commission‐free at Fidelity.Subscribers who want a more conservative approach can use this model portfolio as a base, adding holdings in a money market and/orbond ETFs to moderate volatility. Each month EZTracker will update this Fidelity portfolio and data on all 25 alternatives.EZTrackerETF portfolios UPGRADE positions each month. Quite often we change positions monthly. These are not buy and hold portfolios.You need to keep current with the changes we make each month and make them when the newsletter is published. The EZTrackerETFportfolios are published on the last Sunday of every month.Fidelity 25 Aggressive PortfolioLiquidate: S&P MidCap 400 Value (IJJ)Russell 2000 Small Cap Value (IWN)Use the proceeds to buy equal dollar amounts of: MSCI Emerging Markets (EEM)S&P Mid Cap 400 (IJH)Updated Fidelity 25 Aggressive PortfolioS&P MidCap 400 GrowthMSCI Emerging MarketsS&P Mid Cap 400S&P Small Cap 600 GrowthTickerIJKEEMIJHIJT%25.0%25.0%25.0%25.0%Data on all the Fidelity commission‐free ETFs on pages 10.Your percentages may vary basedon the start date of your portfolioand the number of sharespurchased.
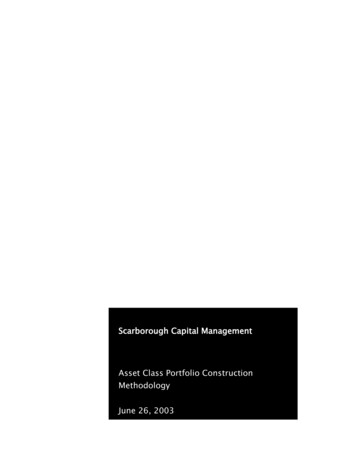
The Vanguard 46 PortfolioPerformance ThroughJuly 25, 2010Vanguard 46 Aggressive ETF PortfolioS & P 500 IndexSince Inception 6/01/2010Month6/27/2010 to 7/25/20102.46%2.41%1.73%1.22%The Vanguard 46 portfolio is in response to Vanguard’s announcement to allow account holders to buy and sell Vanguard ETFs on acommission‐free basis in a Vanguard account. This is a terrific opportunity for EZTracker subscribers who have accounts at Vanguard fortheir IRAs or other investments. The 46 ETFs provide good coverage of the major market segments while the commission‐free status allowsinvestors to start a portfolio with a small amount of cash. For more information on this service, use the following tml?WT.srch 1.We have completed back testing of the Vanguard Portfolio for the 2008 through May 30, 2010. Because of the limited number of VanguardETFs prior to 2008, we did not extend our back test.200820092010 YTDTotalVanguard 46 Portfolio‐13.71%26.03%4.43%13.57%EZTracker Aggressive Portfolio‐23.37%30.14%‐9.45%‐11.86%S&P 500‐37.03%26.46%‐1.12%‐24.91%While the Vanguard 46 Portfolio has the benefit of trading commission‐free, it lacks the breadth of the options available to subscribers whouse the Aggressive ETF and Moderate ETF Portfolios where we select the top performers from a group of 145 options.The Vanguard 46 Portfolio is an aggressive portfolio constructed with the five top‐performing ETFs that trade commission‐free at Vanguard.Subscribers who want a more conservative approach can use this model portfolio as a base, adding holdings in a money market and/orbond ETFs to moderate volatility. Each month EZTracker will update this portfolio and data on all 46 alternatives.EZTrackerETF portfolios UPGRADE positions each month. Quite often we change positions monthly. These are not buy and hold portfolios.You need to keep current with the changes we make each month and make them when the newsletter is published. The EZTrackerETFportfolios are published on the last Sunday of every month.Vanguard 46 Aggressive PortfolioLiquidate:Vanguard Small Cap (VB)Use the proceeds to buy:Vanguard Large Cap (VV)Vanguard 46 Aggressive PortfolioVanguard REITVanguard Large CapVanguard Mid Cap ValueVanguard Information TechnologyVanguard Emerging .0%Your percentages may vary based on the start date of your portfolio, number of shares purchased and the addition or subtraction of cash from your account.Data on all the Vanguard commission‐free ETFs on pages 11.
Referral Rewards ProgramMany of your friends are missing the benefits of EZTracker. They’re confused about what to do with their IRA and other investment accounts. You canhelp them take a step toward a better retirement. The new Fidelity 25 ETF and Vanguard 46 ETF portfolios may be a great way for them to takecontrol of their financial futures. Just send us their name and e‐mail address, we’ll send them the current newsletter. No cost, no obligation. Whenthey subscribe ask them to put your name in the “Referred By” box on the subscription form. You’ll get an extra month added to your subscriptionfor your help. Contact us at contact@eztracker401k.com or 609‐513‐8623.ETF InformationMorningstar has an excellent ETF Center with a number of educational resources (www.morningstar.com). One of the newest ETF sites is ETFDatabase (www.etfdb.com) which provides news, commentary and a screener.Discount BrokersWe’ve updated our list of discount brokers. It’s easy to access‐‐go to the EZTracker website (www.eztracker401k.com) and click the EZTrackerETF tabin the green horizontal menu bar. If you are making your own investment decisions, it makes sense to use a discount broker. With the tradingfrequency of the EZTracker portfolios, this is a financial necessity. Check out several before opening an account.Starting your ETF PortfolioFind a discount broker and open an online account. See our list of discount brokers on the ETF & Stock portion of our website,www.eztracker401k.com. Most discount brokers charge between 7 and 15 per trade. If you are paying more than that, you are paying too much.Some discount brokers (Scottrade, AmeriTrade and Schwab are three) also have retail locations you can visit for in‐person service.Once your account is open, make sure you understand market orders, limit orders, stop loss orders and trailing stops.Purchase ETFs in the same way you would purchase any stock online: Determine the dollar amount you want to invest in the specific ETF and divide itby the current share price to determine roughly how many shares you want to buy. Purchase ETFs using either a market or a limit order.Building Your ETF Portfolio: Three Different Strategies.1.2.3.Buy all positions in the ETF portfolio as soon as you get your EZTrackerETF Newsletter. This strategy gets you totally invested all at once.Buy ONLY the NEW positions in the ETF portfolio. When we buy an ETF to replace one we are selling, buy the new ETF. This strategy easesyou into the ETF portfolios as new ETFs emerge each month.Some subscribers add investment dollars to their portfolio over time. They either purchase larger dollar amounts of each ETF over time orthey purchase additional ETFs beyond the model portfolio based on their own analysis of opportunities in the market. (See the list on thelast three pages of the newsletter).Managing Your PortfolioAs one ETF drops from the portfolio, replace it with the new ETF. Some months may have no changes and some months may have several changes.Never REBALANCE your portfolio—only UPGRADE by buying the new ETFs with the proceeds of the ETFs you sell off.Putting Cash to WorkIf you are adding cash to your ETF portfolio, put it to work. Rather than adding to positions you already hold and incurring additional commissioncharges, consider putting this cash to work when you are buying new positions. Here’s an approach we’ve used: When adding one new position, add 50% of your cash balance to the proceeds of the ETF you are selling. When adding two new positions, add 80% of your cash balance to the proceeds of the ETFs you are selling and split the dollar total equallyin purchasing the two new ETFs. When adding three or more new positions, add your entire cash balance to the proceeds of the ETFs you are selling and split the dollar totalequally in purchasing the new ETFs.While this process will lead to a wider variance from our model portfolios, you will have put your cash to work in the top performing sectors.CashMaximize your potential return for any cash in your portfolio. Call your discount broker to make sure you are availing yourself of the best alternativesfor your cash. Your broker may have a sweep money market account that pays a better rate of return than what you are currently receiving.Managing RiskWe receive numerous e‐mails and phone calls asking advice about an individual portfolio. EZTracker is not an investment advisor. We are publishersof financial information. As publishers, we update our portfolios monthly and move the model portfolios into or out of the market depending on ourtrend tracking. A decision to move out of the market should be based on your individual investment goals, comfort and assessment of the market.
Stop Loss OrdersStop‐loss orders allow investors to minimize losses in individual equities. The advantage of a stop order is that you don't have to monitor on a dailybasis how a stock is performing‐‐ especially handy when you are unable to monitor your stocks for an extended period of time.The disadvantage is that the stop price could be activated by a short‐term fluctuation in price. The key is picking a stop‐loss percentage that allows forday‐to‐day fluctuation while preventing as much risk as possible. Setting a 5% stop loss on an investment with a history of fluctuating 10% or more ina week is not the best strategy; you'll most likely just lose money on the commissions generated from the execution of your stop‐loss orders. Thereare no hard and fast rules for the level at which stops should be placed. This totally depends on your individual investing style. Most are set in the 5‐10% range. Keep in mind that once your stop price is reached, your stop‐order becomes a market order ‐‐and the actual sell price may be muchdifferent from the stop price. This is especially true in a fast‐moving market where stock prices can change rapidly.Stop‐loss orders are traditionally thought of as a way to prevent losses. Another use of this tool, though, is to lock in profits, sometimes referred to asa "trailing stop". Here, the stop‐loss order is set at a percentage level below not the price at which you bought it, but the current market price. Theprice of the stop‐loss adjusts as the stock price fluctuates. Remember, if a stock goes up, what you have is an unrealized gain, which means you don'thave the cash in hand until you sell. Using a trailing stop allows you to let profits run while at the same time guaranteeing at least some realized gain.How To Use This NewsletterThese portfolios involve significant risk and are for the sophisticated investor willing and able to assume this high degree of risk.The model portfolios in each newsletter identify the top performing ETFs. By upgrading your portfolio each month to the best performing alternativesand following market trends, you significantly increase the likelihood of superior performance. Unlike buy‐and‐hold approaches, EZTracker portfoliosrespond to changing market conditions. By continually upgrading to new market leaders, you can participate in a broad range of opportunities as theydevelop. There are many ways to use the data and information in the EZTracker Newsletter. Most subscribers consider the following criteria whendeciding individual investment strategy: Most subscribers identify some current holdings as fixed portions of their investment plans and use one of the model portfolios for thebalance. Some subscribers select the model portfolio which best represents their investment style and risk tolerance and adjust their holdings byfollowing the model portfolio. Some subscribers select the model portfolio which best represents their investment style and risk tolerance and then use their own marketanalysis to adjust the portfolios – expanding or shortening the list of holdings in the model portfolios. Some subscribers limit their exposure to any one industry group or the extent of international exposure in their portfolio. Some subscribers combine elements of each model portfolio and construct their own portfolio using the data in the newsletterETF BasicsExchange Traded Funds (ETFs) are like mutual funds ‐‐ baskets of securities that offer diversified exposure. They are designed to mirror theperformance of a particular market index. Because ETFs are composed of multiple holdings, they offer investors an easy way to diversify with a singlepurchase. But unlike mutual funds, ETFs can be bought and sold throughout the trading day like stocks. They can be purchased on margin, sold short,or limit and stop loss orders can be used. ETFs have been available for more than 10 years but the number of different ETFs was limited until aboutfour years ago. The major advantages of ETFs over mutual funds are improved liquidity, lower costs and NO trading restrictions.ETF information is widely available. We encourage you do some investigation on your own. You should never invest in anything you don’tunderstand or that makes you uncomfortable with the degree of risk involved. Any brokerage firm will have information. You can do a quick websearch for instant facts or you can go to www.morningstar.com for valuable background on the pros and cons of Exchange Traded Funds. Please let usknow if you have specific questions about ETFs or would like us to recommend some information about this investment alternative. E‐mail us atcontact@eztracker401k.comWhy Do We Use ETFs in our Portfolios And should they be a Part of Your Portfolio?ETF's offer advantages, particularly over mutual funds: Lower costs ‐ ETFs generally have lower costs than other investment products because most ETFs are not actively managed and becauseETFs are insulated from the costs of having to buy and sell securities to accommodate shareholder purchases and redemptions. Buying and selling flexibility ‐ ETFs can be bought and sold at current market prices at any time during the trading day, unlike mutual fundsand unit investment trusts, which can only be traded at the end of the trading day. Tax efficiency ‐ ETFs generally generate relatively low capital gains, because they typically have low turnover of their portfolio securities. Market exposure and diversification ‐ ETFs provide an economical way to rebalance portfolio. An index ETF inherently providesdiversification across an entire index. ETFs offer exposure to a diverse variety of markets, including broad‐based indexes, broad‐basedinternational and country‐specific indexes, industry sector‐specific indexes, bond indexes, and commodities. Transparency ‐ ETFs, whether index funds or actively managed, have transparent portfolios and are priced at frequent intervals throughoutthe trading day.The ETF market is maturing rapidly but it still does not cover the entire spectrum of assets. At EZTracker we have selected over 125 ETFs for analysisand evaluation to construct our portfolios. As this list expands we will add certain ETFs to our list.6
Aggressive and Moderate Monthly ETF DataThe ETF Aggressive portfolio uses a wide range of ETFs (Bonds, Index Funds, Large, Mid and Small Caps, International Funds and Emerging Markets.This portfolio may also use a maximum of two sector funds and may also include a single country fund. The Moderate ETF portfolio uses a selectionof larger ETF and avoids using any sector or individual country funds. This portfolio always includes a bond ETF for a minimum of 30% of the portfolioholdings.July 25, 2010TickerETFTrackerPortfolio1 Mo.3Mo.6Mo.12 Mo.Avg.ECHiShares MSCI Chile Index Fund9.15%21.27%19.96%37.48%47.92%VNQVanguard REIT Index1.98%‐0.38%24.17%56.33%44.79%GURSPDR S&P Emerging EuropeIYRiShares Dow Jones US Real TURiShares MSCI Turkey Invest Mkt Index10.11%4.15%21.35%33.37%THDiShares MSCI Thailand Invest Mkt Index5.00%7.56%23.89%25.90%34.01%RSXMarket Vectors Russia ETF 11%15.45%34.70%30.92%KIEGMLEPIEWMEWWSLXSPDR KBW InsuranceSPDR S&P Emerging Latin AmericaWisdomTree India EarningsAggressiveiShares MSCI Malaysia Index .78%29.44%iShares MSCI Mexico Index Fund0.25%1.35%20.28%29.35%27.95%Market Vectors Steel ETF3.08%‐1.82%21.71%27.80%27.69%EWDiShares MSCI Sweden Index Fund7.57%0.27%19.28%20.58%26.02%EZAiShares MSCI South Africa Index Fund5.58%6.05%17.31%18.22%25.73%ILFiShares S&P Latin America 40 IndexGMFSPDR S&P Emerging Asia 3.75%17.25%20.84%24.84%KOLMarket Vectors Coal s Multi‐Asset Income4.30%0.87%10.87%26.99%23.47%PFFiShares S&P U.S. Preferred Stock IndexAAXJiShares All Asia .34%20.74%22.83%XMEEWZSPDR S&P Metals & Mining0.84%‐4.54%18.97%26.57%22.82%iShares MSCI Brazil Index ratePEYPowerShares HighYield Dividend Achievers3.17%‐0.77%12.46%26.03%EWSiShares MSCI Singapore Index Fund5.34%3.90%16.23%15.35%22.27%EEBClaymore/BNY Mellon BRIC ETF1.81%1.00%12.97%23.66%21.51%EEMiShares MSCI Emerging Markets Index3.76%1.42%12.62%21.51%21.44%PGFPowerShares Financial lphaShares China Small Cap3.25%2.32%16.26%16.59%20.96%PGXPowerShares Preferred3.75%5.05%9.43%17.25%19.35%XRTSPDR S&P ares Dow Jones Transportation Average2.36%‐3.97%15.54%20.06%IWSiShares Russell Midcap Value Index1.28%‐4.72%13.90%22.70%18.08%PCYPowerShares Emerging Mkts Sovereign Debt3.08%3.44%9.35%17.21%18.05%CWBSPDR Barclays Capital Convertible SecuritiesGLDSPDR Gold 0.81%22.26%17.75%17.37%XLIIndustrial SPDR2.97%‐6.53%12.48%22.93%VCRVanguard Consumer ares MSCI Pacific s MSCI Hong Kong Index Fund3.11%4.56%15.90%5.92%16.08%MDYMidCap SPDRs1.78%‐4.81%13.26%19.02%15.96%IGViShares S&P NA Tech ‐‐ Software3.85%‐2.11%12.23%14.35%15.45%SCZiShares MSCI EAFE Small Cap Index3.82%‐2.30%8.39%18.36%15.42%IYJiShares DJ Industrials2.53%‐6.95%11.11%20.51%14.84%RWXSPDR Dow Jones Intl Real Estate6.80%0.93%8.40%10.67%14.62%SLViShares Silver Trust‐2.53%‐0.38%11.47%17.98%14.48%SDYSPDR S&P PDR Barclays Capital High Yield Bond3.55%1.44%7.67%13.55%14.30%IWOiShares Russell 2000 Growth Index1.68%‐3.83%14.00%14.12%14.17%IWNiShares Russell 2000 Value Index0.50%‐7.42%14.58%18.30%14.16%XLYConsumer Discretionary SPDR0.28%‐9.75%11.98%23.16%14.00%PIDPowershares International Dividend Achievers3.66%0.44%6.33%15.21%13.98%EWYiShares MSCI South Korea Index Fund2.42%‐1.81%12.42%12.35%13.84%IWMiShares Russell 2000 Index0.95%‐6.02%14.09%15.55%13.40%RSPRydex S&P Equal Weight1.18%‐5.87%9.90%18.98%13.19%EWUiShares MSCI United Kingdom Index Fund5.91%‐0.65%6.39%12.22%13.02%7
TickerETFPortfolio1 Mo.3Mo.6Mo.12 Mo.Avg.DVYiShares Dow Jones Select Dividend Index3.29%‐2.97%8.50%14.45%VAWVanguard Shares Russell Midcap Growth ard European Stock ETF5.74%‐0.78%5.95%11.55%EWNiShares MSCI Netherlands Index Fund5.62%‐1.02%4.92%12.89%12.22%EWKiShares MSCI Belgium Index Fund5.71%1.06%3.25%12.19%12.11%IGWiShares S&P NA Tech ‐‐ R S&P International Small Cap2.66%‐4.52%7.40%16.52%12.04%IXPiShares S&P Global TelecommunicationsIYCiShares DJ US Consumer 9.43%21.10%FXI11.50%IShares FTSE‐Xinhua China 25 Fund0.48%6.24%15.29%‐1.10%VGT11.41%Vanguard Information Technology ETF1.37%‐5.91%10.01%14.02%10.63%10.57%EFGiShares MSCI EAFE Growth Index3.67%‐1.53%5.77%11.45%IYWiShares DJ US S Trust, Series 11.24%‐4.85%7.80%15.14%10.55%MXIiShares S&P Global Materials2.73%‐2.76%9.79%9.29%10.39%IYZiShares Dow Jones US Telecom3.02%‐1.47%9.14%7.86%10.12%DBBPowerShares DB Base Metals5.60%‐6.11%6.42%11.99%9.76%PowerShares 3.56%12.50%9.59%9.56%QQQQIWCiShares Russell Microcap IndexIEFiShares Barclays 7‐10 Year Treasury1.43%5.45%3.89%6.77%IYFiShares DJ US Financial Sector0.15%‐7.96%10.02%14.65%9.20%GDXMarket Vectors Gold Miners ETF‐6.17%1.98%16.55%4.49%9.19%XLFFinancial Select Sector SPDR0.35%‐7.73%9.86%14.08%9.04%TLTiShares Barclays 20 Year Treas Bond0.85%6.85%3.12%5.47%8.89%EWAiShares MSCI Australia Index Fund2.82%‐4.67%7.82%9.90%8.66%LQDiShares iBoxx Invest Grade Corp Bond2.17%2.61%3.94%7.09%8.62%IGNiShares S&P NA Tech ‐‐ Multimedia Network5.50%‐7.71%10.38%7.44%8.52%IGFiShares S&P Global Infrastructure Index5.18%‐0.41%4.21%6.00%8.17%XLUUtilities Select Sector SPDR5.60%2.04%4.25%2.79%8.00%AGGiShares Barclays Aggregate Bond1.01%3.13%3.06%7.13%7.82%PSPPowerShares Listed Private Equity3.04%‐6.62%6.83%10.64%7.58%7.40%EWLiShares MSCI Switzerland Index Fund3.00%‐1.86%3.45%8.98%MOOMarket Vectors Agribusiness ETF6.05%‐2.22%3.91%5.73%7.34%IWDiShares Russell 1000 Value Index0.74%‐6.94%7.00%12.66%7.34%VEUVanguard FTSE All World Ex‐US3.60%‐1.90%6.49%4.96%7.17%XLPConsumer Staples SPDR2.59%‐3.05%2.90%10.41%7.01%XLKTechnology Select Sector SPDR1.16%‐5.68%7.51%9.60%6.87%BNDVanguard Total Bond Market ETF0.86%2.68%2.67%6.12%6.73%EWTiShares MSCI Taiwan Index Fund4.76%‐2.25%4.30%5.19%6.54%EWCiShares MSCI Canada Index Fund‐0.93%‐3.89%11.33%5.27%6.43%EFViShares MSCI EAFE Value Index5.18%‐3.53%2.58%6.98%6.11%6.10%EWGiShares MSCI Germany Index Fund4.27%‐1.68%7.62%0.98%XOPSPDR S&P Oil & Gas Exploration & Prod‐2.28%‐3.89%7.34%9.90%6.04%VYMVanguard High Dividend Yield Indx ETF1.93%‐6.48%2.79%12.23%5.72%5.62%IWFiShares Russell 1000 Growth Index1.10%‐6.47%5.17%10.51%IVWiShares S&P 500 Growth Index1.33%‐6.20%5.68%9.49%5.62%VIGVanguard Dividend Appreciation ETF2.04%‐6.52%2.34%12.08%5.42%EZUiShares MSCI EMU Index5.90%‐2.40%1.40%5.02%5.41%UGAUnited States Gasoline2.32%‐2.90%9.09%‐0.22%4.52%IVEiShares S&P 500 Value Index0.91%‐7.63%4.80%9.98%4.40%TIPiShares Barclays TIPS Bond‐0.63%0.96%0.01%6.59%3.78%3.15%XLBMaterials Select Sector SPDR5.22%‐5.59%7.97%‐1.82%GSGiShares S&P GSCI Commodity‐Indexed Trust2.72%‐2.59%5.46%0.08%3.09%USOUnited States 7.78%3.85%8.45%3.05%IXGiShares S&P Global Financials2.02%‐5.82%6.14%2.23%2.49%IGEiShares S&P North Amer Natural Resources‐0.05%‐6.85%5.03%6.37%2.45%SHYiShares Barclays 1‐3 Year Treasury %15.53%2.01%0.80%‐4.48%6.48%0.53%1.81%KRESPDR KBW Regional BankingDBEPowerShares DB EnergyUUPPowerShares DB US Dollar Index Bullish‐3.92%‐0.28%2.36%4.17%1.27%EWPiShares MSCI Spain Index Fund12.57%0.92%‐2.17%‐9.08%1.22%8
TickerETFPortfolio1 Mo.3Mo.6Mo.12 Mo.Avg.EWOiShares MSCI Austria Index Fund4.98%‐8.66%1.53%4.15%PHOPowerShares Water Resources0.88%‐8.93%5.46%3.77%1.09%0.64%BWXSPDR Barclays Capital Intl Treasury Bond3.90%1.35%‐1.50%‐2.86%0.49%IYGiShares DJ US Financial Services‐0.39%‐11.57%5.62%6.96%0.34%EWQiShares MSCI France Index Fund4.75%‐3.59%0.25%‐0.93%0.26%DBCPowerShares DB Commodity Index Tracking2.51%‐3.34%2.67%‐1.41%0.23%XHBSPDR S&P Homebuilders0.08%‐18.19%6.45%11.89%0.13%FEZSPDR DJ EURO STOXX res DB hares MSCI Italy Index Fund6.34%‐3.02%‐0.77%‐6.07%‐1.92%WIPSPDR DB Intl Govt Infl‐Protected hares WilderHill Clean Energy5.99%‐3.40%5.36%‐14.85%‐3.76%XLEEnergy Select Sector C Global Solar hares S&P Global res MSCI Israel Cap Invest Mkt Index0.60%‐10.70%‐4.14%3.07%‐6.09%IHFiShares Dow Jones US Healthcare 44%IXJ
August 2010 Newsletter Data through July 25th, 2010 ETF Portfolio Update All of the EZTracker ETF Portfolios were up for the month in a market that was less than optimal for investors. . Fidelity 25 ETF: Sell S&P Mid Cap 400 Value (IJJ) and the Russell 2000 Small Cap Value (IWN) and use the proceeds to buy .