Transcription
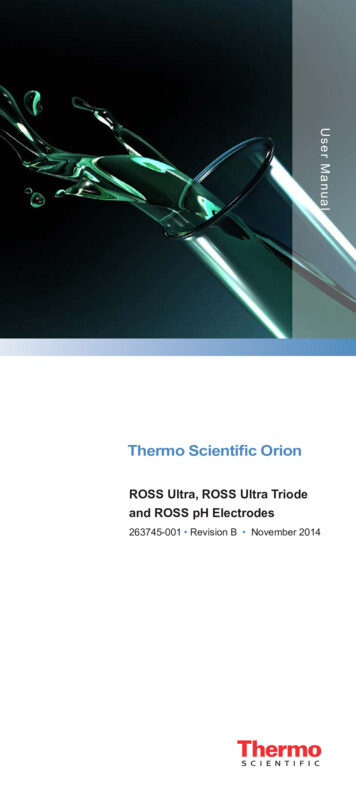
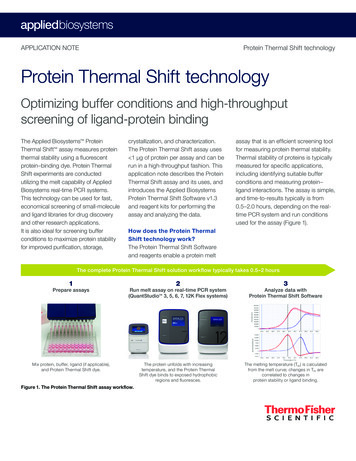
APPLICATION NOTEProtein Thermal Shift technologyProtein Thermal Shift technologyOptimizing buffer conditions and high-throughputscreening of ligand-protein bindingThe Applied Biosystems ProteinThermal Shift assay measures proteinthermal stability using a fluorescentprotein–binding dye. Protein ThermalShift experiments are conductedutilizing the melt capability of AppliedBiosystems real-time PCR systems.This technology can be used for fast,economical screening of small-moleculeand ligand libraries for drug discoveryand other research applications.It is also ideal for screening bufferconditions to maximize protein stabilityfor improved purification, storage,crystallization, and characterization.The Protein Thermal Shift assay uses 1 µg of protein per assay and can berun in a high-throughput fashion. Thisapplication note describes the ProteinThermal Shift assay and its uses, andintroduces the Applied BiosystemsProtein Thermal Shift Software v1.3and reagent kits for performing theassay and analyzing the data.assay that is an efficient screening toolfor measuring protein thermal stability.Thermal stability of proteins is typicallymeasured for specific applications,including identifying suitable bufferconditions and measuring protein–ligand interactions. The assay is simple,and time-to-results typically is from0.5–2.0 hours, depending on the realtime PCR system and run conditionsused for the assay (Figure 1).How does the Protein ThermalShift technology work?The Protein Thermal Shift Softwareand reagents enable a protein meltThe complete Protein Thermal Shift solution workflow typically takes 0.5–2 hours123Prepare assaysRun melt assay on real-time PCR system(QuantStudio 3, 5, 6, 7, 12K Flex systems)Analyze data withProtein Thermal Shift SoftwareMix protein, buffer, ligand (if applicable),and Protein Thermal Shift dye.The protein unfolds with increasingtemperature, and the Protein ThermalShift dye binds to exposed hydrophobicregions and fluoresces.The melting temperature (Tm) is calculatedfrom the melt curve; changes in Tm arecorrelated to changes inprotein stability or ligand binding.Figure 1. The Protein Thermal Shift assay workflow.
Protein Thermal ShiftapplicationsProtein stability screening: Improving protein preps(buffer pH, salt, excipients,additives) Profiling crystallizationconditions Protein formulation andstorage buffer optimization Effect of mutations or modifications on protein stability Protein prep QC (presence ofcontaminants or aggregatedprotein)High-throughput ligandscreening: Small-molecule andfragment library screens Antibody–target specificity Protein–protein interaction Inhibitor bindingA real-time melt experiment usingthe Protein Thermal Shift dye kit andany real-time PCR system will yielda fluorescence profile specific to aprotein and its environment (bufferor ligands). The Protein Thermal Shiftdye does not fluoresce in aqueoussolutions but fluoresces in nonpolarenvironments. The protein is mixedwith the dye and heated; as it unfoldsor melts, hydrophobic parts of theprotein are exposed and bind to thedye, resulting in a significant increasein fluorescence emission detected bythe PCR system.The basic steps for a typical ProteinThermal Shift assay include:1. Mix protein, Protein Thermal Shiftdye, Protein Thermal Shift buffer,and ligand (if applicable).2. Run a melt curve on a real-time PCRinstrument.3. Transfer the *.eds file to ProteinThermal Shift Software for analysis.4. Calculate the melting temperature(Tm) from the melt curve.5. Correlate changes in protein stabilityor ligand binding to changes in Tm.The Protein Thermal Shift Softwarecalculates the Tm from eachfluorescence profile using theBoltzmann method (from a plot offluorescence intensity vs. temperature)and the derivative method (from a plotof d(fluorescence)/dT vs. temperature).The derivative Tm values are taken fromthe top of the peak in the derivativeplot, while the Boltzmann Tm values aretaken from the inflection point of thefluorescence plot.The Protein Thermal Shift technology isuseful for many research applications,several of which are described below.
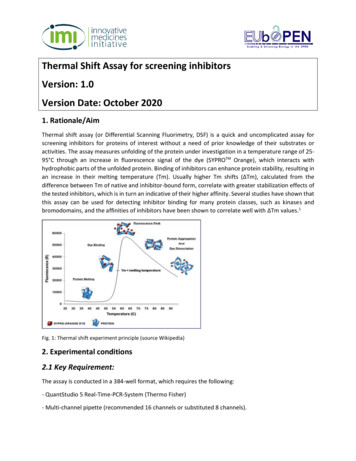
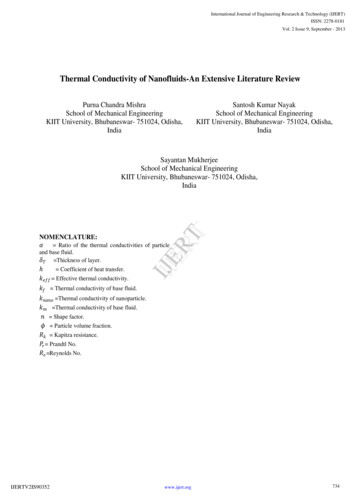
Optimizing buffer conditions forprotein stabilityProtein stability changes with bufferpH, salt content, and the presenceof various cofactors in a protein’senvironment. The Protein ThermalShift assay was used to screenbuffers to identify the pH wherethe protein RecA was most stable(Figure 2). The buffer panel consistedof four buffers with different pHvalues (pH 5.5, 6.0, 7.0, and 7.5).The pH 7.0 buffer had the highestmelting temperature indicating that theprotein is most stable at this pH. Thedata also demonstrate the high levelof reproducibility for each conditiontested. Subsequent experimentscould further refine the data bytesting a pH range near the optimalpH (7.0) identified here. Optimal saltconcentration for RecA stability wasalso tested (Figure 3). Identifyingoptimal buffer and salt conditions for aprotein of interest will increase proteinstructure stability, lower the tendencyfor aggregation, and improve thesuccess rate of crystallization.Studying protein–ligandinteractionsThe Protein Thermal Shift assay isideal for screening small moleculesor other types of compounds thatcan enhance protein thermal stability.In addition, this assay enablesidentification of ligands that can leadto successful co-crystallization. TheProtein Thermal Shift assay can beused to study binding interactionsbetween proteins and antibodies,drugs, and other proteins. When asmall-molecule ligand preferentiallybinds to the native form of a protein,the ligand stabilizes the protein and theTm of the complex is higher than thatof the unbound protein. Proteins withstabilizing ligands exhibit positivelyshifted melt curves in comparison toproteins without bound ligands.Figure 2. Effect of buffer pH on RecA thermal stability. The Protein Thermal Shift assay wasused to screen for the effect of various buffer conditions on RecA thermal stability. Data from ProteinThermal Shift Software show the Boltzmann (upper panel) and derivative (lower panel) melt profilesof buffer A (pH 5.5), B (pH 6.0), C (pH 7.0), and D (pH 7.5). Data were collected at 1 C intervals from25 C through 99 C on the Applied Biosystems StepOnePlus Real-Time PCR System and analyzedusing the Protein Thermal Shift Software.Figure 3. Effect of salt concentration on RecA thermal stability. Varying concentrations of saltwere titrated for each pH condition tested in Figure 2 to further optimize conditions for RecA thermalstability. Increases in the salt concentration had no effect on RecA thermal stability in buffer A.Increased salt concentrations in buffers B and C decreased the thermal stability of RecA. However, inbuffer D, increasing salt concentrations increased the thermal stability of RecA. Reaction conditionswere the same as described in Figure 2.
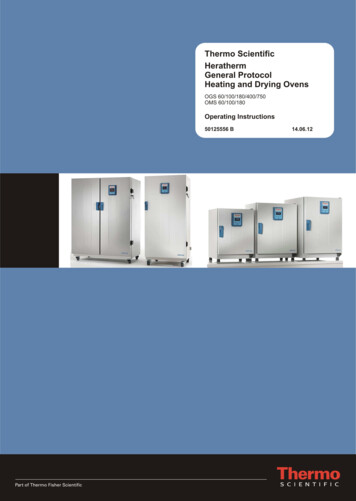
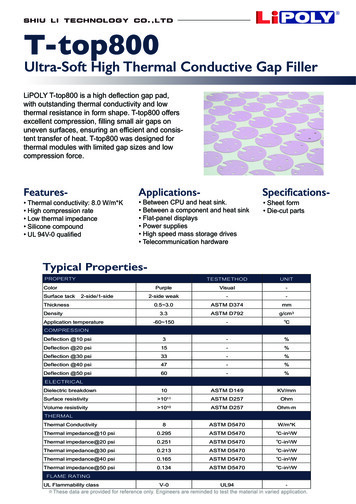
Effect of ligand binding on proteinthermal stabilityAn assay was used to demonstratethe thermal stability of RecA in thepresence of ATP used as a ligand(Figure 4). Results showed that thethermal stability of RecA increasedfrom 53.2 C to 57.7 C in the presenceof 5 mM ATP based on medianderivative Tm values.In Figure 5, various concentrationsof the Protein Thermal Shift controlligand were bound to the ProteinThermal Shift control proteinand assayed for thermal stability.The results show that proteinstability increased with increasingconcentrations of the ligand.Figure 4. Thermal stability of RecA with binding of ATP. RecA at a final concentration of0.2 mg/mL was mixed with a ligand (5 mM ATP) and the Protein Thermal Shift dye. Eight replicatereactions with and without ligand were run on an Applied Biosystems QuantStudio 5 Real-TimePCR System using melt curve filter setting at x1-m4, continuous data collection, and a ramp rateof 0.05 C/sec from 25 C through 99 C. Data were analyzed using Protein Thermal Shift Softwarev 1.3. Top: Fluorescence vs. temperature. Bottom: Derivative plot of the change in fluorescencevs. temperature. The median Boltzmann Tm and median derivative Tm values are shown as greendashed and black dotted vertical lines, respectively.Figure 5. Effect of ligand concentration on thermal stability. Different concentrations (0mM, 0.1 mM, and 1 mM) of the Protein Thermal Shift Control Ligand were bound to the ProteinThermal Shift Control Protein and analyzed using the Protein Thermal Shift assay. The data showthe slope of the melt curve increasing with the concentration of the ligand, thus indicating morestable binding of the protein at higher concentrations of ligand. Data were collected at 1 C intervalsfrom 25 C through 99 C on the StepOne Real-Time PCR System and analyzed using the ProteinThermal Shift Software.
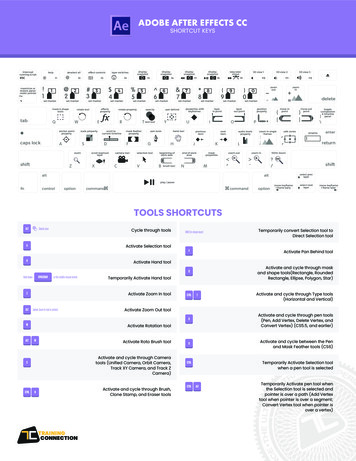
Screening against a panel ofligand mixes (high-densityscreening)Pooled ligands are used as an initialstep to assign protein binding to aspecific ligand group. If a significantthermal shift is detected with aligand pool (hit pool), the protein isthen screened against all individualligands in the pool to determine thespecific binding ligand(s). Figures 6and 7 show the results of a study inwhich 96 ligand mixes were screenedagainst the protein YraM to assessimprovement in thermal stability. MixesD10 and D11 demonstrated a ΔTmof 1.5 C, significantly different fromthe control and other mixes testedagainst YraM. A positive ΔTm indicatesimproved thermal stability with theligand mix tested.Figure 6. Screening YraM against a panel of ligand mixes. Several different ligand mixes were testedfor YraM binding using the Protein Thermal Shift assay. Mixes D10 and D11 showed the highest stability,as indicated by the increased Tm. The D10 and D11 mixes included CaCl2, MgCl2, CdCl2, CoCl2, ZnCl2,CuCl2, MnCl2, and NiCl2 along with other components. Tm data were generated using the Boltzmannmethod. ΔTm was calculated by comparing the Tm values for YraM without ligand to those of YraM withligand. Data were collected at 1 C intervals from 25 C through 99 C on the StepOne Plus Real-TimePCR System and are shown in the replicate result plot view of the Protein Thermal Shift Software.Figure 7. Screening YraM against D10 and D11 ligand mixes. The detailed Boltzmann andderivative plot views, in the Protein Thermal Shift Software, comparison of no ligand and the D10 andD11 ligand mixes tested with the YraM protein, as described in Figure 6.
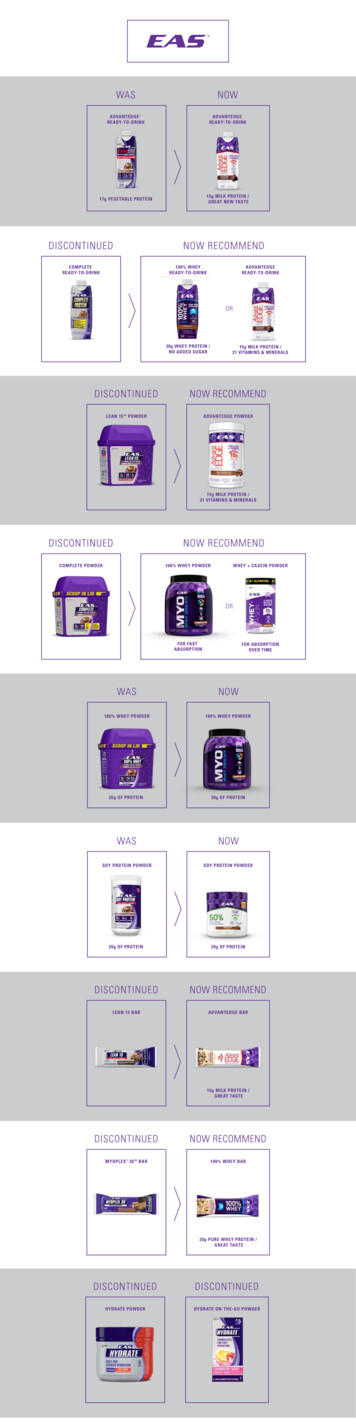
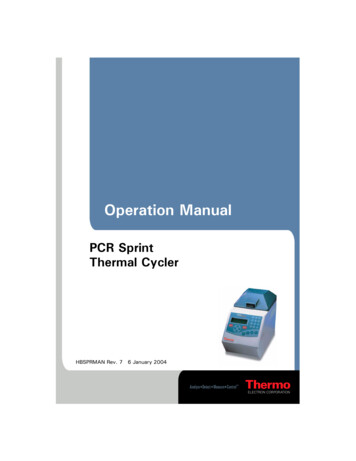
Mutation or protein modificationscreeningThe Protein Thermal Shift assaycan also be used to easily monitorthe effect of mutations on thethermal stability of a protein. Here,the Protein Thermal Shift assaywas used to discriminate pointmutation variants of Molony murineleukemia virus (M-MLV), Invitrogen SuperScript II, and SuperScript IIIreverse transcriptases (RTs)(Figure 8). The assay showed thatSuperScript III RT has the highestthermal stability among the threeproteins. This result demonstratesthat increasing numbers ofthermostabilizing mutations improvesthe thermostability of the reversetranscriptases and thus will improvereverse transcription efficiency.Protein–protein interactionanalysisProtein–protein interactions are criticalto many bimolecular processes. Theseinteractions include enzyme-substratebinding, and protein-antibodyor protein-receptor interactions.Understanding these interactions canprovide insight into how the proteinfunctions in a biological system. TheProtein Thermal Shift assay can detectthermal stability changes induced bythese interactions. To demonstratethis type of analysis, human decorinprotein and a monoclonal antibodywere used (Figure 9). Melt data fordecorin alone, the decorin–antibodycomplex, and the antibody aloneare shown.Figure 8. Effect of mutations on protein thermal stability. Each protein was analyzed at aconcentration of 0.2 mg/mL using the Protein Thermal Shift assay. Data were generated on anApplied Biosystems ViiA 7 Real-Time PCR System and collected at a ramp rate of 0.05 C/sec from25 C through 99 C and analyzed using the Protein Thermal Shift Software. The data show thatSuperScript III RT has the highest thermal stability among the three reverse transcriptases.Figure 9. Human decorin protein- and antibody-binding analysis. Human decorin protein, amixture of protein and antibody, and antibody alone were used in the Protein Thermal Shift assay.Data were generated on an Applied Biosystems 7500 Real-Time PCR System using continuous rampmode at 1% ramp rate from 25 C through 99 C. Data were analyzed using the Protein Thermal ShiftSoftware.
Summary: Protein Thermal Shiftsolutions for fast and efficientprotein melt analysisThe Protein Thermal Shift Softwareand reagent kits enable easy ProteinThermal Shift analysis in a highthroughput manner, requiring 1 µg ofsample per well, and at a cost that issignificantly lower than those of othermethods. The software and reagentscan be used for high-throughputscreening of proteins to identifyligands, mutations/modifications,or buffer conditions that increasemelting temperature (Tm) and therelative stability of proteins. Thisapplication can also screen antibodyligand binding as part of antibodydevelopment, or be used to assessprotein preps for contaminants oraggregated protein.The Applied Biosystems ProteinThermal Shift Dye Kit is available ina 2,000 reaction size and includesthe Protein Thermal Shift buffer anddye. The Applied Biosystems ProteinThermal Shift Starter Kit includesthe dye and the buffer, along withthe Protein Thermal Shift controlprotein and control ligand. The starterkit is recommended for new usersto become acquainted with theapplication and software.The Protein Thermal Shift Softwarewas developed specifically foranalyzing protein melt fluorescencereadings directly from real-time PCRinstrument files. Different proteinswill have different profiles, each witha unique melt-curve shape, slope,signal-to-noise ratio, and Tm range.The Protein Thermal Shift Softwaregenerates one or multiple Tm valuesfrom these curves by the Boltzmann fitTm and the derivative curve methods.The software allows quick comparisonof Tm differences between assayconditions or ligands added to asample, relative to a reference sample.The Protein Thermal Shift assay canbe run on any real-time PCR system,such as the Applied BiosystemsQuantStudio 3, 5, 6 Flex, and 12K FlexReal-Time PCR Systems.
Compatible instrumentsSystemSystem featuresCat. No.QuantStudio 3 RealTime PCR System Capacity: 96-well plates, 0.1 mL tubes or 0.2 mL tubes Fast block: yes Colors: 4A28136A28137QuantStudio 5 RealTime PCR System Capacity: 96-well plates, 0.1 mL tubes or 0.2 mL tubes, 384-well plates Fast block: yes Colors: 6A28138A28139A28140QuantStudio 6 FlexReal‑Time PCR System Capacity: 96-well, 384-well Fast block: yes Colors: 544856974485694QuantStudio 7 FlexReal‑Time PCR System Capacity: 96-well, 384-well, TaqMan Array micro fluidic cards Fast block: yes Colors: 6 (21 filter combinations)44856984485696QuantStudio 12K FlexReal-Time PCR System Capacity: 96-well, 384-well, TaqMan Array micro fluidic cards,OpenArray plates Fast block: yes Colors: 6 (21 filter combinations)44710504471134Ordering informationProductSizeCat. No.Protein Thermal Shift Dye Kit2,000 rxns4461146Protein Thermal Shift Starter Kit100 control rxns (protein and ligand) 2,000rxns Protein Thermal Shift dye and buffer4462263Protein Thermal Shift Software1 kit (10 licenses)4466037Protein Thermal Shift Software Additional license(separate software purchase required)1 license4466038Protein Thermal Shift SoftwareUser Documentation Set1 User Guide and3 Quick Reference CardsFor the latest product and application information, go tothermofisher.com/proteinmeltFor Research Use Only. Not for use in diagnostic procedures. 2016 Thermo Fisher Scientific Inc. All rights reserved. All trademarksare the property of Thermo Fisher Scientific and its subsidiaries unless otherwise specified. COL02064 0616
Thermal Shift Software show the Boltzmann (upper panel) and derivative (lower panel) melt profiles of buffer A (pH 5.5), B (pH 6.0), C (pH 7.0), and D (pH 7.5). Data were collected at 1 C intervals from 25 C through 99 C on the Applied Biosystems StepOnePlus Real-Time PCR System and analyzed using the Protein Thermal Shift Software.