Transcription
MJW Investment SurveyJune 202219 July 2022
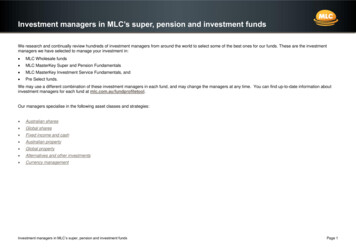
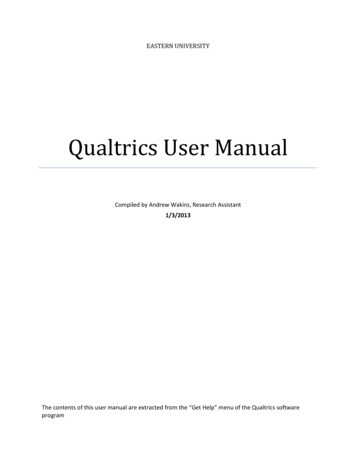
MJW Investment Survey – June 2022Market Returns19 July 15.5-13.5-3.7-11.1-12.0-3.7-16.0-13.2-10.1S&P/NZX 50 (including ICs)S&P/ASX 200 - unhedgedMSCI World - local currencyMSCI World - 100% hedgedMSCI World - unhedgedMSCI Emerging Markets - unhedgedS&P/NZX All Real Estate (including ICs)FTSE EPRA Nareit Global Real EstateDow Jones Brookfield Global InfrastructureBloomberg NZBond Composite 0 YearS&P/NZX NZ Government BondBloomberg Global Aggregate BondFTSE World Government BondS&P/NZX Bank Bills 90-DayNZD / USDNZD / 9-8.6-10.3-8.8-8.90.8-11.0-2.9Returns (%) for the June 2022 quarterAustralasian sharesGlobal shares (unhedged)Property/infrastructureCashFixed interest50-5-10-15-20Core NZSharesAustralasian AustralianSharesShares(NZD)Core rgingMarketsNZ Listed Global Listed Global ListedPropertyProperty InfrastructureMedian ManagerMarket commentaryWhile the sudden reversal of fortunes in the first quarter of2022 may have come as a shock, this trend only worsened inthe second quarter of the year. Many of the same themes thatemerged in the first quarter have continued to weigh oninvestment markets in the months that followed.For instance, the events in Ukraine which triggered a spike inoil prices in early 2022, have continued to create heightenedvolatility in prices.130Brent Crude Oil Index2S&P Global US Manufacturing PMI706560551104510040903580302015We have seen similar movements in gas and other energyprices, with European markets understandably being themost affected. The European Council called a special councilmeeting in May, at which point a decision was made to greatlyreduce reliance on Russian oil. The combined strain fromenergy prices has proven a challenge for many companies.CashIn the USA, manufacturing remained robust during the earliermonths of 2022, only beginning to show signs of more seriousweakness in May. The level of the US Manufacturing PMIdropped to 52.4 in June (a level below 50 indicates thatmanufacturing is contracting) and this is now the slowest rateof expansion seen since August 2020.5060Core Global Govt. GlobalBondsBondsBenchmark12070Core NZBonds2016201720182019202020212022Discussions about the prospect of a recession in the USA andelsewhere have grown louder, with many predicting atechnical recession (defined as two consecutive quarters ofnegative growth) later in 2022.Notably, the yield curve for US bonds began to invert thisquarter. This is an indicator that expectations for long-termyields are low and is famously seen as an indicator of animpending recession. Shorter-term interest rates arecurrently higher due to expectations of shorter-term increasesto central bank policy rates. The relatively low longer-termrates reflect concerns around the prospect of a recession.WTW Alliance Partner
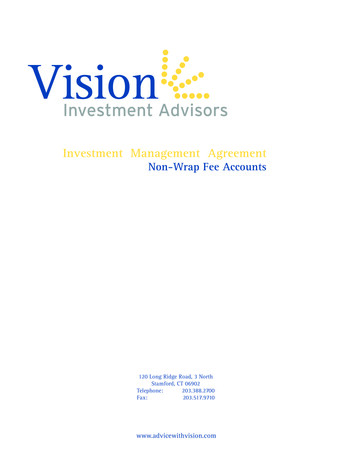
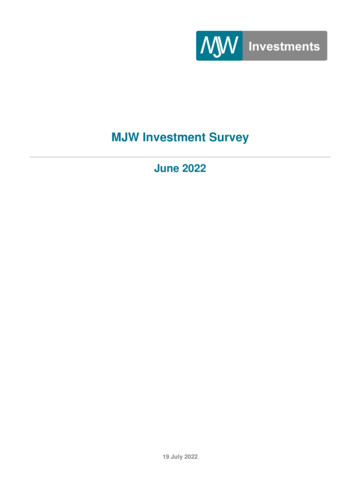
MJW Investment Survey – June 202219 July 2022While the causality behind the relationship between yieldcurves and recession is not totally clear, there is no denyingthe correlation exists. The following chart, with data to 2020,shows this. The grey shaded areas indicating times ofrecession.terms). The depreciating New Zealand dollar cushionedthese losses for unhedged investors (they saw their portfoliosdown 6.2%). Thus, on a 50% hedged basis, global shareswere roughly comparable to domestic shares.Among the latest in this quarter’s dire news was the revelationthat the New Zealand economy had contracted 0.2% duringthe first three months of the year. This came as a shock tomarkets, the consensus being for a flat GDP figure, with somecommentators even expecting growth in the first quarter.New Zealand began the quarter with its Official Cash Ratesitting at a modest 1%. Since then, we have seen threeincreases, each of 0.5%, in April, May and July, to reach2.5%. While this was the level to which the rate settled in2009 in the aftermath of the global financial crisis (and whereit spent most of the next seven years), it is expected that wewill see a lift of at least 1% from here before the Reserve Bankconsiders easing policy.Source: Federal Reserve Bank of ChicagoAll of the recessionary periods on the chart are associatedwith an inversion of the 2/10 year yield curve (i.e. where theblue line drops below zero). These inversions have beencommonly seen just before a recessionary period occurs.The differences in outcomes between the various sharemarket sectors have been significant over the 2022 calendaryear to date. Looking at developed markets, the worstoutcomes came from the consumer discretionary, informationtechnology and communication services sectors, each downaround 30%. The exception to this year’s negativity was theenergy sector. In developed markets, supply-drivenpressures have left the sector up around 16%. Other moredefensive sectors such as utilities and consumer staples sawsmaller losses than the broader market, each down around10%.In the aftermath of the 2020 Covid-19 induced shock, hugespeculative appetites saw valuations of many “growth” stockssoar. This quarter has been the latest in a series of reversalsof this trend and the most decisive victory of value investingover growth in many years. Value has won back 17.1%versus growth in 2022 so far.OutlookAll considered, the losses suffered from the main assetsectors have been sizeable in 2022 so far, as illustrated in thefollowing chart.Year to date return (%) at 30 June 20220-4-8-12-16-20NZ shares AustraliansharesGlobalsharesNZ bondsGlobalbondsAustralia’s return has been better than New Zealand andglobal markets more generally. Australia’s large allocation tothe energy and materials sectors provided a boost as at theend of May, but it is now also sitting in negative 19Jun20Jun21Jun22New Zealand was by no means immune to the widespreadlosses that we have witnessed this quarter. The market wasdown 10.2%. However, this compares favourably to the14.3% loss from global developed markets (in local currency3In the UK, the Bank of England also increased its policy ratetwice over the quarter to finish at 1.25%. And the Bank ofCanada lifted its rate by a full 1% in July.Indices: S&P/NZX 50, S&P/ASX 200 (LCT), MSCI World (LCT), BloombergNZBond Composite 0 Year, Bloomberg Global Aggregate BondQuarterly excess returnMSCI World Growth over Value (%)15We have seen similarly dramatic shifts in others’ policy ratesover this quarter. The target range for the US Federal FundsRate was raised by 0.5% in May. The Federal Reserve thenoutdid itself by lifting the range a further 0.75% the followingmonth. Consensus is for another increase of at least 0.5% tooccur in July.It is important to remind ourselves in these times that stockmarket prices are a forward-looking indicator. Much of thenegativity we have seen regarding the prospect of arecession is already baked into the prices we are seeingtoday. Should the damage to the economy be no worse thanwhat we are expecting today, it is possible that there may belittle to no further losses as a result.A similar argument can be made in fixed income sectors. Theexpectation that interest rates will continue to climb sharply isalready reflected in the price that investors are willing to payWTW Alliance Partner
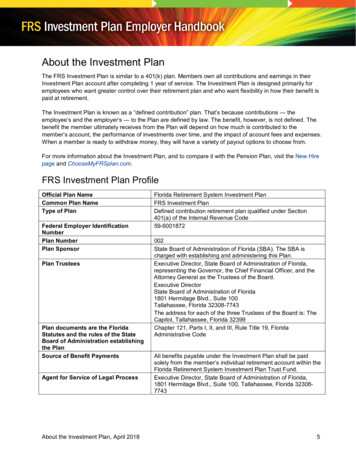
MJW Investment Survey – June 202219 July 2022for bonds. It is only if expectations shift towards even fasterinterest rate hikes that we would expect bonds to sufferfurther capital losses.5Yield (%) on Bloomberg Global Aggregate Index(NZ dollar hedged)4While the losses endured should not be understated, theyshould of course be considered in the context of the unusuallyhigh returns in recent years. The following chart shows thecumulative return on the MSCI World Index since 2000. Wehave used a logarithmic scale to track share performanceversus the exponential growth that is expected of the sector.3210MSCI World (local currency, log scale)Inflation has been a key theme in financial markets overrecent quarters as local and foreign price indices reachedtheir highest year-on-year changes in decades.CPI growth (%) in June years862000200420082012201620204The MSCI World index remains above the long termexponential growth trendline, highlighting the strength ofrecent market returns from the Covid-19 nadir.As the tightening phase of the monetary policy cycleaccelerated, bondholders have suffered significant losses.The following chart shows the Reserve Bank’s Official CashRate forecast in its recent Monetary Policy Statements.RBNZ OCR Forecasts (%)5202013 2014 2015 2016 2017 2018 2019 2020 2021 2022AverageRBNZ target rangeThe recent spike in inflation is plain to see. However, inflationin the years prior has been low and, interestingly, the currentten-year average is in the middle of the Reserve Bank’s 1%to 3% per annum target range.4The prevailing consensus from our major banks and otherforecasters is for a gradual decline in inflation, reaching 2%by the end of 2024. The aggregate expectation for inflation isnevertheless close to 3.0% per annum over the next fiveyears.3210Dec-19 Dec-20 Dec-21May-22Feb 22Dec-22Nov 21Dec-23Aug 21Dec-24May 21Over the year to May 2022, OCR expectations rose by asmuch as 288 basis points. However, it is now interesting thatthe RBNZ is forecasting the OCR to fall from 2024.Some solace to the pain induced by mark-to-market losses,is that the outlook for fixed interest returns is the brightest ithas been in years. The implied three-year return from cashusing the May 2022 pathway is 3.6% per annum. Thefollowing chart shows the steady increase in yield on theheadline global bond index, now 4.15% at the end of June.As investment consultants, we maintain and update ourcapital markets assumptions to ensure they remains suitablefor prevailing market conditions. As a consequence of thehigher yield environment, we expect significantly betterresults from a conservative fund going forward compared towhat has been achieved recently. On the other hand, withhigher prevailing interest rates and expectations of lowerlevels of quantitative easing, our future expectations forgrowth funds are slightly more muted compared with whathistorically has been garnered.In spite of the recent and ongoing turbulence in 2022, ourview is that there are certainly reasons to be more optimisticabout markets in the coming years. For investors who areaiming to deliver results over the medium to long term, ouradvice is to remain focussed on this longer timeframe and toavoid making significant changes to overarching strategy inresponse to these shorter-term challenges.– William Nelson, written 19 July 20224WTW Alliance Partner
MJW Investment Survey – June 202219 July 2022Wholesale Fund Returns (before fees and tax)New Zealand &Australian SharesAus. w eight/ hedging %New ZealandANZIAustralasian₁ANZINZ Shares₁CPFTrans-Tasman₁DEVNZ Equity₁FISNZ Grow th₁HAMAustralasian Eq₁MAMNZ Equities₁MERTrans-Tasman₁MNTAustralasian Equity₂MNTNZ SRI₁MQNZActive₁MQNZEthical Leaders₁NAMCore₁NAMSRI₁NAMNZ Equity₁QAMNZ Equity₂RUSNZ Shares₁SALTDividend Appreciation₂SALTNZ Share Plus₂TRUESG Australasian Shares₃M edianAustralasian*DEVDividend Yield₂ ₄DEVTrans-Tasman₂ ₄DEVSustainability₂ ₄FISTrans-TasmanHAMEquity IncomeHAMFocus₂ ₄MAMTrans-Tasman₂ ₄M edianOtherANZIDEVMAMNAMPIEPIEPIEPIEQAMEquity Selection Fund ₂ ₄Absolute₂ ₄Dynamic (small cap)ConcentratedAustralasian DividendAustralasian Grow thAustralasian Grow th 2Emerging CompaniesAltum /1008/00/00/02/1002/00/01/10020/100NZ FUM mIndicesS&P/NZX 50 (including ICs)₁S&P/NZX 50 (excluding ICs)₂S&P/NZX 50 Portfolio (including ICs)₃S&P/ASX 200 (NZD)₄S&P/ASX 200 (AUD)₄1 year%Rk3 years% paRk5 years% paRk10 years% (7)9.513.814.524.613.4-M edianIndexed/Sm art BetaHAMNZ Index SharesMQNZPassive₁SMSNZ Top 10SMSNZ Top 50₃SMSDividend3 m (5)(11)(2)(3)(1)(4)(2)(5)(3)(2)(1)(4)5 years 12.512.513.516.515.4Where possible, the subscript numbers show the correspondence between funds and their benchmark indices.*The funds in this section adopt a variety of hedging positions on the Australian portion of their benchmarks.5WTW Alliance Partner
MJW Investment Survey – June 2022Australian SharesANZIFISMAMMQNZQAMSCHM �Australian₁Australian₁19 July 2022NZ FUM m962291228300741IndicesS&P/ASX 200 (NZD)₁S&P/ASX 200 (AUD)Property &Infrastructure3 m (3)(2)-9.8-11.9NZ FUM1 2)-3.7-6.53 m onths3 years% paRk6.49.27.35.25.87.26.8(4)(1)(2)(6)(5)(3)5.33.31 year5 years% paRk5.811.88.06.59.18.0(5)(1)(3)(4)(2)8.06.83 years10 years% paRk6.711.07.67.68.37.6(5)(1)(4)(3)(2)7.79.35 years5 years 30.10.1(5)(1)(2)(4)(3)16.515.410 years5 years pa m%Rk%Rk% paRk% paRk% paRkVol.IR₁RkAustralasian Listed PropertyANZINZ Property SecuritiesANZITrans-TasmanHAMReal EstateMNTAustralasian PropertyMQNZPassive AustralasianNAMNZ PropertySALTWholesale PropertyM )(4)Australasian Direct PropertyFISNZ PropertyMERTrans-TasmanTRUNZ PropertyM .117.013.4Global Listed PropertyANZI100% hedgedMER139% hedgedMQNZ100% hedgedRUS100% hedgedSALT100% hedgedM edianGlobal Listed InfrastructureANZI100% hedgedFSI100% hedgedMER139% hedgedMQNZ100% hedged*RUS100% hedged*SALT100% hedgedM edianOtherFISMERProperty & InfrastructureGlobal Unlisted InfrastructureIndicesS&P/NZX All Real Estate (including ICs)₁FTSE EPRA Nareit Global Real EstateDow Jones Brookfield Global (1)12.612.912.814.814.012.612.8Where possible, the subscript numbers show the correspondence between funds and their benchmark indices.*See notes on page 11.6WTW Alliance Partner
MJW Investment Survey – June 2022Global Shares(unhedged)19 July 2022Em ergingm arkets %NZ FUM m3 m onths%Rk1 year%Rk3 years% paRk5 years% paRk10 years% 141,7461,3261,1557138300620421-5.2 (8)-5.3 (9)-4.8 (6)-2.3 (2)-6.0 (11)-4.4 (5)-1.2 (1)-3.0 (3)-5.0 (7)-3.8 (4)-5.9 (10)-4.8-2.0 (3)-7.5 (10)-5.8 (8)0.3 (1)-4.1 (6)-7.3 (9)-0.6 (2)-3.9 (5)-3.8 (4)-4.9 (7)-7.6 (11)-4.111.4 (2)9.3 (9)8.1 (11)10.2 (4)9.8 (5)9.3 (8)10.4 (3)9.7 (6)13.0 (1)9.7 (7)8.8 (10)9.712.5 (2)11.2 (4)10.4 (10)11.1 (6)10.5 (9)11.4 (3)11.1 (5)10.8 (7)13.6 (1)10.7 (8)11.113.613.411.513.013.311.713.613.35 years paVol. M edianNorthern Trust/VanguardInt'l Eq₂MFSInternationalQuantitative₂Share Plus₁Core Global₁Ethical Leaders₂Multi-Manager₂Global ZPZENAM edianValueLSVValueValueValueEquityArrow streetOrbisGlobal Value 912.211.9Grow thANZIANZIARTFISFRKFSIHAMKIWIMAGMAMMQNZNAMSALTWELM edianFranklinVontobelGlobal Opportunities₂International Select EquitiesGlobal Plus EquityStew art InvestorsT Row e PriceThematic₂GlobalGlobal SelectGQG/VontobelGlobal Shares₂Sustainable Quality₂Grow lobal Equities IndexMQNZNWINSMSTotal WorldIndicesMSCI World - 0% hedged₁MSCI World - local currencyMSCI ACWI - 0% ere possible, the subscript numbers show the correspondence between funds and their benchmark indices.7WTW Alliance Partner
MJW Investment Survey – June 2022Global SharesNZ FUM m(unhedged)Em erging m arketsARTGMOMERMQNZRUSSCMSMSIndexedVAMM edianOtherMERMER19 July 20220000Small CompaniesLow VolatilityCom m SSCH85 OceansGlobal Equity FundActive Grow thLiquid AlternativesGMAFMulti-StrategyOptionGrow th UK & EuropeGlobal Grow th 2Multi-Asset Grow th (AUD)Real Return1 year%Rk3 years% paRk5 years% paRk10 years% paRk5 years paVol. 8-0.9-16.03.25.65.712.2IndicesMSCI Emerging - 0% hedged₁Alternatives/Other3 m onths%RkNZ FUM(7)(3)(4)(6)(5)(8)(2)(1)3 m 1 22.93.1(6)(7)(4)(3)(2)(8)(1)(5)3 (2)(1)5 )10 30.10.0-0.60.20.4(5)(7)(2)(4)(6)(8)(3)(1)5 years pa m%%% pa% pa% .014.313.06.96.3Volatility % paWTW Alliance Partner
MJW Investment Survey – June 2022New ZealandBonds & CashCoreANZIBTAMFISHAMKIWIMQNZNAMRUSTRUWAMCOM edianNZ Fixed PlusBond Fund₁NZ Fixed Interest₁Core Fixed₁NZ Fixed Income₁NZ Fixed Interest₁NZ Fixed Interest₁Harbour/WAMCO₁ESG NZ Bond₁NZ CoreModifiedDurationyears19 July 2022NZ FUM m3 m onths%Rk1 year%3 yearsRk% paRk5 years% pa10 years5 years paRk% paRkVol.IR1 / 923073592111170-2.3 (5)-2.1 (3)-2.6 (8)-2.8 (10)-1.8 (1)-2.2 (4)-2.3 (6)-2.4 (7)-2.1 (2)-2.6 (9)-2.3-8.4 (6)-7.4 (1)-9.0 (8)-7.9 (2)-8.4 (7)-8.1 (4)-8.1 (5)-7.9 (3)-9.1 (10)-9.0 (9)-8.2-1.3 (4)-1.4 (5)-1.5 (7)-1.2 (3)-1.2 (2)-1.8 (8)-1.1 (1)-1.5 (6)-1.8 (9)-1.9 (10)-1.41.7 (4)1.6 (5)2.0 (2)1.5 (7)1.7 (3)1.4 (8)2.0 (1)1.6 (6)1.1 (10)1.3 0.52.1CorporateANZIHigh GradeBTAMCorporate BondsHAMCorporate Bonds₃MAMTrans-Tasman CorporateNAMInv. Grade Corporate₃M .9(2)(3)(4)Short DurationHAMEnhanced CashMQNZShort DurationM .40.9CashANZIBTAMFISKIWIMQNZNAMM overnm entANZISovereign₂IndicesBloomberg NZB Composite 0 Yr₁S&P/NZX NZ Government Bond₂S&P/NZX Corporate A Grade₃S&P/NZX Bank Bills 90-Day )(1)3.52.32.82.93.22.93.54.32.80.2Where possible, the subscript numbers show the correspondence between funds and their benchmark indices.9WTW Alliance Partner
MJW Investment Survey – June 2022Global BondsModifiedDurationyears19 July 2022NZ FUM3 m onths1 year3 years5 years10 years5 years pa m%Rk%Rk% 2)(5)(8)(4)(10)(11)(6)(3)(1)(9)Governm entANZINorthern Trust/VanguardMERGlobal SovereignM (2)(1)-1.7-0.3-1.0CreditANZINorthern Trust/VanguardMERGlobal CreditM 3.0(2)(1)-2.5-1.4-1.9Short duration and otherBAMGlobal IncomeBAMSyndicated LoanDFA5 yearFISAbsolute ReturnFRKBrandyw ine GOFI₂MAMGlobal Corporate BondMERGlobal Absolute ReturnMQNZIncome esBloomberg Global Aggregate₁FTSE World Government RUM edianPIMCO₁CoreSustainability₁Global Fixed Income₁PIMCO₁Wellington₁Hunter PIMCOGlobal Aggregate₁Ethical Leaders IndexedGSAM₁GIS₁Global Bond₁ESG International Bond₁% paRk% pa1.4 (6)1.2 (9)1.5 (5)1.3 (8)1.8 (4)1.3 (7)1.8 (3)1.8 (2)1.8 (1)1.0 ere possible, the subscript numbers show the correspondence between funds and their benchmark indices.10WTW Alliance Partner
MJW Investment Survey – June 2022Diversified19 July 2022Grow th3 m onths1 year3 years5 years10 yearsAA %%Rk%Rk% paRk% paRk% paRkBalancedANZIASBFISMAMMERMQNZEthical LeadersNAMTRUM )(1)(6)(7)(3)(4)Incom eHAMMAMMNTMQNZNAMQAMM 4)10.74.77.7(1)(2)5 years paVolatility % Notes:11 Relative outperformance may be due to the different nature of the fund rather than to superior skill. Past performance is no guarantee offuture performance. Where we consider the funds have reasonably similar mandates, we group the funds and rank the performance. Differences in style andmandates will have an impact on returns. KiwiSaver fund returns are shown gross of tax and net of fees. All other fund returns are shown gross of tax and fees. KiwiSaver funds are grouped based on benchmark growth asset allocation. Actual asset allocation may differ from this. Tracking error is the standard deviation of value added. Information Ratio (IR) is value added divided by tracking error and is therefore arisk-adjusted measure of performance. FUM (funds under management) relates to the size of the locally-domiciled collective investment vehicle. It does not include any overseasfunds managed in the same strategy. Where single-manager strategies form part of a multi-manager fund, we show FUM for both separatelyeven if there is inter-funding. The numbers shown are in some cases gross equivalents of the net returns achieved by the manager. Consequently, for a tax-exemptinvestor, returns realised may be different from those shown above. In particular, funds having a New Zealand equity or property componentare shown inclusive of imputation credits, which are not available to all investors. The index applied to calculate information ratios is not in all cases the benchmark adopted by the manager for the fund. Global share results are on an unhedged basis. In some instances, currency hedging is integral to the management of the fund and theclient will not experience the results shown. The MQNZ Global Listed Infrastructure Fund was 139% hedged prior to June 2015. The Russell Global Infrastructure Fund is a blend of the AUD hedged fund prior to 1 December 2017 and NZD hedged fund post 1 December2017.WTW Alliance Partner
MJW Investment Survey – June 202219 July 2022KiwiSaver Results – Return and Risk (after fees, before tax)Returns and RiskManager12FundGrow thBM m%FUM3 m onths% Rank1 year3 years% Rank% pa Rank5 years% pa Rank10 yearsRisk pa% pa Rank 5 year 10 yearGrow th (70%-85% grow th assets)AMPGrow thANZGrow thASBGrow thBNZGrow thBoosterGrow thFisherGrow thFisher Tw oGrow thGenerateGrow thKiw i WealthGrow thMercerGrow thMilfordActive Grow thSimplicityGrow thSuperLifeGrow thWestpacGrow thM .99.912.18.79.1(9)(3)(5)Balanced (55%-69% grow th assets)AMPBalancedAMPBal. Fund No. 2AMPNikko BalancedANZBalanced Grow thASBBalancedBNZBalancedBoosterBalancedBoosterSRI BalancedFisher Tw oBalancedKiw i BalancedM te Balanced (45%-54% grow th assets)AMPMod. Balanced77547.0ANZBalanced2,98850.0M .71.7(2)(1)3.24.53.8(2)(1)5.37.16.2(2)(1)Moderate (30%-44% grow th assets)AMPIncome Generator3AMPModerate595ANZCons. Bal.1,467ASBModerate2,237BNZModerate665Bo
headline global bond index, now 4.15% at the end of June. Inflation has been a key theme in financial markets over recent quarters as local and foreign price indices reached . Dow Jones Brookfield Global Infrastructure -5.0 5.9 4.6 6.2 - 13.4. MJW Investment Survey - June 2022 19 July 2022 7 WTW Alliance Partner