Transcription
Travelers Analytics:U of M Stats 8053 Insurance Modeling ProblemOctober 30th, 2013Nathan Hubbell, FCASShengde Liang, Ph.D.
Agenda Travelers: Who Are We & How Do We Use Data? Insurance 101– Basic business terminology Insurance Modeling Problem– Introduction– Exploratory Data Analysis– Assignment Walk-through2
How is data used at Travelers? Loss, Premium, and Financial Data Research & Development Unstructured Traditional Actuarial Usage– Univariate analysis Includes external data– Multivariate analysis– Example: GLMs allow for a nonlinear approach in predictivemodeling. Future development– Continued use of sophisticatedstatistical methods3
Insurance 1014
Basics of InsuranceInsurance companies sell insurance policies, which are the promise to pay in theevent that a customer experiences a loss.The unique challenge in insurance is that we don’t know what the cost of insuringa customer is when we sell the policy.Example: The cost to insure an auto customerIt’s impossible to predict if someone is going to Get into an accident The type of accident (hit a telephone pole, hit another vehicle, bodilyinjury) How bad (cost) the accident will be5
Business Impact of Loss ExperienceTo estimate the cost of insuring policyholders, we must predict lossesTwo fundamental questions we must answer are:1. Ratemaking: looking to the future Setting rates for policies How much do we need to charge customers for a policy in order toreach our target profit? Basic idea: price cost profit2. Reserving: looking at the impact of past experience Setting aside reserve money How much money do we need to set aside to pay for claims?Note: We cannot precisely predict losses for each individual or business.However, if we group our customers together, we can build statisticalmodels to predict average loss over a group.6
Model Building Generalized Linear Models (GLMs) Potential response variables: Claims – Frequency (# claims / exposure) (e.g. Poisson, NegativeBinomial) Loss – Severity (loss / claim) (e.g. Gamma, Inverse Gaussian) Pure Premium Frequency * Severity loss / exposure A common link function is g(x) ln(x). Probability distribution: Tweedie Compound distribution of a Poisson claim # And a Gamma claim size distribution Large spike at 0 for policies with no claims Wide range of amount in the claims Challenges include: Variable selection Bias-variance trade-offSo what is an example of an actual modeling problem in insurance?* Source: “A Practitioner's Guide to Generalized Linear Models”7
What questions do you have about: Travelers? Insurance? Statistics at Travelers?8
Business Problem Refer to the one page hand out “Kangaroo Auto Insurance CompanyModeling Problem” for more details You, as a statistician, work for Kangaroo Insurance, an Australian insurancecompany The underwriter in your company would like you to build a pricing model (purepremium) for the auto insurance product. The pricing needs to be competitive.– accurately reflect the risk your company is taking.– enough segmentation among customers. The data from policies written in 2004 and 2005 is provided.9
Data Information Losses for each vehicle from policies written in 2004 and 2005.Each policy was written as one-year originally.There are 67,856 policies (vehicles) in the data.Ten (10) variables in the data.veh 393570.654346clm0000000010111numclaims claimcst0 veh body00 HBACK00 HBACK00 UTE00 STNWG00 HBACK00 HBACK00 HBACK00 STNWG1669.51 SEDAN00 SEDAN1806.61 SEDAN1 401.8055 HBACK21811.71 STNWGveh CFagecat2422244564442OBSTAT01101 001101 001101 001101 001101 001101 001101 001101 001101 001101 001101 001101 001101 00000000000000100000000000000
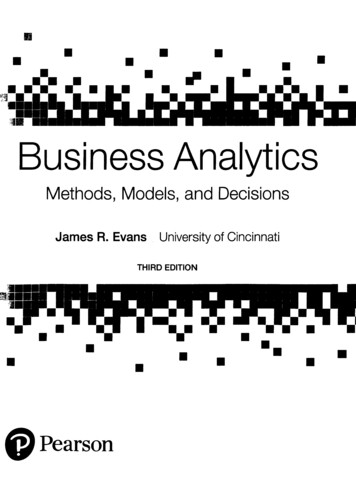
Variable Information – veh value0.2Density0.0050.11015200.3250.430350.5 vehicle value, in 10,000s, a numerical variable.05101520253035veh value11
Variable Information – .0 The covered period, in years, a numerical variable (always between 0 and 1)– The amount of time a vehicle was “exposed” to potential accidents.0.00.20.40.60.81.0exposure12
Variable Information – clm An indicator whether the vehicle/driver had at least one claim during thecovered period, 0 No, 1 Yes. 4,624/67,856 had at least one claim.0100002000030000400005000060000Claim Occurrence0113
Variable Information – numclaims Number of claims during covered period, integer values. 4,624/67,856 had at least one claim.Number of 000060000Number Frequencof Claimsy0123414
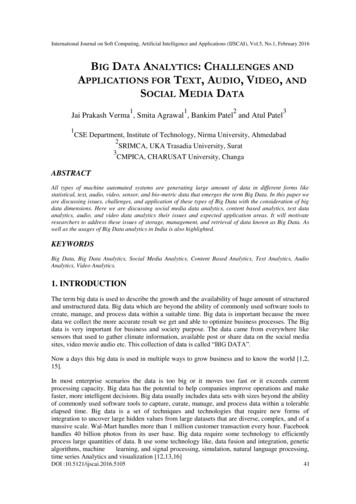
Variable Information – claimcst0 (target variable)04e-040e 00100002e-0420000Density300006e-04400008e-0450000 The total amount of the claims, in dollars, numeric values.0Total Claim Amount1000020000300004000050000Total Claim Amounts15
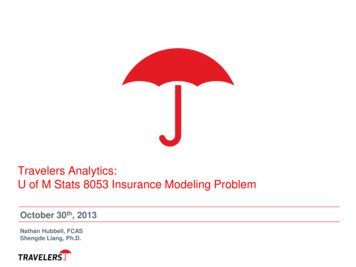
Variable Information – veh bodyCONVT convertibleHBACK hatchbackHDTOP hardtopMCARA motorized caravanMIBUS minibusPANVN panel vanRDSTR roadsterSTNWG station wagonUTE - utility05000100001500020000 The vehicle body code, a character SEDANSTNWGTRUCKUTE16
Variable Information – veh age05000100001500020000 The age group of insured vehicle, coded as 1, 2, 3, and 4, with 1 being theyoungest.1234Vehicle Age Group17
Variable Information – gender The gender of driver, F (female) or M (male)F38,603M29,2530100002000030000Gender FrequencyFMDriver's Gender18
Variable Information – area Driver’s area of residence, a character 57805000100001500020000Area CodeABCDEFDriver's Area of Residence19
Variable Information – agecat Driver’s age category, coded as 1, 2, 3, 4, 5 and 6, with 1 being the er's Age Cateogry20
Questions May Be Asked What models did you fit?– what is your assumption(s)?– is your assumption reasonable?– how do you check your assumption(s)? What is the impact of each variable?– are all variables equally important?– if not, which ones are more important? How do you measure it? How do you check your model actually works (genaralizability)?What questions do you have about the“Kangaroo Insurance Company Modeling Problem”?21
References and Resources Contacts– Nathan Hubbell – NHUBBELL@travelers.com– Shengde Liang – SLIANG@travelers.com Travelers Careers– http://www.travelers.com/careers– Actuarial and Analytics Research Internship and Full Time A Practitioner's Guide to Generalized Linear Models– on et al Edition 3.pdf22
Travelers Analytics: U of M Stats 8053 Insurance Modeling Problem October 30th, 2013 Nathan Hubbell, FCAS Shengde Liang, Ph.D. 2 Agenda . Business Impact of Loss Experience To estimate the cost of insuring policyholders, we must predict losses Two fundamental questions we must answer are: 1.