Transcription
Annual Retail Propane Sales ReportU.S. Odorized Propane Sales by State and End-Use SectorReporting Year: 2019Conducted by ICF on behalf of the Propane Education & ResearchCouncilPublished: December 2020ICF / Propane Education & Research Council – Annual Retail Propane Sales Report 2020 Propane Education and Research CouncilReporting Year 2019
COPYRIGHT 2020 Propane Education and Research Council (PERC) All rights reserved.Important Notice:This report and information and statements herein are based in whole or in part on information collecteddirectly from companies that participated in the Annual Retail Propane Sales Report data collection process.ICF used additional public and private information, including internal databases and modelling, in order toensure the highest degree of accuracy in the end results of the report. However, with any survey-basedreport there is a degree of uncertainty related to the final reported information for states and end-usesectors.ICF worked with PERC to define the parameters of the data collection process and estimation of the U.S.total retail propane sales covering the Calendar Year 2019. This information was collected from participatingretail propane companies from April 2020 to July 2020. ICF determined and developed the Annual RetailPropane Sales Report data verification, quality control, and estimation methodology based on industry bestpractices and ICF’s internal expertise in an effort to minimize any bias or estimation errors arising from thecollected information. ICF makes no assurances as to the accuracy of any such information or anyconclusions based thereon.Limitations of Liability:Review or use of this report by any party other than the client (“you”) constitutes acceptance of the followingterms. Read these terms carefully. They constitute a binding agreement between you, PERC and ICFResources, LLC (“ICF”). By your review or use of the report, you hereby agree to the following terms.You use this report at your own risk. In no event shall ICF or PERC be liable to any party as a result of useof this Annual Retail Sales Report for any direct, indirect, special, incidental, or consequential damages(including, without limitation, damages for lost profits, lost data, or business interruption), whether based onwarranty, contract, negligence, tort, or any other legal theory, even if PERC and ICF has been advised of thepossibility of such damages. Neither PERC nor ICF are responsible for typographical, pictorial or othereditorial errors. The Annual Retail Sales Report is provided AS IS.No warranty, whether express or implied, including the implied warranties of merchantability and fitness for aparticular purpose is given or made by ICF or by PERC in connection with this report.This report may not be copied in whole or in part or further distributed to anyone.ICF / Propane Education & Research Council – Annual Retail Propane Sales Report 2020 Propane Education and Research CouncilReporting Year 2019
Table of ContentsExecutive Summary . 12019 Retail Propane Sales Report . 8National Retail Propane Sales . 9State Rankings by Retail Propane Sales Metrics. 12Detailed State Level Information . 15Historical Propane Volumes . 21Non-Odorized Propane Sales Information . 22Review of Annual Retail Propane Sales Report Methodology. 23End-Use Sector Definitions . 23Overview of Report Approach . 24Outreach and Data Collection . 24Estimation of State and End-Use Retail Propane Sales . 27Retail Propane Sales Report Contact Information . 30ICF / Propane Education & Research Council – Annual Retail Propane Sales Report 2020 Propane Education and Research CouncilReporting Year 2019
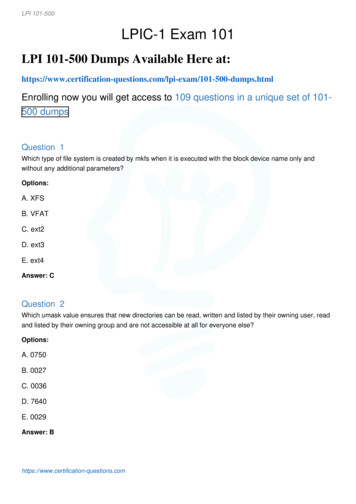
Executive Summary2019 U.S. Retail Propane SalesIn 2019, U.S. retail (odorized) propane sales totaled 10.15 billion gallons, an 8.9% year-over-yearincrease from the 9.3 billion gallons sold in 2018. Total sales for 2019 were 16.4% above the tenyear average of 8.7 billion gallons of odorized propane volumes per year.1While propane sales in the four major regions (Midwest, South, West, and Northeast) increased in2019 relative to 2018, most of the increase was concentrated in the Midwest. The 2019 regionalpropane sales totals are shown in the figure below.2019 U.S. Retail Propane Sales by Region12.0009.32Billions of .572.0001.711.661.69MidwestSouth2018 SalesWestNortheastU.S. Total2019 SalesThe majority of the increase in gallon sales occurred in the residential sector. Propane sales in theresidential market increased from 5.184 billion gallons in 2018 to 5.851 billion gallons in 2019. Theincrease in residential propane sales in 2019 relative to 2018 was driven by two primary factors:1) The growth in residential propane sales observed in 2019 was driven by an increase in thenumber of households using propane as the primary space heating fuel. Data from the U.S.Census American Community Survey (ACS) indicates that the number of households usingpropane as the primary space heating fuel increased by 240,251 households, or about 4.2percent, relative to 2018, from 5,689,915 households to 5,930,166 households. Theincrease in propane heated households was spread across the Northeast, Midwest, andWest regions. The growth in these regions was partially offset by a decline in propaneheated households in the Southern region.The data on the growth in propane space heating households reported in the ACS isconsistent with the increase in the number of residential customer accounts reported by thepropane industry in the ICF/PERC survey. The ICF survey reports an increase in residentialretail propane accounts from 11.9 million in 2018 to 13.0 million in 2019.1Odorized propane volumes are estimated based on PERC Assessment Collections.ICF / Propane Education & Research Council – Annual Retail Propane Sales Report 2020 Propane Education and Research CouncilReporting Year 20191
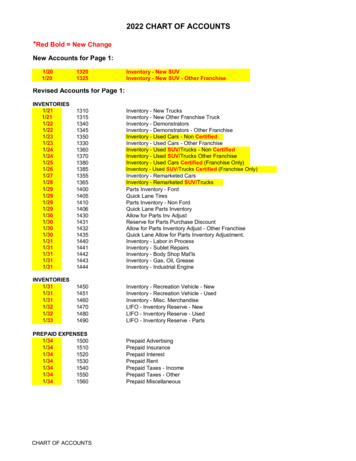
Propane Heated Households by Region7,000,000Count of westSouthWest2019U.S. Total2) While the overall average annual temperature for the contiguous U.S. was above the 20-yearaverage and slightly warmer than 2018, the regional weather patterns differed significantly.Much of the country was colder in 2019 than in 2018, supporting a year-over-year increase inwinter heating load. The West Coast and Rocky Mountain states were much colder than2018, with HDD’s increasing by 8%. The Midwest and Northeast states were moderatelycolder in 2019 than in 2018.Change in Residential Sales per Account from 2018 to -10.0%400-15.0%200Change in HDDsGallons per Account1,000-20.0%-25.0%0NortheastMidwest2018 Residential Sales per Account2018 to 2019 Change in HDDsSouthWestU.S. Average2019 Residential Sales per AccountICF / Propane Education & Research Council – Annual Retail Propane Sales Report 2020 Propane Education and Research CouncilReporting Year 20192
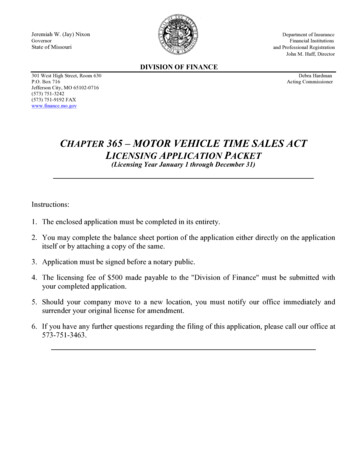
However, the states in the Southern region were generally warmer than 2018, with much ofthe South region significantly warmer. On a national level, the warmer weather in the Southoffset the colder weather in other regions.3) Extreme weather also impacted demand in other sectors. In 2019, there were 14 weatherand climate disaster events, including three inland flooding events, eight severe stormevents, two tropical cyclone events (Dorian and Imelda) and one wildfire event. However,these weather events had less of an impact on propane sales than the two major hurricanes,Florence and Michael, and other major weather events in 2018, leading to a 12 percentdecline in propane cylinder market sales from 354 million gallons in 2018 to 310 milliongallons in 2019.4) Finally, reported sales for internal combustion applications increased by 25.5%, from479 million gallons to 601 million gallons. In 2019, the internal combustion sectoraccounted for 5.9% of total odorized propane sales, up from 5.1% in 2018. The growthin reported propane sales for internal combustion applications was due in part to betterreporting by the propane industry. A significant number of companies split out internalcombustion sales from cylinder sales and from industrial sector sales for the first time.There also appeared to be about 7 percent organic growth in internal combustion salesby the companies reporting sales in the same format in both 2018 and 2019.2019 U.S. Retail Propane Sales by RegionBelow is a brief summary for each region of major year-on-year changes that would influence retailpropane sales:The Midwest accounted for 40.7% of total U.S. propane sales in 2019, a small relative increasefrom the 38.5% share of U.S. propane sales in 2018. Total odorized propane sales in the regionincreased from 3,591 million gallons in 2018 to 4,132 million gallons in 2019. Most of the salesgrowth occurred in the residential and agricultural sectors. Residential sales totaled 2,629 million gallons in 2019, up from 2,271 million gallons in 2018.Most of the increase in residential sales can be attributed to an increase in propane heatedhouseholds. According to ACS data, the number of propane heated households in theregion increased by 5% compared to 2018. Winter weather in 2019 was moderately colder than 2018. Annual HDD’s increased by 0.6%in Midwest, leading to a slight increase in propane demand for space heating. Agriculture sales totaled 696 million gallons, representing 17% of total regional sales. Thisrepresented an increase of 149 million gallons relative to 2018, primarily due to an increasein grain drying demand.ICF / Propane Education & Research Council – Annual Retail Propane Sales Report 2020 Propane Education and Research CouncilReporting Year 20193
Midwest Region's Propane Sales by Sector5,00030%Million Gallons4,00017.7%15.7%3,00020182019Change from 2018 to 201915.1%20%15%10%5.2%5%2,0000%-3.8%-5%1,000Annual Change (%)25%27.2%-10%-15.4%-15%0-20%Residential Commercial InternalCombustionTotalThe South accounted for 25.8% of total U.S. propane sales in 2019, down from 26.9% in 2018.Despite the decline in the share of total U.S. propane sales, total propane sales in the regionincreased modestly, from 2,508 million gallons in 2018 to 2,613 million gallons in 2019. At 1,261 million gallons in 2019 residential sales accounted for 48% of the region’s propanesales. Winter weather in much of the South was much warmer in 2019 than in 2018. Compared to2018, annual Heating Degree Days (HDD) in the South region decreased by 7.4%. Thewarmer winter resulted in a significant decline in propane sales for space heating for severalstates in the region. The number of propane space heated households in the South declined by 1.5% comparedto 2018. Propane continued to lose market share to electricity for household space heating,although the decline was slower in 2019 relative to the previous five years.South Region's Propane Sales by Sector3,000Million Gallons9.2%2,0001,50020%2019Change from 2018 to 20194.2%2.6%-1.7%0%-13.0%1,00050010%-10%Annual Change (%)2,50030%24.3%2018-20%-25.4%-30%0Residential Commercial ICF / Propane Education & Research Council – Annual Retail Propane Sales Report 2020 Propane Education and Research CouncilInternalCombustionTotalReporting Year 20194
In 2019, the West region accounted for 1,713 million gallons of propane sales, or 16.9% of total U.S.propane sales. 2019 sales increased by 9.4% relative to 2018. Most of the increase occurred in theresidential sector. Residential sales increased from 736 million gallons in 2018 to 876 million gallonsin 2019. In 2019, winter weather was much colder in most of the western region than in 2018, leadingto a significant rebound in propane space heating demand. According to ACS data, the number of households using propane for primary space heatingincreased in the region by 4% relative to 2018.West Region's Propane Sales by SectorMillion Gallons1,50020182019Change from 2018 to 9.2%-10%-20%500Annual Change (%)2,000-30%-41.6%-40%-50%0Residential Commercial InternalCombustionTotalThe Northeast region accounted for 16.7% of total U.S. propane sales in 2019. Propane sales in theregion reached 1,690 million gallons in 2019, an increase of 36 million gallons, or 2.1%, relative to2018. Residential sales account for 64% of total sales in the Northeast, with commercial volumesaccouting for an additional 26%. According to the ACS data, the northeast region continued to experience rapid growth in thenumber of propane heated households, with space heating households increasing by 14%relative to 2018.ICF / Propane Education & Research Council – Annual Retail Propane Sales Report 2020 Propane Education and Research CouncilReporting Year 20195
Northeast Region's Propane Sales by SectorMillion Gallons1,50020182019Change from 2018 to .5%-10%-20%500Annual Change (%)2,000-30%-37.2%-40%0-50%Residential Commercial InternalCombustionTotalTop Ranked States by Retail Propane SalesIn 2019, the top 10 states by total retail sales accounted for 48.1% of total U.S. propane sales, whilethe remaining 40 other states and District of Columbia totaled 51.9% of total sales. The table belowshows the top 10 ranked states by total retail propane sales and average gallons sold per account.Top 10 States by Total 2019 Retail Propane Sales (Millions of Gallons) Michigan continues to be the top ranked state in total propane sales with 587 million gallonsin sales in 2019. It was also the top ranked state in residential sales, with 463 million gallonsfor 2019.Minnesota passed California to be the second ranked state by total sales in 2019, with 559million gallons. Minnesota was ranked second in the agriculture sector and third in theresidential sector, which totaled 139 and 331 million gallons, respectively.California was the third ranked state by total sales in 2019, and was the top ranked state forthe commercial, cylinder markets, and internal combustion sector, which totaled 145, 37, and63 million gallons, respectively.ICF / Propane Education & Research Council – Annual Retail Propane Sales Report 2020 Propane Education and Research CouncilReporting Year 20196
Iowa continues to be the fourth ranked state by total sales in 2019. Sales in 2019 increasedto 544 million gallons. The state remained the top ranked state for agriculture sales andranked sixth in the residential sector. Illinois was the fifth ranked state by total sales in 2019 and was ranked fifth in the residentialsector and ranked third in the agriculture and internal combustion sectors, which totaled 292,104, and 37 million gallons, respectively.2019 U.S. Retail Propane Sales by End-Use SectorThe table below shows total U.S. retail sales, and the corresponding number of retail accounts andaverage gallons sold per account. In 2019, the survey indicated about 13.0 million total residentialaccounts and about 2.3 million propane accounts in the other sectors. The table below shows totalU.S. retail sales, the number of retail accounts, and average gallons sold per account.Summary Information of Total U.S. 2019 Retail Propane Sales by End-Use Sectors The Residential sector accounted for 58% of total sales, or 5,851 million gallons. The sectoraveraged sales of 449 gallons per account. The Commercial sector accounted for 20% of total sales, or 1,990 million gallons. Thesector averaged sales of 1,914 gallons per account. The Agriculture sector accounted for 11% of total sales, or 1,085 million gallons. The sectoraveraged sales of 2,060 gallons per account. The Industrial (Non-forklift) sector accounted for 3% of total sales, or 312 million gallons.The sector averaged sales of 2,301 gallons per account. The Cylinder Markets sector accounted for 3% of total sales, or 310 million gallons. Thesector averaged sales of 859 gallons per account. The Internal Combustion sector accounted for 6% of total sales, or 601 million gallons. Thesector averaged sales of 2,498 gallons per account.ICF / Propane Education & Research Council – Annual Retail Propane Sales Report 2020 Propane Education and Research CouncilReporting Year 20197
2019 Retail Propane Sales ReportThe Annual Retail Propane Sales Report is a joint initiative between ICF and the Propane Education& Research Council (PERC). The 2019 Retail Propane Sales Report is the second annual reportcompleted by ICF and is used to determine the odorized propane sales to end-use sectors for thecalendar year 2019. This report is the only source of state-level end-use sector sales information forodorized propane.Reason for the Retail Propane Sales Report:Information for state level and end-use odorized propane sales is required by PERC in order to fulfilspecific requirements of the 1996 Propane Education and Research Act (PERA). Under PERA, 20%of assessment collections are eligible for rebate back to the states. The allocation of the rebatebetween the states is determined by the percentage of the total odorized propane sales in eachstate. PERA also places limits on the share of total PERC investment in the on-road market to nomore than the share of the total propane market used for motor vehicle combustion and sets aminimum of 5% of total assessments that must be allocated to the agricultural sector. This report isthe only available source of retail propane sales by state and end-use sector.The allocation of odorized propane sales between the states has a significant impact on the PERCallocation of expenditures. Each state's allocation of rebate funds is based on the latest retail salesdata for residential, commercial, industrial, internal-combustion engine fuel, agricultural uses, andsales to retail dispensers that are compiled using the responses to this report. As a result, thereporting of sales volumes from propane retailers is a critical component of the PERC budgetingprocess.Confidentiality Guidelines for Participant Responses:ICF and the PERC understand that the U.S. retail propane market is a highly competitive market.Any and all company and contact information that is collected as part of this annual report will beheld under ICF’s Confidential Information data handling guidelines.Proprietary or Confidential Information provided by respondents and developed by ICF as part of the2019 Retail Propane Sales Report has been clearly labeled and identified as ConfidentialInformation and stored in a manner consistent with ICF’s standard practices. ConfidentialInformation shall not be disclosed by ICF to third parties or used for anything other than the statedpurpose of completing the Annual Retail Propane Sales Report.State level total and end-use sector sales information has been published only where sales andaccount information were provided by three or more participant respondents. For state level end-usesector information without three or more respondents, sector and state information has not beenprovided. Areas where this information has been withheld intentionally have been marked with a ‘*’.Data OwnershipThe Annual Retail Propane Sales Report was prepared for PERC by ICF. As the contractor of thisreport, ICF will keep all proprietary company information collected during the data collection processin accordance with the company’s Confidentiality Guidelines. PERC retains all ownership rights tothis publication and its underlying data.ICF / Propane Education & Research Council – Annual Retail Propane Sales Report 2020 Propane Education and Research CouncilReporting Year 20198
National Retail Propane Sales2019 U.S. Retail Propane Sales Summary by Sector (Millions of Gallons)2019 U.S. Retail Propane Accounts by Sector (Number of Accounts)2019 U.S. Retail Propane Sales per Accounts by Sector (Gallons per Accounts)ICF / Propane Education & Research Council – Annual Retail Propane Sales Report 2020 Propane Education and Research CouncilReporting Year 20199
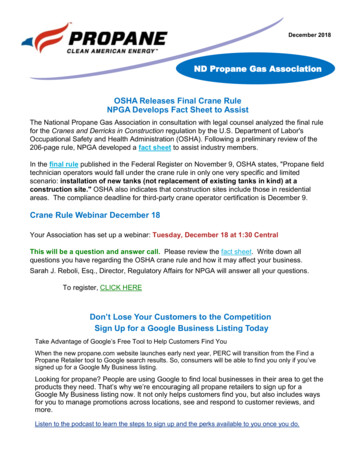
2019 Total U.S. Retail Propane Accounts bySector1816Millions of AccountsInternal Combustion14Cylinder ommercial2Residential02019 Number of Accounts2019 Average U.S. Retail Propane Sales per Account3,0002,498Gallons per orklift)ICF / Propane Education & Research Council – Annual Retail Propane Sales Report 2020 Propane Education and Research CouncilCylinderMarketsInternalCombustionReporting Year 201910
2019 U.S. Retail Propane Sales by Census Division and Sector (Millions of Gallons)2019 U.S. Retail Propane Sales by PADD and Sector (Millions of Gallons)ICF / Propane Education & Research Council – Annual Retail Propane Sales Report 2020 Propane Education and Research CouncilReporting Year 201911
State Rankings by Retail Propane Sales Metrics2019 Total Propane Sales: Top 10 StatesShown by Millions of Gallons Sold2019 Residential and Commercial Propane Sales:Top 10 States Shown by Millions of Gallons Sold2019 State Rankings: Retail Propane Sales (Millions of Gallons)ICF / Propane Education & Research Council – Annual Retail Propane Sales Report 2020 Propane Education and Research CouncilReporting Year 201912
2019 State Rankings: Retail Propane Sales per Account (Gallons per Account)ICF / Propane Education & Research Council – Annual Retail Propane Sales Report 2020 Propane Education and Research CouncilReporting Year 201913
ICF / Propane Education & Research Council – Annual Retail Propane Sales Report 2020 Propane Education and Research CouncilReporting Year 201914
Detailed State Level Information2019 U.S. Retail Propane Sales Summary by State and Sector (Millions of aColoradoConnecticutDelawareDistrict of kaNevadaNew HampshireNew JerseyNew MexicoNew YorkNorth CarolinaNorth DakotaOhioOklahomaOregonPennsylvaniaRhode IslandSouth CarolinaSouth est VirginiaWisconsinWyomingU.S. TotalResidential Commercial 4357117252232648122993101423325169251310ICF / Propane Education & Research Council – Annual Retail Propane Sales Report 2020 Propane Education and Research CouncilInternalTotal 69812744963113245202534886510,148Reporting Year 201915
2019 U.S. Retail Propane Accounts by State and Sector (Number of Accounts)2019 aColoradoConnecticutDelawareDistrict of kaNevadaNew HampshireNew JerseyNew MexicoNew YorkNorth CarolinaNorth DakotaOhioOklahomaOregonPennsylvaniaRhode IslandSouth CarolinaSouth est VirginiaWisconsinWyomingU.S. ,91920,65031717,375892526,744Industrial Total - Cylinder Total - 853135,418ICF / Propane Education & Research Council – Annual Retail Propane Sales Report 2020 Propane Education and Research 4215,342,571Reporting Year 201916
2019 U.S. Retail Propane Sales per Accounts by State and Sector (Gallons per Accounts)2019 Gallons per ColoradoConnecticutDelawareDistrict of kaNevadaNew HampshireNew JerseyNew MexicoNew YorkNorth CarolinaNorth DakotaOhioOklahomaOregonPennsylvaniaRhode IslandSouth CarolinaSouth est VirginiaWisconsinWyomingU.S. TotalResidential 51,8285042,8122,9311,3702,060IndustrialTotal - Cylinder Total - 742,3912,0152,4321,6732,4541,7645,0092,301ICF / Propane Education & Research Council – Annual Retail Propane Sales Report 2020 Propane Education and Research ,093878661Reporting Year 201917
2017-2019 U.S. Retail Propane Sales Summary by State and Sector (Millions of sasCaliforniaColoradoConnecticutDelawareDistrict of waKansasKentuckyLouisianaMaineM
from the 38.5% share of U.S. propane sales in 2018. Total odorized propane sales in the region increased from 3,591 million gallons in 2018 to 4,132 million gallons in 2019. Most of the sales growth occurred in the residential and agricultural sectors. Residential sales totaled 2,629 million gallons in 2019, up from 2,271 million gallons in 2018.