Transcription
Sumelahti et al. The Journal of Headache and 0) 21:118The Journal of Headacheand PainRESEARCH ARTICLEOpen AccessMy Migraine Voice survey: disease impacton healthcare resource utilization, personaland working life in FinlandMarja-Liisa Sumelahti1*, Markku Sumanen1, Merika S. Sumanen1, Samuli Tuominen2, Johanna Vikkula2,Sanna M. Honkala2, Stina Rosqvist3 and Minna A. Korolainen3,4AbstractBackground: A global My Migraine Voice survey was conducted in 31 countries among 11,266 adults who sufferedfrom 4 monthly migraine days (MMD). The aim of this retrospective observational survey-based study was to analysethe country specific results in Finland in order to understand the impact of migraine based on disease severity.Methods: The included participants (3%, n 338/11,266) were stratified by mean MMDs into 4 MMD 8 (n 133),8 MMD 15 (n 139) and MMD 15 (n 66) subgroups. Comorbidities, migraine-related emotional burdenand impact on daily living and work productivity and activity impairment (WPAI) were assessed. Subgroupanalysis on healthcare resource utilization (HCRU) due to migraine was assessed by visits to healthcarepractitioners (HCPs) during the past 6 months and by hospitalizations and emergency room (ER) visits duringthe past 12 months. The group difference was tested using the one-way ANOVA and for categorical variablesusing the Chi-squared test. The association between HCRU and MMD and number of comorbidities wasassessed using negative binomial regression analysis.Results: Mean age was 44 years, 93% were women and 67% (n 227) were employed. Chronic migraine (CM,MMD 15) was reported in 19.5% of the respondents. The negative impact on daily functioning andemotional burden increased significantly by migraine frequency. Mean number of comorbidities was 2.4, andmean number of HCP visits during the previous 6 months was 5.9. Increase in migraine frequency andcomorbidities was associated with higher HCRU. Eighty-eight percent of the respondents reported negativeimpact on working life and 52% experienced overall work productivity impairment. Over previous month, the meannumber of missed working days for all respondents was 2.8 days of which 54% were paid sick leave days, and in CMup to 6.0 days and 30%, respectively. Both absenteeism and presenteeism were higher in the CM group.Conclusions: The emotional and functional burden was high, and the societal burden increased by frequency andseverity of migraine, as shown by higher HCRU and reduced work productivity. There is a need to improve quality ofcare in migraine and improve migraine management related issues in both healthcare and society in Finland.Keywords: Migraine, Burden, Finland, Work productivity, Quality of life, Healthcare resource utilization* Correspondence: marja-liisa.sumelahti@tuni.fi1Faculty of Medicine and Health Technology, Tampere University, Tampere,FinlandFull list of author information is available at the end of the article The Author(s). 2020 Open Access This article is licensed under a Creative Commons Attribution 4.0 International License,which permits use, sharing, adaptation, distribution and reproduction in any medium or format, as long as you giveappropriate credit to the original author(s) and the source, provide a link to the Creative Commons licence, and indicate ifchanges were made. The images or other third party material in this article are included in the article's Creative Commonslicence, unless indicated otherwise in a credit line to the material. If material is not included in the article's Creative Commonslicence and your intended use is not permitted by statutory regulation or exceeds the permitted use, you will need to obtainpermission directly from the copyright holder. To view a copy of this licence, visit http://creativecommons.org/licenses/by/4.0/.The Creative Commons Public Domain Dedication waiver ) applies to thedata made available in this article, unless otherwise stated in a credit line to the data.
Sumelahti et al. The Journal of Headache and Pain(2020) 21:118BackgroundThe estimated global prevalence of migraine is 10–15%and prevalence of chronic migraine is 1.4–2.2% [1, 2].Migraine is a disabling neurological disorder that placesa significant burden on the individuals but also on theirfamily members and the whole society [3]. The impactof migraine extends beyond the physical pain of amigraine attack and it can substantially affect multipleaspects of life including day-to-day functioning, overallquality of life (QoL), emotional and social aspects suchas family, work and social relationships [3, 4].Migraine can be broadly classified by attack frequencyinto episodic migraine (EM) and chronic migraine (CM)according to the International Classification of HeadacheDisorders, 3rd edition (ICHD-3) [5]. EM is defined asfewer than 15 monthly migraine days (MMD), and CMas 15 or more days with headache, of which 8 are considered migraine days. The classification has been challenged by a recent study arguing that patients sufferingfrom high frequency migraine (MMD 8) should be considered to have CM [6]. Regardless of EM or CM, thedisability and burden of migraine increases along withincreasing headache frequency [7, 8], and increasingnumber of migraine days equally enhances the risk forchronification of migraine [9].Surveys across European and other countries haveshown the impact of migraine on work, healthcareresource utilization (HCRU) and QoL, among otherdomains [10–15]. So far, My Migraine Voice surveyconducted in 2017–2018 is the only survey revealing theglobal impact of migraine, including Finland [16]. Therehas been a paucity of data for the spectrum of migraineimpact in the Nordic countries. Earlier studies fromFinland have shown an almost 2-fold increase in healthcarevisits and sick leave days when compared to age-matchedcounterparts [17–19]. In Sweden, a recent national patientorganization survey showed a correlation between the lossin yearly quality adjusted life-years (QALYs) and increasingnumber of migraine days indicating that productivity lossrepresented a significant part of costs in migraine [20].The aim of the present study was to focus on domainsassessing the burden of migraine among Finnish MyMigraine Voice survey respondents. In order to furtherunderstand the burden of migraine in a Finnish subcohort, disease severity was assessed as MMD frequencyand impact of reported comorbidities.MethodsMy Migraine Voice was a cross-sectional multi-countryonline survey conducted in 31 countries from September2017 to February 2018 [16]. The Finnish participantswere recruited via the Finnish Migraine Association(Patient Advocacy Group, PAG) and existing onlinepanels from GfK Health (Growth from Knowledge,Page 2 of 11https://www.gfk.com/). Informed consent was obtainedprior to the survey. Survey data were handled confidentially, and anonymity of the participants was maintainedthroughout the study. Ethics committee review was notrequired due to the research format of the study.The Finnish cohort consisted of 345 respondents whowere determined as eligible based on their responses tothe screening questions. Inclusion criteria were selfreported physician diagnosed migraine based on theICHD-3 criteria, frequency of 4 monthly migraine daysover the previous 3 months and age 18 years. Respondents without migraine diagnosis (n 7) were excludedfrom the current data-analysis.Study designThis was a global, retrospective observational surveybased study, which consisted of closed questions. Thequalitative survey was performed using online bulletinboards (OBBs) to identify the key issues relating to theprofessional as well as daily life experienced by individuals living with migraine. The details of the OBB surveymethods has been previously published [21, 22]. Thefinal survey comprised of 87 questions which includedfive country-specific questions. The questionnaire wasdeveloped by a multi-professional steering committee,consisting of migraine specialists, a specialist nurse andpatient support group leaders. Detailed outcome parameters assessed in the survey including sociodemographicfactors, impact on working productivity and healthcareutilization is described in detail in a report by Martellettiet al. [16]For the purposes of this study, information wasincluded for age, gender, family and employment status.Migraine history, frequency and severity of attacks,medication use and reported comorbidities were included. Information on healthcare resource utilizationbased on reported number of migraine-related visits tohealth care practitioners (HCP) in the past 6 months aswell as emergency room (ER) visits and inpatient days(IPD) in the past 12 months were also included. The impact of migraine on work productivity and daily activitiesamong employed respondents was evaluated by usingthe Work Productivity and Activity Impairment (WPAI)questionnaire [23] and complemented with additionalwork-related questions. The impact of migraine on dailyfunctioning and the migraine-related emotional burdenwas evaluated by responses relating to the experience ofliving with migraine as well as the impact on social life.Before the analyses were carried out the participantswere categorized into three groups: 4 MMD 8, 8 MMD 15 and MMD 15, according to the reportedmean monthly migraine days (MMDs) (determined bythe self-reported number of migraine days in the past 3months and divided by 3).
Sumelahti et al. The Journal of Headache and Pain(2020) 21:118Data analysisFor the continuous and normally distributed variables,the difference in mean between the groups was testedusing the one-way ANOVA. Normality was assessedusing histograms and Shapiro-Wilk test (data notshown). If the normality assumption was violated, thenon-parametric Kruskall-Wallis test was utilised instead.For the categorical variables, the difference in groupsizes was tested using the Chi-squared test when all thegroup sizes were above 5. If at least one group size was 5 the Fisher’s exact test was utilised instead. If thenumber of rows in the contingence table became 7,Monte Carlo simulation with 2000 replicates was utilisedto compute the p-values for the Fisher’s test. A significance level of 0.05 was assumed throughout the analysis.When assessing the number of sick-leave days fromwork due to the migraine during the previous 1 month,the questionnaire option “I did not work at all duringthe previous one month” was set to equal to 23 missedworkdays. When analysing questions related to theseverity of pain, daily functioning and emotional burden,the questionnaire options were re-categorized into twolevels instead of the original five. The options “a lot” or“often” and “always” were grouped as one level, whilethe rest, i.e. “no impact”, “slight impact”, and “moderateimpact”, were grouped as another level.The work productivity and activity impairment relatedto a specific healthcare problem [24] (WPAI-SHP) wasevaluated only for the respondents who reported currentemployment (n 227). The WPAI outcomes are expressedas percentages of impairment, as higher WPAI percentageindicates greater impairment and lower productivity.The relationship between healthcare resource utilizationand selected predictors, i.e. age, gender, MMDs and thenumber of comorbidities, was assessed using regressionanalysis. The dependent variables, i.e. the number of HCPvisits, ER visits and inpatient days, were over-dispersedand therefore, the negative binomial regression analysiswas performed.All analyses were conducted using R (version 3.6.2) [25].ResultsPatient demographics and clinical characteristicsThe total number of respondents was 345, of which 338fulfilled the inclusion criteria. The number of respondentsin subgroups according to the self-reported average number of migraine days experienced in the previous 3 monthswere 133 (39.3%) for 4 MMD 8 and 139 (41.4%) for8 MMD 15 corresponding to EM, and 66 (19.5%) forMMD 15 corresponding to CM [5].The demographics of the cohort and subgroups areshown in Table 1. The majority of the respondents livedin South and West Finland (78%). The mean age was 44years, the majority were female (93%), had childrenPage 3 of 11(66%) and reported a family history of migraine (86%),with no significant difference between the subgroups.Seventy-six percent of the study participants reportedmigraine for 16 years or more. The respondents recruitedvia PAG (n 257, 76%) reported having migraine significantly longer times as compared to those recruited via GfKHealth (N 81, 26%) (data shown in Additional file 1).The mean number of reported comorbidities was 2.4.Comorbidities were reported to have been diagnosedafter the first migraine attack in a majority of cases(Additional file 3). The most common comorbiditieswere allergies (34%), obesity (28%), chronic gastrointestinal diseases (23%), insomnia or sleep disorder (21%)and chronic pain (19%). No distribution differencebetween subgroups was observed.The HCP responsible for treating migraine in the 4 MMD 8 subgroup was most often a general practitioner (GP) (37%) and in the MMD 15 a neurologist(47%).Reported migraine medications are shown in Table 2.Majority (94%) reported use of acute medication, whichhad mainly been prescribed by their treating physician(98%) and complemented by over-the-counter medication (OTC) (43%). Triptans and pain relievers were mostcommonly used (81% and 80%, respectively) and the usewas similar in all subgroups. Thirty percent of the respondents reported using complementary non-pharmaceuticaltherapies.Prophylactic treatment typically included only onemedication (Additional file 4) whereas attack treatmentwas most often a combination of two or three medications, and use of different combinations differed significantly between MMD groups. Majority of cases (69%)were totally or somewhat satisfied with their currentacute treatment in all subgroups (Additional file 5).Minority of respondents were able to define the durationof use of their current acute medication.Prophylactic medications used in Finland included oralmedication and injectable onabotulinum toxin A (indication in CM), excluding candesartan (off-label) [26]. Atotal of 83% reported at least one prescription forprophylactic medication during their migraine historyand 77.6% of them reported one to six medicationswitches. The number of prophylactic medications washighest in MMD 15 group (94%, p 0.01) where up to45% had switched the medication 6 times or more. Inthis cohort onabotulinum toxin A was most commonlyused in MMD 15 group and the observed use in otherMMD subgroups may indicate a transformation of CMto EM over the treatment period.General satisfaction to the current prophylactic medication showed different distribution in subgroups andwas lowest in MDD 15 group (Additional file 5). Sixteen questions evaluated the satisfaction for prophylactic
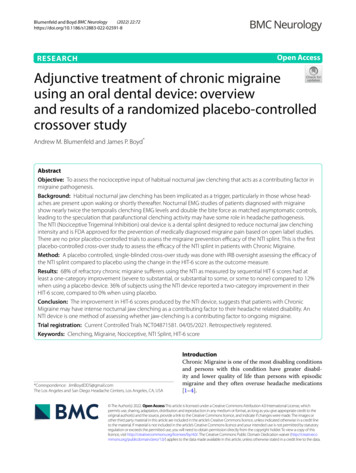
Sumelahti et al. The Journal of Headache and Pain(2020) 21:118Page 4 of 11Table 1 Demographics among respondents stratified by mean monthly migraine days (MMDs)Overall4 MMD 88 MMD 15MMD 15N33813313966p-valueAge (mean (SD))43.6 (11.5)43.4 (11.5)43.4 (11.2)44.6 (12.1)Mean headache days incl. Migraine(mean (SD))12.4 (6.1)8.2 (4.2)12.5 (4.0)20.6 (4.4) 0.0010.3390.724Gender (%)Female314 (92.9)123 (92.5)132 (95.0)59 (89.4)Male24 (7.1)10 (7.5)7 (5.0)7 (10.6)227 (67.2)92 (69.2)97 (69.8)38 (57.6)0.1800–5 years16 (4.7)5 (3.8)7 (5.0)4 (6.1)0.3666–15 years73 (21.6)36 (27.1)26 (18.7)11 (16.7)16 or more years249 (73.7)92 (69.2)106 (76.3)51 (77.3)Chronic pain (%)79 (23.4)22 (16.5)36 (25.9)21 (31.8)0.037Cardiometabolic disorders (%)141 (41.7)62 (46.6)51 (36.7)28 (42.4)0.250Mental health-related (%)118 (34.9)42 (31.6)49 (35.3)27 (40.9)0.427Other (%)180 (53.3)68 (51.1)74 (53.2)38 (57.6)0.692General practitioner111 (32.8)49 (36.8)48 (34.5)14 (21.2)0.007Neurologist111 (32.8)31 (23.3)49 (35.3)31 (47.0)Other16 (4.7)6 (4.5)6 (4.3)4 (6.1)EmployedTime being affected by migraine (%)ComorbiditiesResponsible HCP for treating migraine (%)Myself instead of any HCP77 (22.8)41 (30.8)26 (18.7)10 (15.2)No one23 (6.8)6 (4.5)10 (7.2)7 (10.6)Age and mean headache days are presented as mean / SD (standard deviation) and other variables as absolute number and percentage of respondents.Grouped comorbidities are presented in more detail in the Additional file 2HCP healthcare practitionermedication, reported in 37.0% (N 125/338). Users in allsubgroups reported improved control over migraines intotal of 39.2% and improved quality of life in 48.8%.Dissatisfaction in current prophylactic medicationswas evaluated in nine questions, reported in 25.9% (N87/338). The causes concerned mainly the lack of efficacy (58.6%) and side-effects (44.8%), which results weresimilar in all subgroups.than 60% of the respondents reported that they had tocancel plans due to migraine and that migraine interfered with daily activities and ability to think clearly.Trouble sleeping, thoughts of hopelessness, helplessnessor frustration and fear of migraine attacks were frequently reported. Both emotional reactions and problems in daily functioning showed different distributionin subgroups, difference was significant.Impact on severity of pain, daily functioning andemotional burdenImpact on working lifeThe negative impact of migraine on daily functioningand the emotional burden of migraine over the previous1 month are described in Table 3. In all subgroups themean severity of pain was high, 7.5–7.8, assessed by painseverity scale from zero to 10. Majority of cases (75%)reported spending long periods of time in darkness orisolation.Significant impairment was observed in quality of lifedomains, resulting in a negative impact of migraine ondaily functioning and emotional reactions. Overall, moreSixty-seven percent (n 227) of the respondents werefully or part-time employed or entrepreneurs. A highproportion (90%) reported that their current employer isaware of the migraine, whereas only 46% of the employers offered support to the migraine patients.Eighty-eight percent of the survey participants reported that migraine had affected their overall work life(Fig. 1b). The rate differed significantly between thesubgroups (p 0.001). Mainly individuals in MMD 15group reported having lost their job due to migraine(27%, p 0.001).
Sumelahti et al. The Journal of Headache and Pain(2020) 21:118Page 5 of 11Table 2 Use of treatments among respondents overall and stratified by mean monthly migraine days (MMDs)Overall4 MMD 88 MMD 15MMD 15N33813313966p-valueUse of acute treatment (%)319 (94.4)128 (96.2)129 (92.8)62 (93.9)0.455254 (80.4)101 (78.9)109 (85.8)44 (72.1)0.074Currently used acute medication (%)Non-opioid pain relieversTriptans256 (81.0)98 (76.6)106 (83.5)52 (85.2)0.240Anti-emetics112 (35.4)41 (32.0)43 (33.9)28 (45.9)0.157Any other70 (22.2)23 (18.0)25 (19.7)22 (36.1)0.014Medicine prescribed by a doctor311 (97.5)126 (98.4)125 (96.9)60 (96.8)0.717OTC medicine138 (43.3)55 (43.0)60 (46.5)23 (37.1)0.468Currently used acute treatment (%)Non-medical complementary therapies*95 (29.8)37 (28.9)41 (31.8)17 (27.4)0.795Any other45 (14.1)15 (11.7)22 (17.1)8 (12.9)0.449281 (83.1)103 (77.4)116 (83.5)62 (93.9)0.010Ever received prophylactic prescription (%)Currently used prophylactic medications (%)Beta-blockers121 (43.1)49 (47.6)49 (42.2)23 (37.1)0.409Anti-epileptics97 (34.5)29 (28.2)47 (40.5)21 (33.9)0.157Anti-depressants56 (19.9)17 (16.5)24 (20.7)15 (24.2)0.471Onabotulinum toxin A43 (15.3)4 (3.9)17 (14.7)22 (35.5) 0.001Any other78 (27.8)29 (28.2)32 (27.6)17 (27.4)0.993Never63 (22.4)37 (35.9)18 (15.5)8 (12.9) 0.001Once21 (7.5)12 (11.7)5 (4.3)4 (6.5)Number of prophylactic treatmentswitches/failures (%)Twice29 (10.3)15 (14.6)10 (8.6)4 (6.5)3 times47 (16.7)13 (12.6)29 (25.0)5 (8.1)4 times25 (8.9)8 (7.8)9 (7.8)8 (12.9)5 times20 (7.1)4 (3.9)11 (9.5)5 (8.1)6 times or more76 (27.0)14 (13.6)34 (29.3)28 (45.2)*Not specifiedAll variables are presented as absolute number and percentage of respondentsOTC over-the-counterMore than one working day was missed due to migraine over the previous 1 month, the overall mean being 2.8 days, of which 1.5 (54%) were paid sick leave days(Fig. 1c). In MMD 15 group the average number ofmissed working days due to the migraine was higher,6.0 days, and the number of paid sick leave days wasonly 1.8 days (31%).Over the past 7 days migraine caused a reduction inworking time (absenteeism) in 11% and a reduction inimpairment while working (presenteeism) in 48% andthe corresponding rates in the MMD 15 group were24% and 55%, respectively (Fig. 1a). The overall workproductivity impairment differed significantly betweenthe subgroups being highest in the MMD 15 group(4 MMD 8: 47%; 8 MMD 15: 53%; and MMD 15:63% (p 0.01)).Fifty-three percent of the survey participants reportedimpairment in daily activities including homework,shopping and hobbies, and the outcome tended to differbetween the subgroups (p 0.06).Health care resource utilizationDuring the previous 6 months 81% reported at least onemigraine-related visit at healthcare practitioner (HCP),the mean being 5.9 visits (Fig. 2a). The number of HCPvisits was higher in the MMD 15 group compared tothe 4 MMD 8 group (p 0.001), Fig. 2a. The subgroups reported significantly different rates of visits atgeneral practitioner, neurologist, and mental healthprofessionals, including psychologist and psychiatrist(p 0.05, p 0.001, and p 0.001, respectively, Fig. 2b).
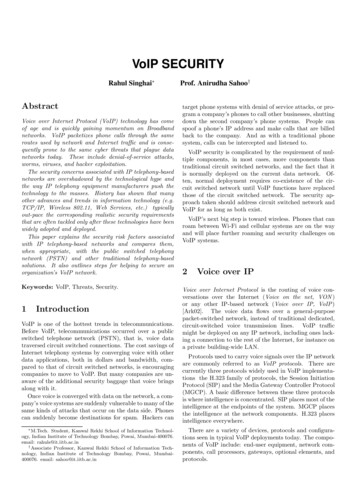
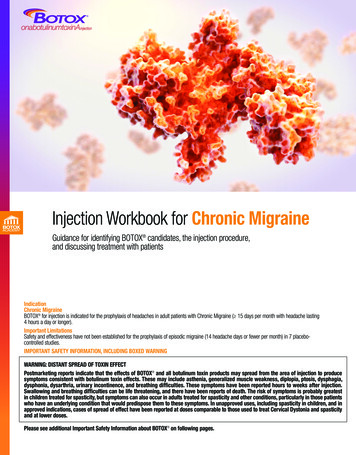
Sumelahti et al. The Journal of Headache and Pain(2020) 21:118Page 6 of 11Table 3 Daily functioning and emotional burden in migraineImpactOverall4 MMD 88 MMD 15MMD 15N33813313966p-valueSeverity of pain (range from 0 to 10; mean (SD))7.6 (1.5)7.5 (1.5)7.6 (1.5)7.8 (1.3)0.570Ever spent long periods in darkness or isolated (%)253 (74.9)94 (70.7)105 (75.5)54 (81.8)0.227198 (58.6)52 (39.1)97 (69.8)49 (74.2) 0.001Often or always feeling frustrated by migraine (%)200 (59.2)57 (42.9)99 (71.2)44 (66.7) 0.001Often or always feeling hopeless or helpless by migraine (%)123 (36.4)37 (27.8)54 (38.8)32 (48.5)0.01374 (21.9)18 (13.5)41 (29.5)15 (22.7)0.006Ever cancelled plans due to migraine (%)317 (93.8)116 (87.2)136 (97.8)65 (98.5) 0.001Migraine often or always interfering with ability to think clearlyor to focus on daily life activities and tasks (%)211 (62.4)59 (44.4)99 (71.2)53 (80.3) 0.001206 (60.9)56 (42.1)97 (69.8)53 (80.3) 0.001Level of impairment in daily activity due to migraine(needing to stop and rest “a lot” or “always”; %)220 (65.1)67 (50.4)100 (71.9)53 (80.3) 0.001Often or always lacking the energy to complete daily living orfelt fatigued (%)137 (40.5)38 (28.6)60 (43.2)39 (59.1) 0.001Ever had troubles of sleeping (%)250 (74.0)91 (68.4)102 (73.4)57 (86.4)0.025Symptom burdenMigraine decreases the quality of life(“a lot” or “significantly”; %)Emotional burdenLevel of fear of migraine attacks(“a lot” or “significantly”; %)Daily functioningLevel of migraine interference with daily activities(“a lot” or “constantly”; %)The impact of migraine on daily functioning and emotional reactions among respondents in subgroups by mean monthly migraine days (MMDs). Results arepresented as absolute number and percentage of respondentsOverall, the survey participants visited most often a GPor a neurologist (Fig. 2b).During the previous 12 months, 34% reported at leastone ER visit. There was a trend towards a highernumber of ER visits with increasing migraine frequency(Fig. 2c). Eleven percent reported having at least one inpatient day and there was no difference between the groups(Fig. 2d).The association of the HRCU, i.e. the number of HCPvisits during the previous 6 months and the number ofER visits and inpatient days during the previous 12months with age, gender, number of comorbidities, andMMDs, was assessed using multivariable negativebinomial regression. The effect of each variable on thehealthcare resource utilization was consistent throughout the HCRU types even though the impact did notreach statistical significance for all the variables (Fig. 3).A higher number of any comorbidity was associatedwith a higher migraine related HCRU. Also, highernumber of MMDs was associated with increased HCRUwith inpatient days appearing the most affected. However, the CIs are generally wider for the regression coefficients for the inpatient days as only 11% of individualshad at least one inpatient day during the previous 12months. Note that the MMD was included as a continuous variable in the regression analysis.DiscussionOur main results drawn from the Finnish subset of global My Migraine Voice survey data showed a tendencytowards worse outcomes in a wide set of domains assessing migraine burden, consistent with increase in migraine frequency detected by MMDs. The results areconsistent with observations in recently published surveys in European countries [27] and in Sweden [20].These studies, the global My Migraine Voice survey andother observations [13, 15, 28] indicate that individualswith episodic or chronic migraine report worse healthstatus and negative impact on activities and working life.The current data from Finland has not been reportedpreviously. Majority of cases in the Finnish high frequency migraine cohort were working age and women.In the total cohort, the employment rate (67%) corresponded to the European female employment rate in2018 [29]. It has been estimated that a majority, 77% to93%, of all costs associated with overall migraine population are indirect and attributed to impaired or lost workproductivity [20, 30, 31]. In our data, the commonWPAI domains assessing indirectly the economic burden of migraine showed that over half of the respondents reported overall work impairment (absenteeismand presenteeism), and the results corroborate the reported loss in overall work productivity in other studies
Sumelahti et al. The Journal of Headache and Pain(2020) 21:118Page 7 of 11Fig. 1 The impact of migraine on work productivity and activity impairment (WPAI) during previous 1 week (a), overall working life (b) andmissed amount of working days and paid sick-leave days (c) during the previous 1 month stratified by mean monthly migraine days (MMDs).WPAI was evaluated only for those respondents, who reported being currently working (N 227). The height of the bar indicates the mean whilethe accompanying whiskers in figures a and c represent the standard errors (SE). *p 0.05, **p 0.01, ***p 0.001[11–13, 15]. Loss of productivity was determined by thetotal percentage of missed time at work, which washigher than the rate reported in the European EU5 study[27]. The increase in the mean number of missed workdays was 3-fold in CM (6 days) as compared to the othersubgroups and the rates for absenteeism and presenteeism together differed between the subgroups (Fig. 1a).Furthermore, employment in CM (58%) was lower andthe rate of lost jobs (27%) higher as compared to total inother groups.The health care resource utilization and economicimpact to the healthcare system increases along with thefrequency of migraine days and the severity of migraine.Our aim was to characterize more precisely the association of migraine frequency with HCRU and facilitatethe interpretation of the regression coefficients. Ourresults indicate that a one-day increase of monthlymigraine days reflects an increase of 4%, 7% and 10% inHCP visits, ER visits and inpatient days, respectively. Moreprecisely, an increase in the number of mean monthlymigraine days e.g. from 5 to 20 days, equivalent to progression from the 4 MMD 8 group to the MMD 15 group,indicates an increase of approximately 80%, 190% and300% in HCP visits, ER visits, and inpatient days, respectively. Our results corroborate other observationsand a high need of versatile HCP consultations, whichincreased markedly with migraine frequency. The rateof respondents reporting neurologist visits varied from26% in 4 MMD 8 up to 64% in MMD 15 group.The number of visits at GP and neurologist were frequent and the reported rates were higher than reportedin European EU5 study [27] and in other Europeanstudies [32, 33]. Difference may be explained by differences in health care system and insurance practice.
Sumelahti et al. The Journal of Headache and Pain(2020) 21:118Page 8 of 11Fig. 2 Mean number of healthcare practitioner (HCP) visits during the previous 6 months (a; mean and SE), the percentage of reportedhealthcare visits (b), visits to emergency room (ER) (c) and reported inpatient days during the previous 12 months (d) stratified by mean monthlymigraine days (MMDs). *p 0.05, **p 0.01, ***p 0.001The direct costs of migraine care increase further bythe presence of comorbidities [12, 34, 35]. Our resultson increasing HCP visits, inpatient days and ER visitsby both severity of migraine and comorbidities are consistent with these studies. Mental health related issuesin migraine are frequent and lifetime prevalence ofdepression is high, reports varying from 18.8 to 42%[36–38]. The reported mental health issues in our data,most often insomnia, anxiety and depression, were reported in 35% of the total cohort and in 41% of thoseindividuals with CM. The rate was higher than for psychiatric diseases (22%) in a Swedish study, however thedirect comparisons between studies are hampered dueto use of different inclusion of the reported diseases. Astudy among Finnish migraine families demonstratedthat especially women were likely to have additionaldisorders, such as hypotension, allergies and psychiatricdisorders besides their migraine [18]. Other comorbidities frequently related to migraine are painful musculoskeletal disorders reported in a Finnish study amongworking aged suffering from migraine [39]. Among theFinnish My Migraine Voice survey pa
resource utilization (HCRU) and QoL, among other domains [10-15]. So far, My Migraine Voice survey conducted in 2017-2018 is the only survey revealing the global impact of migraine, including Finland [16]. There has been a paucity of data for the spectrum of migraine impact in the Nordic countries. Earlier studies from