Transcription
The Lithium-Ion (EV) batterymarket and supply chainMarket drivers and emerging supply chain risksApril, 2022
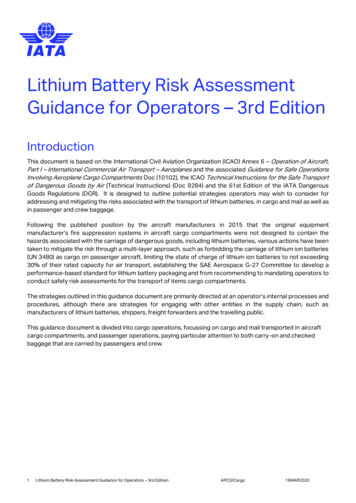
07/08-2021Drivers for Lithium-Ion battery and materials demand: Large cost reduction expectationsBatteries are key for electrification – EV battery pack cost ca. 130 USD/kWh,depending on technology/design, location, and material prices [Jul 2021 figures]Cost breakdown of pack – Prismatic NCM 8111) [USD/kWh]Note: No costs included to manage supply chain risks Reflecting traded raw material prices incl. price discount assumptionsfor high volumes without price fluctuations without VAT Sourcing all materials from China 36 GWh yearly production capacity9.8 90% OEE, 92% utilization and 5% overall scrap Fully-automated production line14.125.170.0 5% sales price margin10.715%Anode material2)14.421% Other cell material cost45.0(e.g., separator, housing)30.015.028% LiOH*H2ONiSO4*6H2O54% MnSO4*H2O17% CoSO4*7H2O15.0 CAMprocessing& raw material67% costRefinedCAMCAMMaterial Processing 4%41%21%43%CAM cost (64%)Material MaterialProSG&ACellcostcost cell duction incl. R&D margin26%Module/packproduction21%Cell production(incl. SG&A & Margin)19%OtherCell Material11%CAM processing fee (incl.margin & SGA), logistics,tariffs23%Raw / refined materials(typically terialcost(70%)Currently2-3 USD moreexpensive thanusually due tterymaterial assemblycostPackprice1) Prismatic cell (69 Ah; 3,7 V; 253 Wh), production in ChinaSource: Roland Berger Integrated Battery Cost model C32
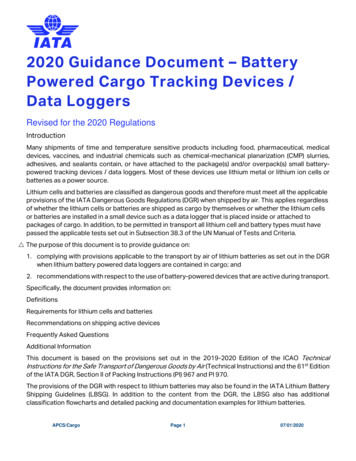
Drivers for Lithium-Ion battery and materials demand: Large cost reduction expectationsTechnology progress in batteries goes along with a broader proliferation of cellchemistries used, and expectations for further cost decreasesLiB technology roadmap – LFP and Ni-based CAM (First serial application in vehicles)AnodeVolumetric energydensity1) [Wh/L]ElectrolyteCathodeLi-Sulfur 1200Ni-richLi-Metal3) Solid"Anode(Oxide) ite Liquid Ni-Rich: NCM910,NCM90-5-5, NCMA/Silicon4)NCM811800-1000700-900600-700Advanced NCA( 3.4% Co)700-800NCA600-700NCM622350-500Adv. LFP400-55020152020202520301) Stacked electrodes; 2) First prototypes; 3) Foil or deposited; 4) Typically blends of different cathode chemistries and specifically adapted anode chemistriesSource: Expert interviews, Roland Berger Integrated Battery Cost model C3Next-Gen Technology ( 2025) Solid state: Introduction ofoxide and sulfite-based,anode-free2) and withLi-metal-coated anodes Hi-Si anodes even before LFP for lower range/A-/B-segment-,selected CV use cases, and as option Ni-rich tech. for high energy usecases NMx "in-between" NCM and LFP fromcost and energy density perspective Mn-rich technologies as cheaperalternative for volume vehicles Cell-to-Pack-technologies to in-creaseenergy density on system level Post-LiB starting before 20303
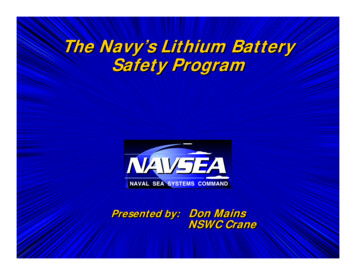
Indicative, Jul. '21 cell costsDrivers for Lithium-Ion battery and materials demand: Large cost reduction expectationsCosts can likely be reduced by USD 30-40 / kWh focusing on pack design,processes and cell chemistry – further progress requires holistic approachCost reduction levers [USD/kWh, prismatic NCM811 pack]133Module/packproduction Ni-rich materials beyond NCM811 with higher energy density orhigher voltage levels Improved cell design: thinner cans and reduced thickness ofseparator and current collector, larger cellsca. plus 8 USD/kWh CAMcosts July 2020-2021-9-12Cell production(incl. SG&A& Margin) Prelithiation to minimize non-activematerial share (OPEX) as well asformation time (CAPEX) Reducing CAPEX by implementingcontinuous mixing or increasingcoating speed Application of Industry 4.0 to predictbatch qualities and reduce failures –Increase OEE from 80% to 85%Other cellmaterialCAM(incl. SG&A& Margin)Pack costsSource: Roland Berger Integrated Battery Cost model C3Process optimizations98-14 Larger module design and reducednumber of modules per pack Change of materials for bus barsand structural parts (Alu and highstrength steels) BMS master and slave integrationImproved module& pack designsImproved cellchemistries & designsImproved pack price4
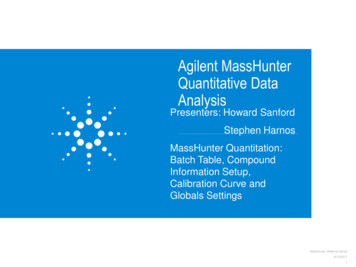
As of Oct 2021, based on OEM communicationDrivers for Lithium-Ion battery and materials demand: Electric vehicles as main driver for LiB demandAssuming communicated electrification targets, BEV/PHEV passenger car saleswould reach close to 31 mio vehicles in 2030, with 30% BEVLight vehicle powertrain shares by region [m vehicles; %]15.916.316.94% 2%12%3%3% 29%2% 28%BEV2025PHEVSource: Roland BergerMH2030FH52%23.928.86%4% 2% .194.74% 9%33%13%202120252030202120252030ICE5
Drivers for Lithium-Ion battery and materials demand: Electric vehicles as main driver for LiB demandThis level of electrification (31 million BEV) would correspond to global LiB demandof over 3,100 GWh in 2030 – announced capacity significantly higher alreadyMarket demand for LiB by application [GWh]Globalannouncedcapacity:approx4,2 .OtherCommercialvehiclesLSEV & 2WMHEV, FHEV,PHEVBEV32.7%4.2%9.4%30.3%22.4% Significant furtherreductions of packcosts (Implicit OEM-)Assumption:No significant rawmaterial costincreases BEV and ESS withover 30% CAGR24.5%31.2%779202520282030Abbreviations: ESS – Stationary Energy Storage Systems; LSEV – Low Speed Electric Vehicle; 2W – Electric Two Wheelers;MHEV, FHEV, PHEV – Mild Hybrid, Full Hybrid and Plug-in Hybrid Electric Vehicle; BEV – Battery Electric VehicleSource: Avicenne, Fraunhofer, IHS Interviews, Roland Berger6
Supply chain risks: Overview - CAM and AAM supply chain with 50% with high rislsThe dependency of the industry on LiB cells and critical battery materials createssignificant supply chain risks along the full value chainOverview LiB Cell Supply Chain (CAM/AAM only, example NCM chemistry)MiningRefining Production and processing of natural resources Long-term investment cycles, high requiredinvestment Not automotive-specific (esp. for Nickel)CAMCathode ActiveMaterialAAMAnode ActiveMaterialNi (ore/refined)Co (ore/refined)Mn liteLi2CO3LiOHxH2ONatural graphitePrecursorCathode/anode Chemical process industry Highly R&D driven for top-tier products Automotive-specific and potentially customerspecificNMC precursorNMC cathodeOther materials:(not shown) Electrolytes Separator Cell/Module Highly automated chemical(mixing, coating) andmechanical assemblyprocessBattery cellCAM and AAM: 50% of cell value!Gr anodeArtificial graphiteMain risk areasSource: Roland Berger7
Supply chain risks: Lithium and Nickel with supply and price risks – Overview on Li-Ni-Co-SupplySupply availability and price risks for Lithium, Nickel and the refined salts stem froma potential demand-supply imbalance driven by long lead times Global supply and supply characteristics for battery raw materials [kt LCE/metal eq. ,455202620282030Potential for long-term productioncapacities well over 1,500 kt LCE, butwith higher cash costs that are likely toresult in higher costs for balancedsupplyProduction lead time3):3 yrs – 7 30Higher cash-costs of new projects likelyto result in higher costs for balancedsupply, high CO2 footprint and costs forpig iron nickel conversion4) might lead tocriticalitiesProduction lead time3):6 yrs – 13 n resources in Congo (70%), Russia(4%), and Australia (4%)Cobalt powderProduction lead time3):4 yrs – 10 yrs (Cu-by product)Note: Incl. recycling. 1) LCE 99.5% ; 2) Spodumene has higher purity with less iron, magnesium & other deleterious metals 3) Start of exploration to metal delivery, "best case" – "average lead time"4) Might become cheaper via Mixed Sulphate precipitation by TsingshanSource: Roland Berger "LiB Supply-Demand Model"8
Supply chain risks: Lithium and Nickel with supply and price risks – Investment needs and significant investments along the supply chain – more than EUR 100 bn forEurope, EUR 250 bn – EUR 300 bn globally until 2030CAPEX1) estimate for cell production and NMC CAM & AAM supply chain [EUR bn for 1,000 GWh equivalent]50-55100-135Cell productionTotal supply chain 15-20 35-60CobaltLithiumNickelGraphiteMining & refiningPrecursor (P-CAM)Cathode Act. Material(CAM)Anode Act. Materia (AAM)1) CAPEX based on natural graphite, similar for artificial graphite; Note: Excluding manganese upstream value chainSource: Roland Berger – Integrated Cell-CAM-Cost-Model [C3], 20219
Illustrative & non-exhaustiveSupply chain risks: Lithium and Nickel with supply and price risks – Technology impact on Li-salt demandNi-rich cell technology is driving the Li demand, especially for LiOH, LiCO3 is stillrequired for LFP. Despite alternative technologies, limited demand ease for LithiumCell chemistry roadmap 2030 and its implications on Li precursor demandEnergydensity1) Maturity Li ich (NMC)700-900LiOHMn-rich (NMO)500-600LiCO3NCA700-800LiOHAdvanced LFP400-550LiCO3Si/C composites800-900Add. pre-lithiationPure Si 1000Add. pre-lithiationNa-ion250-400Substitution of LiSolid State 1000Li metal (predominantly)Li-Air 1000Li metal2020Low maturity level2025High maturity level1) per Wh/LSource: Expert interviews, Roland Berger Integrated Battery Cost model C32030Key Takeaways Today s lithium-ion technology is dominated byNMC/ NCA in combination w/ graphite anode To increase energy density and lower cobalt contentand BOM cost Ni-shares are constantly increasingwhich shifts the demand from LiCO3 precursortowards LiOH Co-free alternatives as LFP are entering the marketto decrease Co dependency and lower cost On anode side a shift from pure graphite towardsSi/C composites and pure Si anodes can beobserved, significantly increasing the energy densityand leading to additional Li demand for prelithiation Mass market entry for solid state technology, whichrequires Li metal anode material, not expectedbefore the end of the decade Substitution risk by sodium-ion technologyexpected in ESS storage application w/ lower energydensity requirements and possible later in theautomotive segment10
Supply chain risks: Lithium and Nickel with supply and price risks – Deemand shift towards spodumene and LiOHFor Lithium, spodumene sources become much more important due to shorter leadtimes and higher purity that is needed to produce Ni-rich CAM, using LiOHDifferent sources for battery grade lithiumBrineSpodumeneRecycling Brine is pumped to the surface and concentrated Li found in hard rock forms in crystals that areby evaporation in a succession of artificial ponds,hosted in Pegmatites which form when mineraleach one in the chain having a greater lithiumrich magma intrudes into fissures in continentalconcentrationplates After a few months to about a year, depending These pegmatites host a mineral calledon climate, a concentrate of 1 to 2% Li is furtherspodumene which contains the lithiumprocessed in a chemical plant Li is extracted from spodumene by fusing in acid45%Global lithium supplyTonnes required for 1 t750 tonsof battery-grade LiLow - Higher amounts of Fe, Mg or otherPuritydeleterious materials within the 0.5%remaining in refined LiTime to move into prod.Long Up to 95% of lithium and other critical materialsare recovered from spent li-ion batteries andtreated before reintroduction into the supply chain Increasingly considered as it reduces constraintsimposed by materials scarcity and enhancesenvironmental sustainability (lower energy consumption, lower water use, lower SOx emissions)55%250 tons28 tons of spent lithium-ion batteriesHigh – requisite for usage in Ni-richmaterialsHighShort – Esp. for pegmatite-based projectsShortHigh-techn. requiredProcessing timeWeather dependentYesLongNoShortNoShortYesNoNoCapital intensityHighLowLowOperating costsLowHighLowSource: Benchmark Mineral Intelligence, Argone National Laboratory's ReCell Center, Secondary research, Roland Berger11
Supply chain risks: Lithium and Nickel with supply and price risks – Hi concentration of Lithium mining companies and operationsLithium production is highly concentrated – Three operations concentrated morethan half of the current production (2020)Lithium production breakdown by operation [kt LCE; 2020]Greenbushes88.0Salar de Atacama70.0Mount Marion59.8Salar de Atacama42.0Bald Hill35.6PilgangooraSalar de Hombre MuertoSource: S&P Global, Desk research, Roland Berger26.819.8Mt Cattlin16.0Altura14.1Cauchari-Olaroz14.0Chaerhan Lake13.5Others14.8Mine typeShare of ne3.4%Brine3.4%Brine3.3%3.6%12
Supply chain risks: Lithium and Nickel with supply and price risks – Price impact of raw materialsBattery raw material prices have been subject to strong fluctuation – Substantialupwards pressure especially after COVID-19 recovery due to supply imbalanceSpot prices for battery raw materials in China, 2017-2022 (Feb.) [USD/kg]1)'01/21-'01/226056Change [%]'01/21-'01/22Lithium carbonate743%Chinese market prices [USD/ kg]524844Lithium hydroxide504%Cobalt sulfate134%40363228242016128Nickel sulfateManganese sulfate40Jan 18Jul 18Jan 19Jul 19Jan 20Jul 20Jan 21Jul 21Jan 22Jul 2259%64% Battery material marketprices reached all-timehigh in 2022, due to– Recovery from COVID-19drives demand, especiallyin China– Announced capacityexpansions fell shortwhile supplying countriesstill suffer from COVID-19 Price increases affect allmarket participants, andthe production costs (incl.tariffs and logistics) aredecisive to be competitive1) Battery grade materialsSource: Interviews with market participants, ICCSINO, iFind, Roland Berger13
Supply chain risks: Lithium and Nickel with supply and price risks – Price impact of raw materialsConsequently, also Chinese P-CAM and CAM spot prices increased significantlywithin the last yearChinese material market prices for P-CAM ands CAMChinese P-CAM material market prices [USD/ kg]Chinese CAM material market prices [USD/ kg]Change 01901/01/2020NMC 811 P-CAMNMC 622 P-CAM01/01/2021Lithium hydroxideLithium carbonateSource: Interviews with markets participants, iFind, ICCSINO, Roland ge [%]'01/21-'01/2260%82%60%214%01/01/2020NMC 811 [polycrystal]NMC 622 [monocrystal]01/01/202101/01/2022NMC 622 [polycrystal]LFP14
The Lithium-Ion (EV) batterymarket and supply chainPart 2: Risk mitigation and stakeholder strategies
Part 2: Recognize the impact of EoL recycling on criticalmaterials supplyComprehend the impact of vertical integration,regionalization and co-location of pCAM-, CAM- andcell production on costs and CO2 emissionsGain insight into vertical integration strategies ofleading playersUnderstand strategic implications for OEMs, cell- andCAM suppliers, mining companies and legislators16
Indicative estimates as of Nov '21Battery recycling: Impact on supply chainNot taking into account supply from LiB-EoL recycling, demand-supply situationwould be even tighter – especially also in Cobalt and NickelRoland Berger supply – demand forecast (excl. EoL recycling of LiB's) [mill. metric tons]Lithium (LCE)1)LiNickel (metallic equivalent)2)Ni320.060.110.07 -0.18-0.381-0.7900.170.06 -0.03 -0.14 -0.13 -0.23-1-22020 2022 2024 2026 2028 2030-3Demand SupplyDemand SupplySupply vs. demand (total)Gross Demand (LiB)2020 2022 2024 2026 2028 2030Demand (rest)43210-1-2-3-4Cobalt (metallic equivalent)Co0.30.20.030.030.01 -0.01-0.020.1-0.050.0-0.1-0.22020 2022 2024 2026 2028 2030-0.3Demand SupplyPotential virgin material supply (incl. LiB scrap recycling)1) Supply until 2025 based on planned/announced mining and refining capacities. New processed volume after 2025 increases by the average (absolute) increase for the 2019-2025 period as new mining projects are launched to keep up withdemand; 2) Includes intermediate and battery gradeSource: Roland Berger Integrated LiB Supply-Demand-Database17
Battery recycling: Regulatory frameworkGovernments are aiming for circular economy and battery recycling regulations,that also ask for minimum recycled material sharesProposed new EU battery directive1)Mandatory recycling content in new batteriesExtended Producer ResponsibilityArticle 8 proposes the mandatory recycled content in industrialbatteries, electric vehicle batteries and automotive batteriesArticle 47 proposes the Extended Producer Responsibility forproducers of batteries which include obligation to organize andfinance activities for: From January 2027 EV batteries that contain cobalt, lithium ornickel in active materials shall be accompanied by technicaldocumentation on recycled material content From January 2030 EV batteries shall contain the followingminimum recycled material shares in each model and batch:– Cobalt: 12%– Nickel: 4%– Lithium: 4% From January 2035 EV batteries shall contain the followingminimum recycled material shares in each model and batch:– Cobalt: 20%– Nickel: 12% Collection of waste batteries Subsequent transportation Treatment and recycling of waste batteriesArticle 49 proposes rules for collection of waste EV batterieswhich include obligation to: Take back waste batteries free of charge and without anyobligation from end user to buy new batteries Take back all batteries of the respective type that they havemade available on the marketArticle 55 sets collection rates of waste portable batteries butcurrently excluding waste EV batteries (no targets set yet).– Lithium: 10%1) Final regulation not defined yet – Dates and values subject to changeSource: European Commission18
Illustrative example for passenger carsBattery recycling: Definition and feedstocksBattery recycling in the regulation refers to the recovery of materials such as Nickel,Cobalt and Lithium from end-of-life batteries – recycling from scrap important earlierCircular concepts for batteries: Re-Use, re-manufacturing and re-cyclingFirst utilizationphaseRecyclingBattery packremovalRecycling is required to recover raw materials fromthe battery through a safe process.Closed loop recycling refers to the recycling ofbatteries and the use of those recycled metals asinput for battery productionMain sources areRe-useRe-manufacturingABattery packintegrationA EoL batteriesB Production scrapRe-useLithium-ion batteries that have residual capacity at the end of theirservice life in BEVs can possibly be used in other applications, e.g.,stationary energy storageRecyclingBattery productionBSource: RWTH Aachen, Roland BergerRe-manufacturingRemanufacturing enables the extension of the first life cycle bypreparing used batteries for reuse in BEVs by replacing or exchangingdamaged components of the battery19
Illustrative & ExemplaryBattery recycling: Value chain overviewPlayers along the value chain have different incentives to be involved in recycling ofscrap or EoL LiB – OEMs and cell manufacturer with highest control over feedstockLiB recycling value chainMining / refiningMiningMotivation torecycleRefining Diversify sourcing streams andimprove negotiating power bycapturing market shareBattery materialsPre-cursorCAM Secure access to scarce rawmaterial feedstock and todiversify supply Leverage chemical processknow howA Scrap1) focus B EoL2) focus k/Vehicle Meet legalobligations forrecycling cont. Participate inrecycling value Meet legalobligations ofEPR3) Participate inrecycling value Collection& sortationExtractionMetallurgicalrefinement Increase utilization of existing assets (collectionnetworks, mechanical / chemical processes andfacilities) and relationships Diversify revenue streams Major control over feedstock & regulatory obligation for LiB recycling1) LiB manufacturing scrap; 2) End of life; 3) Extended Producer Responsibility20
Indicative & Not exhaustiveBattery recycling: Comparison of different technologiesHydrometallurgy potentially offers financial and environmental benefits overpyrometallurgy – Direct recycling with high potential for manufacturing scrapKey recycling technology high-level evaluation and exemplary playersPyrometallurgy HydrometallurgyMechanical HydrometallurgyDirect recycling("Cathode-to-cathode" recycling)Description Whole or shredded batteries are smelted to yielda Nickel, Cobalt, and Copper alloy Alloy further refined through hydrometallurgicalprocesses to isolate metals Batteries are shredded with separation of blackmass (cathode materials) from other materials Acids are used to leach the constituent metals outof black mass Cathode active material is recovered fromblack mass (as opposed to precursors) No smelting or leaching is required Would follow mechanical processingPros High recovery rates for Nickel and Cobalt Proven industrial scale processes with hydroprocess robust against chemistry changes Higher input flexibility, e.g., for e-waste High recovery rates for all metals, incl. costeffective recovery of lithium possible Lower capex on metal extraction step Lower environmental impact (except calcination) Results in high value cathode active material(CAM) that can be sold to a battery cellmanufacturerCons Lithium and manganese are lost in slag; recoverycurrently often not economically viable – Pot.conflict with proposed EU regulatory framework1) Energy and emissions intensive More expensive hydro. process required than afterpyro. (i.e., alloy more homogenous input) Significant use of hot water, acids, and solvents; inhydro. profitability dependent on scale Not yet proven to be an effective solution on acommercial scale or for mixed chemistry recovery For EoL recovery, obsolescence a critical issuedue to cathode chemistry evolutionPyro hydro process is currently the dominant for LiB recycling in NA and the EU, and may be well-suited for supply-constrained markets,where input flexibility is key to manage utilization – Mechanical hydro process, which is the dominant process in China, offers higher materialrecovery rates and lower CAPEX requirements – Direct recycling still in R&D phase but very promising for manufacturing scrap recycling1) Current proposal for regulation would mandate 35% recovery rate of lithium in 2025 or 70% in 2030 in the high ambition scenarioSource: Company information, Interviews with market participants, European Commission, Roland Berger21
Indicative estimates as of Nov '21Battery recycling: Global market forecastLiB(-material) feedstock for recycling is expected to reach 400 GWh equivalentglobally by 2030 – Scrap expected to remain leading source until 2027Available LiB(-material) for recycling globally by application [GWh equivalent, EoL scrap]CAGR2020-2030 400EoL2)CAGR 30%35%Scrap3) 24%2020ESS (EoL)202120222023Electronics & Others (EoL)20242025Transportation (EoL)1)2026202720282029 LiB recycling supply grows atCAGR of 30% in line with demandgrowth Share of EoL expected to growfrom 35% to ca 60% between2020-30 Transportation applications EoLnearly triples its share of LiBrecycling supply supported byrapid demand growth and highcollection rates Scrap availability slows down itsgrowth in the second half of thedecade as declining scrap rates,resulting from improvingLiB production process,decouple it fromdemand expansion2030Manufacturing Scrap1) Transportation includes passenger and commercial vehicles, ePBV, LSEV, 2-wheeler, eShip, eVTOL; 2) Assuming different lifetimes/ramp-down curves, collection rates and recycling rates per application type (e.g., due to second life or land fill);3) Assuming 5-10% average scrap rate (status quo at steady state without ramp-up) with slight decrease over time until 2030Source: Roland Berger22
Indicative estimates as of Nov '21Battery recycling: Impact on supply and demand balance for raw materialsPotentially recoverable materials from LiB recycling play only a minor role comparedto overall supply but could be tipping the scales of the supply vs. demand balanceRoland Berger supply and demand forecast – Cobalt, Nickel, Lithium, 2020-2030 [million metric tons]Lithium (LCE)1)LiNickel (metallic equivalent)2)320.070.140.15 -0.02-0.151-0.4300.180.080.01 -0.06 -0.01 -0.04-1-22020 2022 2024 2026 2028 2030-3Demand (LiB)43210-1-2-3-4Demand SupplyDemand SupplySupply vs. demand (total)2020 2022 2024 2026 2028 2030NiDemand (rest)Potential supply (LiB recycling: EoL Scrap)Cobalt (metallic 0.1-0.22020 2022 2024 2026 2028 2030-0.3Demand SupplySupply (virgin material)1) Supply until 2025 based on planned/announced mining and refining capacities. New processed volume after 2025 increases by the average (absolute) increase for the 2019-2025 period as new mining projects are launched to keep up withdemand; 2) Includes intermediate and battery gradeSource: Roland Berger Integrated LiB Supply-Demand-Database23
Key-Take-Aways Impact of EoL recycling on critical materials supply:Potentially recoverable materials from LiB recycling play only a minor rolecompared to overall supply, but could be tipping the scales of the supplyvs. demand balance and are needed to comply with regulatoryrequirementsFocus Next Chapter Impact of vertical integration, regionalization and co-location ofpCAM-, CAM- and cell production on costs and CO2 emissions24
Vertical integration, regionalization and co-location to mitigate supply chain risks - OverviewWe use our integrated cost model for pCAM-/CAMand cell production and logisticsto understand and compare different levels of vertical integration and co-locationOverview of cost elements varied by cell design and cell manufacturing strategy alternatives1)Raw uipmentCAPEX3)LocationNormal, IL; Phoenix, AZ; Fort Worth, TX; Cottbus,Germany; Somerset, UK; Shenzhen, China; SouthKorea, UlsanCell variantPrismatic LFP (wound), Prismatic NMC 811 (wound),Cylindrical 2170 NCA, Cylindrical 2170 NMC 811,Prismatic NMC 811 (stacked), Future LFP CellCountry of origin of inputs4)China, EU, Japan, South Korea, USA, Level of vertical integrationCells only, Cells CAM, Cells CAM P-CAM, Scale effectsCost Highly affected by leverCost marginally affected by lever /Not varied in model yet1) Considers cell manufacturing costs only; costs associated with CAM/ P-CAM manufacturing included in material; 2) Incl. respective depreciation; 3) Incl. respective depreciation and variable maintenance;4) Incl. raw materials (e.g., lithium hydroxide/ carbonate, nickel sulfate), battery materials (e.g., CAM, AAM) and equipmentSource: Roland Berger25
Material prices as of Jul. '21Vertical integration, regionalization and co-location to mitigate supply chain risks – Impact of vertical integrationRegionalization of supply chain can reduce political and logistics risk, verticalintegration can reduce costs – supply chain set-up to be evaluated case-by-caseVertical integration scenarios – Prismatic NMC 811 (wound) South Korea vs. US [USD/ kWh]CellCell101.480.021.40.1cell21% 5% AAM cost64%CAM cost(USD 51.1/ kWh)15%pCAMproductionOther cellmaterialAAM cost79%CAMproductionCellproductionSource: ICCSINO, Roland Berger Integrated Cost Model C375.4Othercosts2)Cellcosts2.222%Other cellmaterial16%AAMcostCell97.522%2%22.271.523%CAM cos(USD 46.5/ kWh)tNMC 811 Tariffs &BOMlogistics1)3.923%4%Other cellmaterial17% AAM cost75%62%NMC 811 Tariffs &BOMlogistics1)Cellusage22.377%64%CAM99.922%2%CAM cost(USD 51.1/ kWh)NMC Tariffs & Other Cell Transport Final811 logistics1)costs2) costs to US hercosts2)60%CellcostsCAM cost(USD 42.6/kWh)NMC 811 Tariffs &BOM logistics1)73%Othercosts2)Cellcosts"Sourced 1 All materials sourced from South Korea assuming Chinese sport market prices from Jul. 2021; 2) Assumes 40 GWh annualfrom" production capacity, 90% OEE & utilization, 6.5% scrap and includes cost due to energy, labor, maintenance, scrap, warranty &depreciation26
Vertical integration and co-location to reduce CO2-emissions in the vakue chain: Example calculationsBottom-up analysis of CO2 emissions in cell production and production of necessarymaterial shows impact of production locations, supply chain design and technologyComparison of bottom-up analysis to published estimates, 2020 [kg CO2-eq./kWh]kg of CO2-equivalentemissions per kWh142est. 105-115100est. 80-907363.1[kg CO2eq./kWh]4281.2[kg CO2eq./kWh]410Dominantsupply chain1338Est. Module & PackSource: ANL, Roland BergerTransportation75U.S. centricDirtiest productionCell Assembly161731Cleanest production GREET2018 Baseline3SubcomponentChina centricRefiningMiningExample batteries27
Vertical integration and co-location to reduce CO2-emissions in the vakue chain: Example calculationsFull localization including refinery not always better from a CO2 perspective –depends largely on Scope 2 and Scope 3 emissions of upstream operationsRange of CO2 emissions depending on supply chain set-up and technologies used – Example "Cells produced for US"Battery production inputCathodeactivematerialAnodeactivematerialAvg. CO2-eq. emission[% of total] [tCO2-eq/t]Range of emissions [tCO2-eq/t]MINMAX CommentsLithium carbonate/hydroxide17.718.002.8012Nickel sulfate23.46.431.7012 D B A CCobalt sulfate5.65.943.251Manganese sulfate1.83.353.31Aluminum sulfate0.00.04Negligible emissions/
Supply chain risks: Overview - CAM and AAM supply chain with 50% with high risls Main risk areas AAM Anode Active Material Natural graphite Artificial graphite Gr anode CAM and AAM: 50% of cell value! WB. 8 Supply availability and price risks for Lithium, Nickel and the refined salts stem from