Transcription
Understanding Stratification in Statistical Process ControlHarry B. RoweSeptember 14, 2012
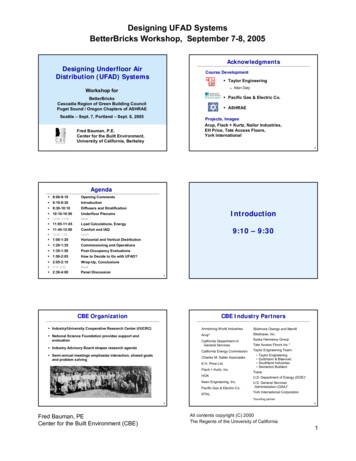
Understanding Stratification in Statistical Process Control“Stratification” can be defined as “the process of dividing things into layers” or “the stateof being divided into layers”.In statistical process control (SPC), “stratification” refers to a situation in which the databeing charted does not represent a single process, but comes from two or more differentprocesses. Sometimes this is inadvertent. Sometimes it occurs due to a misunderstandingof SPC principles. When it happens, it can be quite interesting.To illustrate, I will provide a few examples and explain what is occurring in each case.Suppose there are two identical machines sitting side by side on a factory floor, makingthe same product. If we measure a critical dimension, we find that the productsmanufactured by each machine exhibit similar variability, but the average dimension ofthe products produced on machine 1 differs slightly from those produced on machine 2.Both machines are stable, and an SPC chart of the output of either would show it to be ina state of statistical control.This situation is not unusual at all. Variability in manufacturing is frequently aconsequence of the design of a machine, while the average, or process mean, is a functionof operator setup of the individual machine.In this example, machine 1 is producing parts with an average dimension of 31 mm andthe average on machine 2 is 30 mm. The standard deviation in each case is 0.3 mm. If weplot the part measurements sequentially, we might see something like this. 2012 Harry B. Rowewww.rowequality.com2
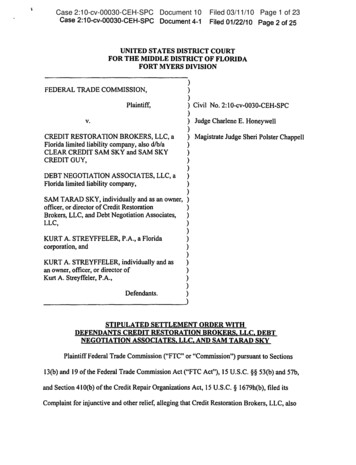
Understanding Stratification in Statistical Process ControlIf the part specification limits were, say, 28 to 34, the difference in process means mighteasily go unnoticed. If we plot the dimensions from the two machines in different colors,we can see a difference. 2012 Harry B. Rowewww.rowequality.com3
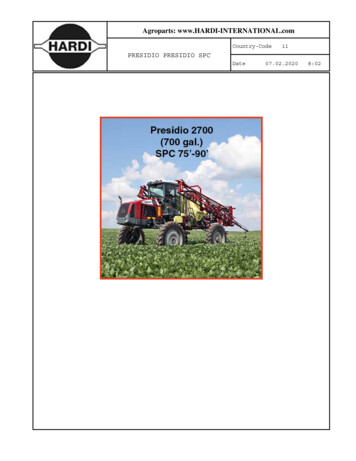
Understanding Stratification in Statistical Process ControlA histogram of the data shows a slightly bimodal distribution. 2012 Harry B. Rowewww.rowequality.com4
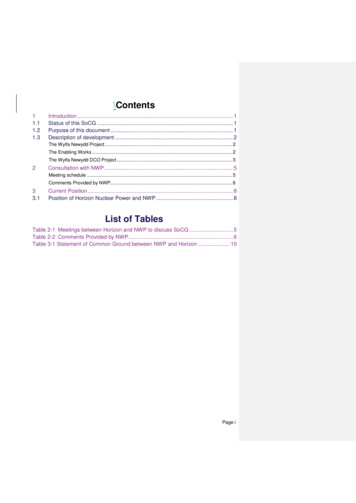
Understanding Stratification in Statistical Process ControlNow let us suppose that a young quality engineer is assigned to implement an SPCprogram for the product. She decides to use an X-bar and R chart with a sample size of 4,taking samples every 15 minutes. Since there are two machines making only one part, sheasks the operators to take a sample of four parts every fifteen minutes, alternatingbetween the two machines. That is, on the hour take four parts from machine 1. At :15after, take four parts from machine 2. At the half hour, take four parts from machine 1. At:45 after, four parts from machine 2. And so on. The parts are measured and the resultsrecorded in a spreadsheet.The next morning, our young engineer excitedly enters the data into the plant’s SPCprogram. Having been trained in SPC, she looks first at the R chart. 2012 Harry B. Rowewww.rowequality.com5
Understanding Stratification in Statistical Process ControlThere is nothing extraordinary in the R chart, so she goes on to the X-bar chart where shesees this. 2012 Harry B. Rowewww.rowequality.com6
Understanding Stratification in Statistical Process ControlGoodness! Twenty of the twenty-five points are outside the control limits! Something ishorribly wrong. But the parts manufactured overnight all passed inspection! What can itbe? (We know, but our young engineer does not, that both the processes are in controlwhen viewed as separate processes.)Suspecting that there may have been something unusual about the previous day, ouryoung engineer decides to try again. But this time, instead of alternating samples betweenthe two machines, she instructs the operators to take two parts from each machine everyfifteen minutes.The next morning she enters the data in a new SPC chart and again examines the R chart. 2012 Harry B. Rowewww.rowequality.com7
Understanding Stratification in Statistical Process ControlNothing extraordinary there, so she looks at the X-bar chart. 2012 Harry B. Rowewww.rowequality.com8
Understanding Stratification in Statistical Process ControlWhew! That’s more like it. All the points are within the control limits.But wait a minute. There are no points outside the control limits, but there aren’t anypoints even near the limits. All of the points are concentrated quite close to the processmean. Statistically, nearly one-quarter of the points should fall outside the two sigmazone. Some SPC programs will flag a pattern of 15 consecutive points inside the onesigma zone as a violating run. There is still something wrong!So again, we have a startling result. What is going on in each case?Recall that in SPC, the control limits are based on an estimate of process standarddeviation. That estimate is based on within sample variability. In the X-bar and R chart,the estimated process standard deviation is based on R-bar. 2012 Harry B. Rowewww.rowequality.com9
Understanding Stratification in Statistical Process Control(Some SPC programs estimate process standard deviation using grouped standarddeviation rather than R-bar. The result, however, will be very similar.)In the first case, alternating samples between machines, each sample is drawn from asingle machine. R, the difference between the largest and smallest values in a sample,will be representative of the variability of the machines. The estimated process standarddeviation will be close to the standard deviation of the parts produced by either machine.Note that the distance between the control limits is approximately 0.87.But since each sample represents a single machine, the individual X-bar values will beclose to the process mean of the machine from which the that particular sample is drawn.The result is an X-bar chart in which the values alternate between a value near 31 and avalue near 30, while the grand mean falls at 30.5, the average of 30 and 31. The sample tosample variation is much greater than the variation predicted by the machine variability,resulting in lots of points outside the control limits.In the second case, since each sample contains two parts from each machine, each Rvalue will include both the machine variability and the difference between the twoprocess means. This results in an estimate of process standard deviation that is quitelarge. Note that in this case, the distance between the control limits is almost 2.0.At the same time, the X-bar values cluster around the grand mean, which is still midwaybetween the two process means.While these two situations seem contrived, I have seen process engineers (and notnecessarily young ones) make both of these mistakes.In a much more common scenario, suppose the two machines both discharge into acommon bin. The SPC sample of four parts is subsequently taken from the bin.Assuming the bin is large and the sampling is random, the probability of a samplecontaining a particular number of parts from each machine is as follows:Parts 1/16On an X-bar chart, this will result in X-bar values clustering into five bands, or strata. One sixteenth of the X-bar values, those from samples with four values frommachine 1, will lie around the mean of machine 1. 2012 Harry B. Rowewww.rowequality.com10
Understanding Stratification in Statistical Process Control Another one sixteenth of the X-bar values, those from samples with four valuesfrom machine 2, will lie around the mean of machine 2.The majority of the X-bar values, the six-sixteenths of them corresponding tosamples with two values from each machine, will lie at the grand mean, halfwaybetween the two machines’ process means.Four-sixteenths of the X-bar values corresponding to samples with three valuesfrom machine 1 and one from machine 2, will lie at the midpoint between thegrand mean and the mean of machine 1.Four sixteenths of the X-bar values corresponding to samples with three valuesfrom machine 2 and one from machine 1 will lie at the midpoint between thegrand mean and the process mean of machine 2.The separation of the values into bands or strata leads to the name “stratification”.In the example we have been using, that X-bar chart would look like this. 2012 Harry B. Rowewww.rowequality.com11
Understanding Stratification in Statistical Process ControlIt takes a bit of imagination to see the different strata in this chart. If, however, the twoprocess means are changed to 30 and 40, leaving the process standard deviation the same,the stratification pattern becomes very clear. (The number of points plotted has also beenincreased to 60.) 2012 Harry B. Rowewww.rowequality.com12
Understanding Stratification in Statistical Process ControlThe R chart associated with this data also exhibits a characteristic pattern as shownbelow. 2012 Harry B. Rowewww.rowequality.com13
Understanding Stratification in Statistical Process ControlNote that most of the R values fall in a band around 10, corresponding to the differencebetween the two process means. These are all the samples containing at least one valuefrom each machine. The remaining points, those corresponding to samples containingvalues from only one machine or the other, fall in a band much nearer to zero. These fewpoints are the ones that are truly representative of the process standard deviations of thetwo machines.In this case, the SPC program has identified 20 violating runs, corresponding to thenumber of times there were an excessive number of consecutive points on one side of thecenter line.While the examples used here were X-bar and R charts using n 4, the same effects willappear with different sample sizes, or with X-bar and S charts. As sample sizes increase,however, so will the number of strata, making detection more difficult. The number of 2012 Harry B. Rowewww.rowequality.com14
Understanding Stratification in Statistical Process Controlstrata will increase linearly with n. If the number of different processes representedincreases, however, the number of strata increases geometrically.The main lesson to be learned from this phenomenon is that one should be very careful toavoid plotting data from more than one process on any given SPC chart. Whether itoccurs inadvertently or through a misguided effort to simplify sampling or charting, it isalways a bad idea.(The data and graphs in this article were produced using the Rstatistical environment, free software downloadable from www.rproject.org. For SPC charts, use was made of the “qcc” package,an extension to R developed by Dr. Luca Scrucca of theDepartment of Economics Finance and Statistics of the Universitadegli Studi di Perugia in Perugia, Italy.) 2012 Harry B. Rowewww.rowequality.com15
In statistical process control (SPC), "stratification" refers to a situation in which the data being charted does not represent a single process, but comes from two or more different processes. Sometimes this is inadvertent. Sometimes it occurs due to a misunderstanding of SPC principles. When it happens, it can be quite interesting.