Transcription
Sentinel Real Estate Fund, LPFUND REVIEW FOR MUNICIPAL EMPLOYEES’ RETIREMENT SYSTEM OF LOUISIANABY:NICHOLAS STEIN, PORTFOLIO MANAGERNICHOLAS VERANO, CLIENT SERVICESJULY 18, 2018
TABLE OF CONTENTSPageSENTINEL REAL ESTATE CORPORATION1MULTIFAMILY UPDATE AND OPPORTUNITY3SENTINEL REAL ESTATE FUND, LP6SENTINEL NATIONAL URBAN PARTNERS I, L.P.19SENTINEL BIOGRAPHIES21
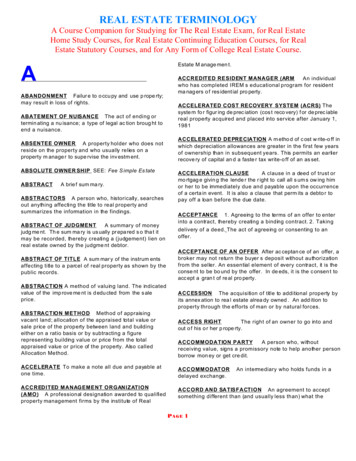
The Sponsor: Sentinel Real Estate CorporationSentinel Real Estate Corporation is an independently owned real estate investment management firm established in 1969. Thefirm currently has over 7 billion of institutional quality real estate assets under management on behalf of 90 domestic andinternational clients. Sentinel maintains its global headquarters in New York City and two international corporate offices in Amsterdam,the Netherlands and Melbourne, Australia. Sentinel maintains 13 operational offices throughout the US and anadditional operational office in Australia. Client servicing offices are located in Bellevue, WA; Winston-Salem, NC;Munich, Germany; and Singapore. Since its formation, Sentinel has acquired and managed 16.8 billion of direct real estate investments, comprising 563multifamily communities containing 145,000 apartment units and 173 commercial properties containing 32.2 millionsquare feet of space. The Sentinel portfolio currently contains over 25,000 apartment units and5.4 million square feet of commercialreal estate.Belau.PStddeValeedallaScotinstAuMultifamily PropertiesCommercial PropertiesrthAUSTRALIAgrin nSp l agemitHerille hnv iocwn so ntAanto dernekeCre ntaHam hns Atlagh JonirmiBtsecuGlePh ndaoe lenixTemenifeeDnemlevillevilerChestiaWest luderkreOvIrvPeshFiencmrhaDu KaOmColoradonciLo amaLindaCasPlainsWhiterkNew Yo 26WalesNorthlinttnasa. PleMt rvillenrthstomeomN arleSuChhnnaler SavaooPlenvilksoJactteSpringsDePa nvrk ererRoilleityaahgoMrtPaSa rkcramentoFolsomhneicaChcavSentinel’s senior management team hasan average tenure with the firm of over20 years.elkfiooBrarloeovGrMChleapSentinel operates on a vertically-integrated platform with over 900employees performing all phases ofthe investment process, including onsite property management.M dordfVa Sentinel helBeaapalmCh rst PyoleWees arb paW H mlm TanPado san leBr NapAs of 3/31/181
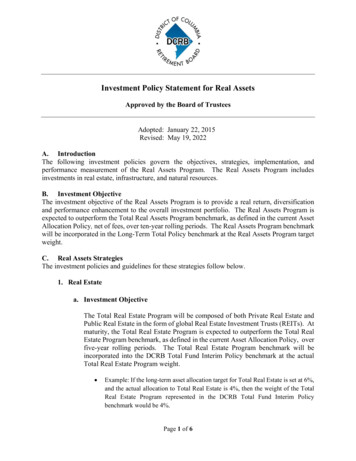
Assets Under ManagementProperty TypeFund TypeSeparate Accounts70%Office26%Closed-EndCommingled Funds6%Industrial3%Open-EndCommingled Funds24%Apartments71%Investment StrategyClient TypeInternational Investors24%US CorporatePension Funds7%US Endowments &Foundations 1%Value-Added14%US Taft-HarleyPension Funds7%US High Net WorthIndividuals/Family Office23%Core86%US Public Pension Funds37%Note: All information as of 3/31/18US Insurance CompanyFunds1%2
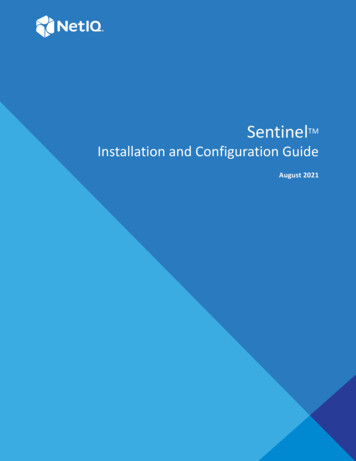
Multifamily Update And OpportunityNCREIF US Institutional Investor PropertyBreakout ( Millions) as of March 31, 2018 Multifamily housing has been the fastest growing institutionalreal estate sector over the past ten years, now comprising23.9% of the 567 billion US institutional real estate market, asan increasing number of investors recognize the strong demographic fundamentals underlying the sector, the stable cashflow streams generated by apartments and the sector’s role asan inflation hedge.Industrial 88,78215.6%Apartments 135,59223.9%Hotel 4,0120.7%Retail 130,45223.0% Over 43.1 million American households, or 34.2% of the population, currently rent their dwelling units, with 8 million newrenter households added in the last ten years as younger andolder Americans alike are renting for longer periods of timethan ever before.Office 208,83036.8%Total Assets 567,468 ( Millions)Source: NCREIF Steady job and population growth continue to encourage newhousehold formation, with 18.4 million jobs added in the US since2010 and population growth of approximately 25 million peopleover the last decade. Similar population growth is projected overthe next decade. The US homeownership rate measured 64.2% as of the firstquarter of 2018, slightly above the 50-year low of 62.9% set in2016, but 500 basis points below the peak of 69.2% set in 2004.The average age at which households are buying their firsthome continues to increase and affordability remains a substantial barrier to ownership.US Population and Household Growth by Age CohortAge ofHouseholder20 to 3435 to 4445 to 5455 to 6465 and olderTotalPopulationGrowth2008-2017 6,904,000-1,443,000-1,741,000 8,609,000 13,279,000 25,608,000RenterHouseholdGrowth2008-2017 1,794,000 1,256,000 883,000 2,054,000 1,970,000 7,957,000ProjectedPopulationGrowth2018-2027 1,825,000 5,648,000-664,000-983,000 17,976,000 23,802,000Source: US Census BureauSource: US Census Bureau3
Multifamily Update And Opportunity (cont’d) Multifamily developers have increased construction activity over the past four years in order to satisfy this growing demand with 697,453 apartment units currently under construction; however, the pace of deliveries hasslowed substantially due to average construction delays of over five months resulting from the lack of availability of labor and construction materials. Deliveries in the first quarter of 2018 were the lowest since 2013 allowing absorption to keep pace and the multifamily occupancy rate to stay at 93.7%, still 10 basis points above the ten-year historical average. Single-family homebuilders have been slow toincrease production, resulting in a continuedshortage of overall housing units in the UnitedStates. Total housing construction is still trending9.8% below the annual average since the USCensus Bureau began record keeping in 1984.New Privately Owned Housing Completed in US Permit Areas1,000Total1 to 4 unitsUS Census Bureau Source: Not SeasonallyAdjusted, Rolling !" 5 units or more1Q181Q171Q161Q151Q141Q131Q12The median price of a single-family home hasincreased by 54.8% from a low of 158,600 in thefirst quarter of 2012 to 245,500 in the first quarter of 2018, marking 24 consecutive quarters ofyear-over-year growth. CoreLogic’s Home PriceIndex estimates that one-half of the 50 largest USmarkets are “overvalued”, defined as at least 10%above the long run average.1Q11 1Q1001Q095001Q08Units (000’s)1,500Average since 198412-Month Data4
Multifamily Update And Opportunity (cont’d) A growing affordability crisis is emerging in the United States asan insufficient supply of overall housing is being built and refurbished to supply middle class renters.The US Census Bureau has identified 23.1 million 18- to 34-yearolds living at home or residing in college dorms, up 27.4% compared to 20 years ago as student debt, credit card debt and housing prices form a growing barrier to independent household formation.US Rental Apartment New Development Unit DeliveriesPERIOD1MID-TIER2%HIGH-END2%TOTAL12000 - 2007401,5662008 - 91.1%2,042,6952000 - 2017583,07517.2%2,804,16482.8%3,387,239(1)Total comprises mid-tier and high-end assets. From 2000-2007, 1- and 2-Star unit deliveries totaled -847, or -0.1%, of thenet completions and, from 2008-2017, totaled -81,516, or -4.2% of the net completions, according to CoStar, as more unitsin this category were demolished than constructed.(2)Mid-tier assets are considered to be 3-Star assets. High-end assets are considered to be 4- and 5-Star assets.US Multifamily Average Occupancy96% 95%94%Average OccupancyOver the last decade, an average of only 18,151 new units ofmid-tier rental housing, or 8.9% of total new construction, weredelivered annually compared with the average annual deliveryof 186,119 newly developed 4- and 5- star units.From 2013 to 2017, mid-tier communities had an average occupancy rate of 94.6% with average annual rent growth of 3.7%.High-end properties had an average occupancy rate of 91.8%with average annual rent growth of 2.8%.93%92%91%90%4Q00 4Q01 4Q02 4Q03 4Q04 4Q05 4Q06 4Q07 4Q08 4Q09 4Q10 4Q11 4Q12 4Q13 4Q14 4Q15 4Q16 4Q17Source: CoStarMid-tierHigh-endUS Multifamily Same-Store Rent Growth6%4%Percentage Change 2%0%-2%-4%-6%4Q01 4Q02 4Q03 4Q04 4Q05 4Q06 4Q07 4Q08 4Q09 4Q10 4Q11 4Q12 4Q13 4Q14 4Q15 4Q16 4Q17Source: CoStarMid-tierHigh-end5
Fund OverviewPortfolio Diversification by RegionAs of March 31, 2018:Southwest8%The Fund owned 29 apartment communities containing 8,827 units dispersed across 21 differentMetropolitan Statistical Areas. Average asset size is 56 million. No single property comprises morethan 5.3% of gross assets and no market containsmore than 10.3% of gross assets.hin,ngdeilahiDRa urhle amighlleisshviphNaemMPhasWdiInKCi anty Phah anchesterLocations of Current Holdings by MarketeThere were 57 investors in the Fund with anaverage investment size of 20.5 million. Theinvestor composition is 64.1% domestic/35.9%international. No investor comprises more than7.9% of total equity.ng Southeast37%idFor the 12 months ending March 31, 2018 net additions to contributed capital totaled 9.3 million.Northeast6%rs Mideast14%Pacific13%sAThe Fund had 501 million of debt outstanding,representing a leverage ratio of 29.7%.East NorthCentral4%ve West NorthCentral5%Mountain13%Lo Gross asset value was 1.69 billion. Net assetvalue was 1.16 billion.Ri 6
Fund Management Team The members of the Fund’s management team have been with the firm for an average of 21 years. One team member,Julianne Sullivan, a Regional Director responsible for residential asset management, left the firm in December 2017 toreturn to a family business. This position has been filled by Vanessa Healy, who has been with Sentinel since 2006. Mostrecently, she was responsible for analysis of asset management, property management and capital programs. Prior to thatshe served as an Asset Manager in Sentinel’s high-rise/mid-rise residential portfolio group.John H. StreickerChairmanMichael F. StreickerSENTINELINVESTMENT COMMITTEEExecutive Vice PresidentMillie C. CassidyPresidentKaren F. HallockGeorge TietjenManaging DirectorManaging DirectorPORTFOLIO MANAGEMENTFinancial and Client Reporting.Robert E. BartlettManaging Director/Domestic Client ServicesKaren. F. HallockManaging Director/Research/Investor ServicesLeland J. RothManaging Director/Chief Financial OfficerNicholas SteinRobin L . BlauerManaging Director/Fund Portfolio ManagerSenior Vice President/Fund Portfolio ManagerAsset and Property ManagementRobert LeniartManaging Director/Residential Asset ManagementOversight/Capital Projectsand SustainabilityMichael F. StreickerExecutive Vice PresidentInternational Client ServicesJoseph SteinFirst Vice President/Fund ControllerAnita BreslinManaging Director/Regional Director- Residential EastVanessa HealyFirst Vice President/Regional Director- Residential WestKaren ChardeManaging Director/Regional Director- Residential High-RiseAcquisitions/Financings/DispositionsNoel G. BelliManaging DirectorAcquisitions/DispositionsRobert B. KassWilliam A. FreydbergSenior Vice PresidentManaging DirectorAcquisitions/Dispositions Acquisitions/DispositionsBrian KrautFirst Vice President/Asset Financings &Acquisitions/DispositionsASSET MANAGEMENTASSET ITEMANAGEMENTON-SITEMANAGEMENTASSET MANAGEMENTON-SITEMANAGEMENT7
Fund Performance For the 12 months ended March 31, 2018, the Fund continued to generate consistent income returns, achieving a netincome return of 4.55%, 115 basis points above the one-year income return of the NFI-ODCE Index. Overall, the total netreturn for the 12 months ended March 31, 2018 was 7.11%. Over the next 12-month period, the Fund projects a total gross return of approximately 7.0% to 7.5% with an income returnof 5.0% to 5.5%.Performance Comparison (As of March 31, 2018)NFI-ODCE Index (1)Sentinel Real Estate Fund, LP(1)PeriodNet IncomeReturnUnrealizedAppreciationTotal NetReturnNet IncomeReturnUnrealizedAppreciationTotal ce Inception7.37%1.33%8.76%NANANAThe NFI-ODCE (NCREIF Fund Index-Open-End Diversified Core Equity) is a fund level, capitalization weighted, time-weigted return index.It includes property investments at ownership share, cash balances and leverage; therefore, the returns reflect the fund's actualownership positions and financing strategy. Total net assets: 181.82 billion.Sentinel Real Estate Fund, LP (Unleveraged)(2)NCREIF Apartment Subindex (2)PeriodGross IncomeReturnUnrealizedAppreciationTotal GrossReturnGross IncomeReturnUnrealizedAppreciationTotal .03%6.10%Since Inception8.26%0.76%9.05%NANANAThe NCREIF Apartment Subindex is an unleveraged, property level index, which includes 1,569 properties valued at 135.39 billion. Inorder to make a more appropriate comparison, we have provided unleveraged returns for the Fund above.8
Financing Summary There has been no property level financing activity during the last year. There are no property level debt maturities within the Fund over the next three years. 18 of the Fund’s 29 properties were encumbered by debt, with an average property level loan-to-value ratio of 48.7%.73.6% of the total debt is floating rate, while 26.4% of the loans have a fixed interest rate. The Fund’s overall debt service coverage ratio as of March 31, 2018 was 3.40:1.Total Outstanding Principal2 - 509.5MDebt to Total Assets1 29.7% - Including line of credit 29.3% - Excluding line of creditFloating Rate3 - 73.6%Weighted average interest rate - 3.36%Structure Secured Debt - 98.8% Unsecured Debt - 1.2%Weighted Average Cost of Debt Contract Rate - 3.31%Fixed Rate - 26.4%Weighted average interest rate - 3.17%Weighted Average Remaining Term 5.5 YearsMaturity Schedule 300,000,000 250,000,000 200,000,0001The Fund maintains a line of credit in the amount of 50,000,000 that matures on June 1,2018 with two one-year extension options available. As of March 31, 2018, the amountdrawn on the line of credit was 6,000,000. In addition, there is a revolving credit facilitysecured by a Fund property of 21,000,000. The amount drawn on the revolving creditfacility is 0.2Total mortgage note payable, at fair value as of March 31, 2018 was 501.1 million.3Weighted average 30 day LIBOR cap “strike” rate - 2.32%. 150,000,000 100,000,000 50,000,000 020182019202020212022202320242025Source: Sentinel Real Estate Fund Internal Reporting as of March 31, 2018.9
Target Markets For new acquisitions, the Fund is focused on high growth secondary markets and suburban locations across the UnitedStates that will continue to enhance the Fund’s overall diversification and benefit from the following attributes:– manageable supply pipeline;– convenient access to large and growing employment and retail centers;– high median incomes and high single-family home prices;– quality school systems.Current target markets are shown on the map below.Target Market rSaInditoenmacrLa esplNaimiaM10
Transaction Activity Acquisition Activity: The Fund continues to actively seek new acquisitions while maintaining a disciplined approachto both submarket and asset selection. In the last year, one property has been acquired by the Fund, PerimeterGardens at Georgetown, a mid-rise community located in Suburban Atlanta.– A larger number of desirable assets have been marketed for sale over the last 30-to-45 days than we have seen inthe last 18 to 24 months in various markets including Los Angeles and San Diego counties, Phoenix, Houston, DCsuburbs and Chicago. Pricing has remained highly competitive. Disposition Activity: Kingscrest Apartments, located in Frederick, Maryland, was sold on May 10, 2018 following avery active sales process in which 204 confidentially agreements were submitted, 39 groups toured the property and22 groups ultimately submitted offers.– Kingscrest was constructed in 1992 and acquired in 1998 for 28.1 million or 69,554 per unit. The dispositionprice was 64.25 million, which resulted in a property level IRR of 15.7% over the holding period, an unleveredincome yield of 9.3.% and a loan-to-value ratio of 53.4% at the time of closing.Frederick, Maryland11
Recent AcquisitionPerimeter Gardens at GeorgetownAddress100 Azalea Garden DriveDunwoody (Atlanta), GeorgiaMid-Rise Apartment CommunitySizeNumber of units: 245Average unit size: 959 sq. ft.Year Completed2006Acquisition DateSeptember 12, 2017Contract Purchase Price 45,312,000Pro Forma Returns*Initial Yield4.33%4.63%(Unlevered)(Levered)10-Year IRR6.59%7.91%(Unlevered)(Levered)* Pro forma levered returns are based on the target Fund leverage level of40% at quoted loan terms at the time of the acquisition. Actual leveragelevels for individual properties may vary.12
Recent Acquisition (cont’d)Investment Rationale Perimeter Gardens at Georgetown is located just north of I-285, Atlanta’s Perimeter Interstate, which provides directaccess to Perimeter Center, the largest Class A office submarket in Atlanta and the area’s largest employment district.Perimeter Center is expected to add 35,000 jobs in the next eight years. The property is also proximate to the thriving neighborhoods of Buckhead and the Cobb Triangle, which together withPerimeter Center encompass over 60 million square feet of office space, 340,000 jobs and ten Fortune 1000 companies.Perimeter Mall, an upscale super regional mall with over 1.5 million square feet of space, is located within three milesof Perimeter Gardens at Georgetown. According to Zillow, the median single-family home price in Dunwoody was 444,000 as of the first quarter of 2017,which was significantly higher than the Atlanta MSA’s median price of 182,800. Perimeter Gardens at Georgetown is located adjacent to the Dunwoody Trailway, providing access to abundant greenspace in Pernoshal Park, Georgetown Park and Brook Run Park - the largest in the region at 102 acres. With its location just east of the densely packed Perimeter Center commercial district, Perimeter Gardens at Georgetownbenefits from a suburban setting and access to highly-rated Dunwoody schools, at rental rates well below those of comparable assets in surrounding micro-markets.13
Current Fund PortfolioName: 23Hundred at Berry HillLocation: Nashville, TNNo. of Units: 266 UnitsYear Built: 2014Name: Acadia at Cornerstar ApartmentsLocation: Aurora (Denver), CONo. of Units: 400 UnitsYear Built: 2010Name: Antelope Ridge ApartmentsLocation: Menifee (Riverside), CANo. of Units: 248 UnitsYear Built: 2010Name: Asprey ApartmentsLocation: Brandon (Tampa), FLNo. of Units: 324 UnitsYear Built: 2001Name: Avant on Market CenterLocation: Dallas, TXNo. of Units: 301 UnitsYear Built: 2012Name: Avenel at Montgomery SquareLocation: North Wales (Philadelphia), PANo. of Units: 256 UnitsYear Built: 200414
Current Fund Portfolio (cont’d)Name: Carrington Place at Shoal Creek ApartmentsLocation: Kansas City, MONo. of Units: 270 UnitsYear Built: 2008Name: Cityplace HeightsLocation: Dallas, TXNo. of Units: 396 UnitsYear Built: 2014Name: Courtney Station ApartmentsLocation: Pooler (Savannah), GANo. of Units: 300 UnitsYear Built: 2008Name: The Crossings at Alexander Place ApartmentsLocation: Raleigh, NCNo. of Units: 300 UnitsYear Built: 2008Name: Delano at Cypress Creek ApartmentsLocation: Wesley Chapel (Tampa), FLNo. of Units: 288 UnitsYear Built: 2006Name: Egret’s Landing ApartmentsLocation: Palm Harbor (Tampa), FLNo. of Units: 420 UnitsYear Built: 199615
Current Fund Portfolio (cont’d)Name: First and Main ApartmentsLocation: Colorado Springs, CONo. of Units: 315 UnitsYear Built: 2014Name: Foothills at Old Town ApartmentsLocation: Temecula (Riverside), CANo. of Units: 274 UnitsYear Built: 2009Name: Glenbrook ApartmentsLocation: Hendersonville (Nashville), TNNo. of Units: 312 UnitsYear Built: 2015Name: Hampshire Green ApartmentsLocation: Bedford (Manchester), NHNo. of Units: 204 UnitsYear Built: 1998Name: Hills of Valencia ApartmentsLocation: Valencia (Los Angeles), CANo. of Units: 208 UnitsYear Built: 2003Name: Island Park/Harbor Town Square ApartmentsLocation: Memphis, TNNo. of Units: 300 UnitsYear Built: 199816
Current Fund Portfolio (cont’d)SDLOName: Kingscrest ApartmentsLocation: Frederick (Washington, DC), MDNo. of Units: 404 UnitsYear Built: 1992Name: Lantern Woods ApartmentsLocation: Fishers (Indianapolis), INNo. of Units: 460 UnitsYear Built: 2000Name: Lofts at Lakeview ApartmentsLocation: Durham, NCNo. of Units: 352 UnitsYear Built: 2006Name: Nona Park Village ApartmentsLocation: Orlando, FLNo. of Units: 302 UnitsYear Built: 2015Name: The Oaks at Johns Creek ApartmentsLocation: Johns Creek (Atlanta), GANo. of Units: 264 UnitsYear Built: 2013Name: The Paragon at Kierland ApartmentsLocation: Scottsdale (Phoenix), AZNo. of Units: 276 UnitsYear Built: 200017
Current Fund Portfolio (cont’d)Name: Parc at GrandviewLocation: Birmingham, ALNo. of Units: 334 UnitsYear Built: 2011Name: Perimeter Gardens at GeorgetownLocation: Dunwoody (Atlanta), GANo. of Units: 245 UnitsYear Built: 2006Name: Weston Point ApartmentsLocation: Overland Park (Kansas City), KSNo. of Units: 350 UnitsYear Built: 1998Name: Windward Long Point ApartmentsLocation: Mount Pleasant (Charleston), SCNo. of Units: 258 UnitsYear Built: 2012Name: The Vineyards ApartmentsLocation: Germantown (Memphis),TNNo. of Units: 200 UnitsYear Built: 199718
Sentinel National Urban Partners I, L.P. Sentinel National Urban Partners I, L.P. (the “Fund”) will acquire, renovate and managemultifamily properties built prior to 1960 located in economically strong US city centers. An opportunity exists to provide middle-income residents with modern, moderatelypriced rental housing in urban locations that are benefitting from population growth,expanding employment opportunities, access to public transportation and walkableretail, and public and private capital investment into the municipalities. The Fund will aim to purchase properties at below the cost to construct new communities in the submarket, and will target multifamily buildings that exhibit belowmarket rental rates, inferior management and/or deferred maintenance at the time ofacquisition. The investment strategy of the Fund is to create value by upgrading unit interiors,common areas and building systems to achieve revenue growth, operating efficienciesand appreciation. The Fund aims to generate a gross internal rate of return of 12.0% to 14.0% with aportfolio-wide maximum loan-to-value ratio of 50.0% and an average annual grossincome yield of 5.0% to 6.0%. The Fund will seek to raise 300 million of equity capital commitments. Over the last decade, Sentinel has successfully executed an urban upgrade strategy on63 classic multifamily properties with an aggregate value of over 1.1 billion, generating a pro forma, gross IRR of 14.6% and an equity multiple of 2.1x.Dallas, TXNew York, NY19
Sentinel National Urban Partners I, L.P. (cont’d)INVESTMENT# OFPORTFOLIOASSETSREALIZED INVESTMENTS30UNREALIZED INVESTMENTS 33TOTAL PORTFOLIO63AVG YEARSHELD5.73.54.7SALES PRICE/AGGREGATEFAIR MARKET VALUE(1) INVESTMENT(2) 572,902,662 361,575,315 618,172,631 499,604,370 1,191,075,293 861,179,685EQUITYINVESTMENT(3) 261,343,833 351,102,107 612,445,940EQUITYMULTIPLE(4) (6)2.2x1.9x2.1xGROSSIRR (5) (6)14.5%15.1%14.6%(1) Actual sales price for realized investments and fair market value as of December 31, 2017 for unrealized investments.(2) Represents the sum of the property purchase price and the related acquisition costs, as well as any amounts invested during the life of the property.(3) Represents the actual equity at acquisition for each of the properties and additional equity invested during the life of the property.(4) Ratio determined by dividing total distributions by the equity investment.(5) Calculated using monthly cash flows. For unrealized assets, the terminal value is equal to the net market value as of the reporting date less sales costof 3.5%. Returns presented are net of leverage and before fees.(6) Pro forma yields are based on the assumption that each property was acquired with an interest-only loan at 50% LTV, which remained outstandinguntil December 31, 2017 or date sold, with a fixed interest rate equal to 4.00%.20
BiographiesNicholas Stein is a Managing Director in Sentinel’s portfolio management group responsible for implementing theinvestment strategy for several of Sentinel’s commingled funds and separate accounts. Prior to joining Sentinel in 2007,Mr. Stein was an Associate in the Energy, Infrastructure and Project Finance practice of the law firm White & Case,LLP. Mr. Stein received a BS degree in International Security Studies from Georgetown University School of ForeignService and a JD degree from Georgetown University Law Center. He is a member of the New York State Bar.Nicholas Verano is a Senior Vice President and heads Sentinel's investor services office in Winston-Salem, NorthCarolina. Prior to joining Sentinel, he was a Vice President and Manager of Marketing for Institutional Services atWachovia Bank & Trust Company, with special emphasis on real estate from 1981 to 1988. From 1979 to 1981, he wasa Senior Consultant with Mercer-Meidinger-Hansen, and was a Regional Manager for Corporate Accounts with Bank ofAmerica from 1975 to 1979. Mr. Verano graduated with a BA from Marshall University in 1971. He was a member ofthe Corporate Affiliate Board of Directors of the National Association of State Treasurers and is active in various national pension and real estate organizations for public, multi-employer and corporate plan sponsors, including IFEBP,NCTR, SCTR, TEXPERS and PREA. He has been speaker on real estate matters at conferences sponsored by NCPERS,LATEC, OPAL, ILI, IMN.21
The Sponsor: Sentinel Real Estate Corporation Sentinel Real Estate Corporation is an independently owned real estate investment management firm established in 1969. The firm currently has over 7 billion of institutional quality real estate assets under management on behalf of 90 domestic and international clients. †