Transcription
A NOTE ON FREE TRADE AGREEMENTS AND THEIR COSTS*Dr. V.K. Saraswat1, Prachi Priya2 and Aniruddha Ghosh3* Disclaimer: Opinions and recommendations in this article are exclusively of the authors andnot of any other individual or institution.1Dr. V.K. Saraswat is the former DRDO Chief & Secretary Defence R&D, recipient of PadmaShri & Padma Bhushan and is currently Member, NITI Aayog2Ms. Prachi Priya is a Mumbai based economist3Mr. Aniruddha Ghosh works in the Office of Dr. VK. Saraswat
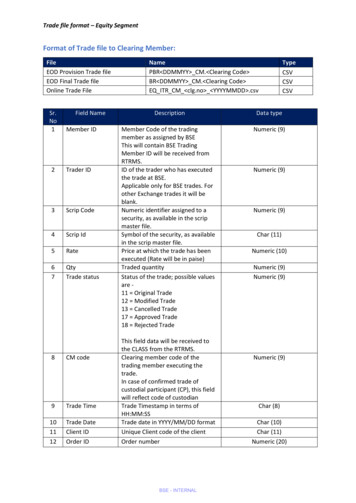
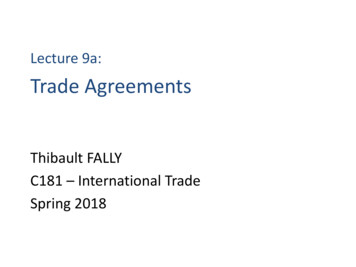
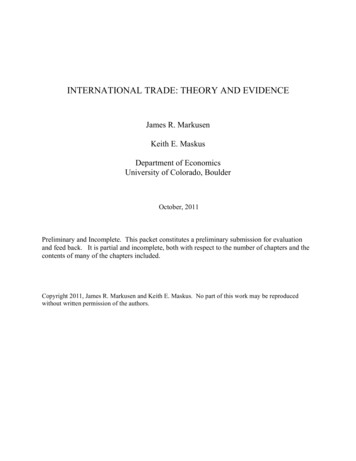
IntroductionTrade theory has consistently been a strong proponent of free trade of goods, services, capitaland labour. However, a growing wave of protectionism and trade wars have dominated globaltrade recently. To underscore the prevailing sentiments regarding protectionism, it is instructiveto look at what a free-trade champion and Nobel Laureate Paul Krugman had to say on theissue of seamless trade:“It’s also true that much of the elite defense of globalization is basically dishonest: false claimsof inevitability, scare tactics (protectionism causes depressions!), vastly exaggerated claimsfor the benefits of trade liberalization and the costs of protection, hand-waving away the largedistributional effects that are what standard models actually predict.”New York Times, 9th March, 2016While it is difficult to assess whether the trade war will lead to a significant shift in the globaltrade paradigm, in the current scenario India should carefully review existing Free TradeAgreements (FTAs) before negotiating new ones. Evidences from recent FTAs suggestunfavorable gains to our trade partners. Worsening of our trade balances with our FTA partnercountries merits attention. This note identifies India’s trade patterns, its export potential,competitiveness vis-à-vis trade partners, India’s FTA gains and losses and some policyrecommendations.India’s Trade Patterns, Value Added and Export PotentialIndia is a fairly open economy with overall trade (exports plus imports) as a percentage of GDParound 40%. Its trade deficit has grown from USD 6bn in FY01 to USD 109bn in FY17 (Table1). However, India has diversified its exports since the 1990s both geographically and productwise. In a working paper for the International Monetary Fund (IMF), Anand et.al state“structural transformation, future growth and export performance depend on: (i)diversification across destinations, products, and services (ii) composition of the export basketmeasured by technological content, quality, sophistication, and complexity of exports and (iii)how closely related a country’s goods and services exports are to globally-traded products andservices.”India’s exports have diversified both in terms of markets and products and services in the pasttwo decades. Indian exports have gradually found their way into new markets. The size ofdeveloped countries in India’s exports has declined and that of emerging economies hasincreased. India now exports over 50% of its exports to emerging and developing economiessurpassing the share of advanced economies. In fact, European Union (EU) and United Statesof America (USA) now account for only 30% of India’s total exports compared to 45% in 2000.In terms of the product mix, there has been a gradual shift as the export sector has moved upthe value chain, leading the way with high-value products like industrial machinery,
automobiles and car parts, and refined petroleum products. Manufactured goods along withpetroleum products accounted for nearly 85% of India’s export basket in FY17. A breakdownis available in Table 2. In terms of outward reliance, the foreign content of India’s exports(value of imported intermediate goods and services that are embodied in India’s exports) hasincreased significantly and across all industries in the last two decades, more than doublingfrom under 10 percent in 1995 to 24.0 percent in 2011.The share of foreign value addition inthe exports of the manufacturing sector is the highest and clocks nearly 50 percent. (OECDTrade-in-value added Database).Figure 1: India’s Trade Balance (USD) over the years (FY’00 – FY’17)India's trade balance .000FY00 FY01 FY02 FY03 FY04 FY05 FY06 FY07 FY08 FY09 FY10 FY11 FY12 FY13 FY14 FY15 FY16 FY17ExportsImportsFigure 2: India's exports by category(% share of total exports)Petroleum & crude productsAgricultural & allied productsOres & mineralsManufactured goodsLeather & leather manufacturesChemicals & related productsEngineering goodsElectronic goodsTextiles (excluding readymadegarments)Readymade garmentsOther manufactured goodsOther 2.72.513.011.623.81.211.911.422.82.76.06.322.41.1
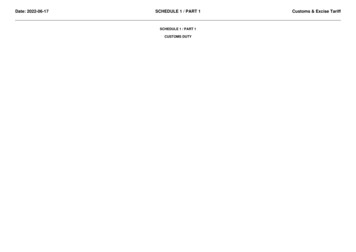
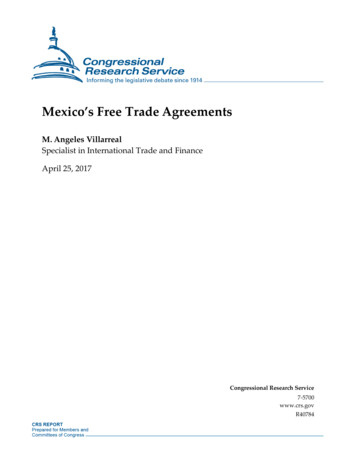
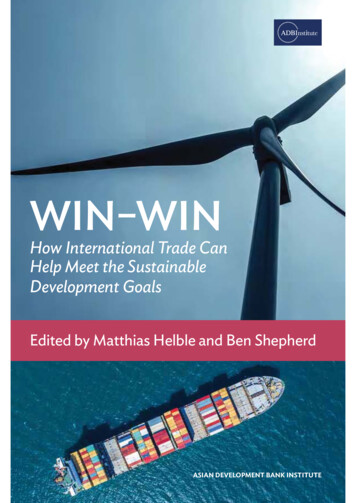
In terms of export potential, the International Trade Center (ITC) estimates India’s untappedexport potential to around USD 201.4bn with a corresponding import potential pegged at USD181.8bn. Worked diamonds shows the largest absolute difference between potential and actualexports in value terms, leaving room to realize additional exports worth USD 17.2 bn. Also, themarkets with greatest potential for India’s exports are United States of America, China andUnited Arab Emirates. United States of America shows the largest absolute difference betweenpotential and actual exports in value terms, leaving room to realize additional exports worth USD18.6 bn. These numbers are significant in the view of rising trade volatility.Figure 3: India’s products with Export Potential (ITC Export Potential Map)This infographic is available here.Drivers of India’s ExportsIt is also important to understand what drives India’s exports. Indian exports are sensitive toprice changes, global demand and supply side bottlenecks. The way our export basket hasevolved over the past two decades, it has made them much more responsive to global demandas compared to price changes. This is because India now exports more income sensitive itemslike engineering goods, petroleum, gems and jewelry and chemical products. As per a 2015IMF paper, in the long- run, “a 1% increase in India’s international relative export prices couldreduce export volume growth by about 0.9% for all industries and by about 1.1% for themanufacturing sector.” The long-run coefficient on global demand is estimated to be slightlyabove 1.5, which suggests that India’s exports are more sensitive to changes in external demand
than price changes. Thus, given the export basket composition first, increase in global demanddrives India’s exports much more than price cuts.Further, the IMF research suggests that binding supply-side constraints like energy shortagesdampen price responsiveness of exports. In case of industry with an energy share of about 4%in the gross value of its output (which is about the average share in manufacturing), a 1%relative price depreciation will result in export growth of 0.6%. However, in the same industryin case of energy deficit of about 10%, the export growth will decline to 0.4%. Second, showsthat tackling the issue of energy deficit can boost export performance considerably.Similarly, higher logistics costs have been a major impediment to export growth. Variousstudies peg logistics cost in India to be around twice of that in developed countries. Averagelogistics costs in India are about 15% of GDP while such costs in developed countries are about8%. Improving Ease of trading is a high priority area for the government as Indian exportersface high transaction costs making them less competitive in the global market. The EconomicSurvey 2017-18 also points out that, “Improved logistics have huge implications on increasingexports, as a 10% decrease in indirect logistics cost can contribute to around 5-8% of extraexports.”In the Global Competitiveness Index 2017-18 compiled by the World Economic Forum, whileChina ranks 27th, India is placed 13 points below at the 40th place. Competitiveness as a factorplays out crucially in determining export advantage nations have. Table 3 compares India andChina on few key competitiveness metrics.Table 1: Global Competitiveness Indicators 2017, compiled by World Economic Forum (WEF)There is no doubt that China is way ahead of India in terms of its manufacturing capability andexport performance. United Nations Industrial Development Organization’s (UNIDO) CIP
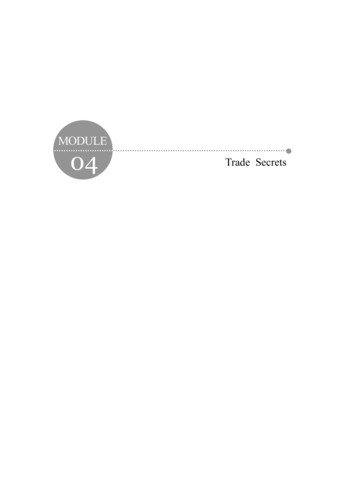
(Competitiveness of Industrial Production) is a composite index that measures “the ability ofcountries to produce and export manufactured goods competitively”, with 1.0 being the bestscore. The CIP consists of eight sub-indicators grouped along three dimensions of industrialcompetitiveness—capacity to produce and export manufactures, technology deepening andupgrading, and world impact. India’s CIP score improved from 0.04 in 2000 to 0.07 in 2010.In comparison, China’s CIP score improved from 0.16 in 2000 to 0.33 in 2010. While Indiamanaged to increase its share in world manufacturing value added from 1.1% in 2000 to 2.0%in 2010, China more than doubled its share from 6.7% to 15.0% over the same period. Thetechnological backwardness of Indian manufacturing exports can be gauged by the share ofmedium and hi-tech activities. India’s share in manufacturing exports improved from 18.7% in2000 to 28.2% in 2010, but is still far behind that of China’s, 60.2% in 2010.India’s experience with Free Trade Agreements (FTAs)Regional trade agreements (RTAs) have become increasingly prevalent since the early 1990s.RTAs cover more than half of international trade and operate alongside global multilateralagreements under the World Trade Organization (WTO). The first eleven years (1995-2005)of the WTO were paralleled by a tripling of RTAs from 58 to 188. Currently, 455 RTAs are inforce globally. 14 RTAs are in force in India with a dozen more under negotiation.Figure 4: Evolution of Regional Trade Agreements in the World, 1948-2018Regional Trade Agreements today go beyond tariff cuts in trade in goods and incorporatevarious other components like liberalization in services, investment etc. The first RTA of whichIndia became a member was the Bangkok Agreement in 1975. In 2005, this regional initiativebetween developing economies was re-incarnated as Asia Pacific Trade Agreement (APTA).India’s first bilateral FTA with Sri Lanka (ISFTA) came into effect in March 2000.
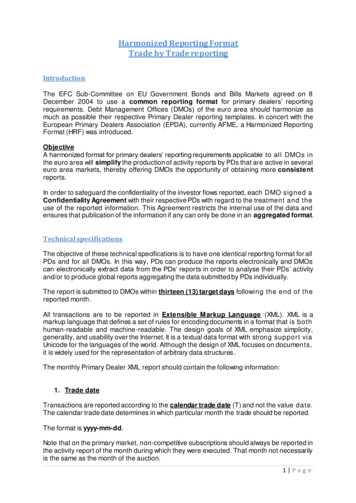
In the past decade India’s trade policy has seen a marked shift towards regionalism.Overlapping RTAs are a consequence of their proliferation. For example, India has an RTAwith Malaysia and Singapore separately while they are also a member of India ASEAN CECA.Another interesting example is Sri Lanka wherein an Indian trader can use either of the fourRTAs for trading with Sri Lanka. The multiplicity of RTA’s may lead to inconsistencies.Before we delve into tariff modalities of some key FTAs and impact on specific sectors somekey macro takeaways from India’s experience with respect to some comprehensive agreementsthat India has signed in the past decade, here are some stylized facts about India’s exports story. India’s exports to FTA countries has not outperformed overall export growth or exportsto rest of the worldFTAs have led to increased imports and exports, although the former has been greaterIndia’s trade deficit with ASEAN, Korea and Japan has widened post-FTAsAccording to Economic Survey 2016-17, FTAs have had a bigger impact on metals onthe importing side and textiles on the exporting side.A 10% percent reduction in FTA tariffs for metals increases imports by 1.4 %India’s exports are much more responsive to income changes as compared to pricechanges and thus a tariff reduction/elimination does not boost exports significantlyUtilisation rate of RTAs by exporters in India is very low (between 5 and 25%)We analysed the growth rate of India’s exports to countries and trade blocs with whom Indiahas a trade agreement and also with rest of the world with which India does not have a tradeagreement. Since 2006 (India has signed most of its RTAs after 2006), India’s exports to RTApartners increased by 13% y-o-y. The trend to non-partner countries was no different withexports increasing at the same pace (chart below). Thus, export to RTA countries has notoutperformed overall export growth, in fact, export to RTA countries parallels the trend growthas with other exports. Thus, India’s export surge could be attributed more to diversification ofIndia’s export basket both in terms of destination and commodities and favourable globalconditions and less to RTAs. As data on actual trade flows through the preferential route is notavailable, we cannot bifurcate this data into preferential (FTA route) and Most favoured Nationroute.
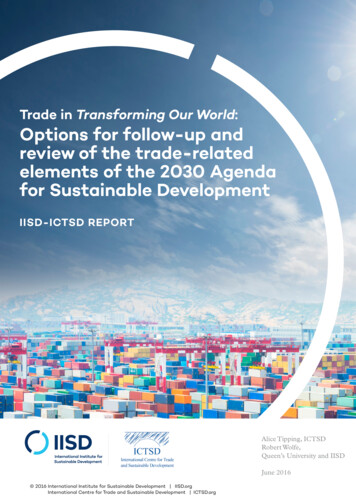
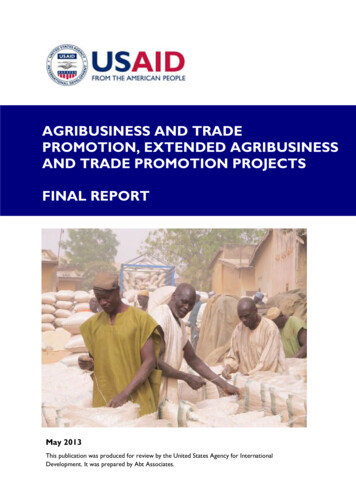
India's exports (%y-o-y)50403020100-10-20-30FTA exportsoverall exportHowever, the utilization rate of India’s FTAs is very low. Most estimates put it at less than 25%. Lackof information on FTAs, low margins of preference, delays and administrative costs associated withrules of origin, non-tariff measures, are major reasons for underutilization.ASEAN, Japan and Korea FTAs- assessmentWe analyze four key FTAs India has signed, with ASEAN, Korea, Sri Lanka and Japan (as they arethe most comprehensive ones). Some stylized facts are:(a) Bilateral trade increased increase post signing of all the above FTAs(b) Imports from these FTA partners into India increased more than India’s exports to partner countriespost signing of FTAs(c) As imports from Korea, Japan and ASEAN have shot up after the respective agreements came intoforce, India’s trade deficit with these countries has increased since then. Only exports to Sri Lankahave increased much more than imports into India from Sri Lanka.
(d) Overall trade deficit with ASEAN, Korea and Japan doubled to USD 24bn in FY17 from USD15bn in FY’11(signing of the respective FTAs) and USD 5bn in FY’06. Trade deficit with Korea grewfrom USD 5bn in FY’10 to USD 8bn currently. With Japan, deficit grew from USD 3bn in FY10 toUSD 6bn currently and with ASEAN deficit doubled to USD 10bn from USD 75bn in FY11.India's trade with ASEAN (USDbn)India's trade with Japan (USDbn)50403020100Imports from ASEANImports from JapanExports to ASEANIndia's trade with Korea (USDbn)Signed 2010Exports to JapanIndia's trade with Sri Lanka(USDbn)1510Signed 12108642010.0Signed 9FY10FY11FY12FY13FY14FY15FY16FY170Imports from KoreaExports to KoreaFY00FY02FY04FY06FY08FY10FY12FY14FY16Imports from Sri LankaExports to Sri LankaThat said, the ASEAN FTA does seem to have the biggest trade impact, which makes sense, since thisarrangement saw the greatest reduction in Indian import tariffs. Liberalization under the India-ASEANFTA covers 75% of the two-way trade. India offered around 9000 products (at the HS 8-digit level)for tariff elimination (NT-1, NT-2) out of about 12000 tariff lines, 1800 lines in sensitive track andalmost 1300 lines in exclusion. Thus India kept around 10% of their tariff lines in exclusion, Thailand,Philippines, Myanmar, Brunei and Vietnam kept more number of tariff lines under exclusion comparedto India. Motor vehicles, textiles, petroleum products, sugar, wheat, vegetable oil dairy products andother food products were under exclusion/sensitive track in India’s listGiven higher margin of preference (MFN-preferential duty) offered by India under the FTAs the surgein imports is much higher compared to surge in exports for India. As per Economic Survey FY’16,average effect of an FTA is to increase overall trade by about 50 percent over roughly four years. Thesurvey also finds out that bigger impact on metals on the importing side and textiles on the exportingside. It analyses FTA tariff reduction in four major sectors: textiles, metals, automobiles and
machinery. The comparator group in this section consists of both non-FTA countries and all sectorsother than the four major ones listed above. On the import side, a ten percent reduction in FTA tariffsfor metals and machinery increases imports by 1.4 per cent and 2.1 per cent respectively, compared toother products from FTA or all products from Non-FTA countries (note this is the marginal effect ofimporting metals and machines from FTA countries relative to all products from Non FTA countries).However, the effect on auto imports is not significantly different from the comparator group. This isalso because the auto sector is highly protected in India with most of tariff lines under exclusioncriteria under different FTAs. On similar lines, textile exports to FTA countries increase by 2 per centrelative to comparator group for 10 per cent decrease in tariffs.Sector-wise impact of FTAsQuality of trade has also deteriorated under India ASEAN FTA. Apart from the surge in total tradedeficit due to tariff cuts, a close look at the sector wise trade flows also paints a grim picture. As perthe UN’s Harmonised system of product classification, products can be grouped into 99 chapters andfurther into 21 sections like textiles, chemicals, vegetable products, base metals, gems and jewelry etc(similar to sector classification). The analysis shows that trade balance has worsened (deficit increasedor surplus reduced) for 13 out of 21 sectors. This also includes value added sectors like - chemicalsand allied, plastics and rubber, minerals, leather, textiles, gems and jewellery, metals, vehicles, medicalinstruments and miscellaneous manufactured items. Sectors where trade balance has improved includeanimal products, animal and vegetable fat, wood and articles, paper and paperboard, cement andceramic, arms and ammunitions. Sectors where trade deficit has worsened account for approximately75% of India’s exports to ASEAN. Trade surplus sectors have also shown only marginal improvement.Overall it can be concluded that India’s quality of trade has not improved under AIFTA. India’s tariffrates declined for Japan-FTA from 11.4% to 7.5% and for Korean-FTA decline from 11.1% to 8.3%.This had implications for the domestic industry.
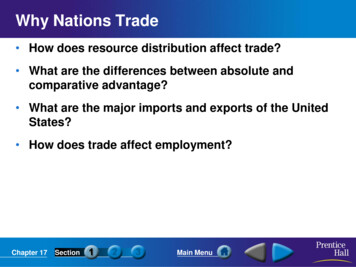
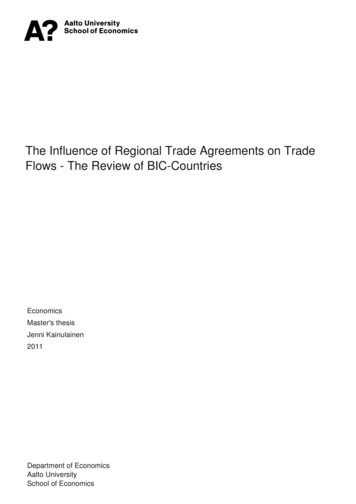
Recent case in hand: The steel dispute at WTO with Japan. In September 2015, Indiaimposed provisional safeguard duty of 20 per cent on import of certain categories ofsteel with a view to protect domestic producers.Recent case in hand: Paper imports from Korea with Basic Customs Dutyprogressively moving towards nil by January 2018 while domestic capacity remainingunderutilized.The Chinese threat to India: FTA with China ?China is India’s biggest trading partner accounting for almost 10% of India’s overall trade. Sino-Indianbilateral trade increased from a mere USD1.8bn in FY00 to USD 72bn in FY17 making China India’sbiggest trading partner. The trade specially picked up after China’s accession to WTO in 2001. China’strade surplus with India rose from USD 0.6 bn in FY01 to touch USD52bn in FY17.China accountsfor almost half of India’s total trade deficit. India’s exports to China have grown at an average of 13%since FY04 while Chinese imports into India have increased at 26% y-o-y (almost double that of exportgrowth). This has led to a widening trade gap between the two countries.Below are some numbers which explain the sharp rise in India’s trade deficit with China. China’sexports to India rose from USD 4bn in FY04 to USD 61bn in FY17 while imports from India grewfrom USD 3bn in FY04 to USD 10bn in FY17. China’s share in India’s imports from the world is 15%while India exports only 4% of its exports to China. China’s phenomenal export performance has beenexpedited by its accession to World Trade organisation (WTO) in 2001. China today is the leadingexporter in the world and accounts for 14% of global exports. China accounts for the top share in globalexports various items, like electrical and electronic equipment; machinery and boilers; furniture,lighting and signs; articles of apparel, accessories; iron and steel and its articles; aluminium andarticles; organic chemicals; and articles of leather. Regional production networks in Asia have grownsubstantially in the past decade largely centered on China. China is also the second largest globalimporter in the world, after the US, with a share of 10% in world’s imports. China is presently theworld’s leading importer major items like electrical, electronic equipment; ores, slag and ash; optical,photo, technical, medical, apparatus; plastics and articles; copper and articles; oil seed, oleaginousfruits, grain, seeds and fruits; cotton; and leather etc.India’s overall trade deficit with China has risen thirteen fold in the past decade. In fact, China nowaccounts for about 50% of India’s trade deficit. This trade asymmetry is compounded by the nature ofgoods flow. India tends to export primary materials such as ores, minerals and cotton, whereas Chineseexports to India are mostly a wide variety of sophisticated products higher up in the value chain (withhigher profit margins and which create more jobs at home) like capital and manufactured goods.China’s export basket is better diversified than that of India’s. It is this composition of bilateral tradewhich worries Indian policy makers more. Export of non-ferrous metals, iron ore and cotton constitutedalmost 50% of Indian export to China whereas about half of the total share of the imports from Chinacomprised electrical machinery and telecom equipment, nuclear reactors and boilers. Thus, India’s
exports to China are significantly different from its exports to the rest of the world. For India, China isyet to emerge as an important destination for India’s most significant exportsIndia China trade (USDbn)100.050.00.0FY4 FY5 FY6 FY7 FY8 FY9 FY10 FY11 FY12 FY13 FY14 FY15 FY16 FY17-50.0-100.0Export to ChinaImports from ChinaTotal tradeIndia's Trade balance with ChinaSource: CEIC: A Euromonitor Institutional Investor CompanyIndia’s trade with China (FY’17)India: major Imports from China% shareElectrical Machinery, Telecom Eqpt,Audio & Video nicalAppliances18India: major exports to China% shareOrganic chemicals9Plastic and articles3Organic chemicals8.7Mineral Fuels, Oils, Waxes &Bituminous Substances7.8Ships, boats and floating structuresIron and steel2.42.2Fertilisers2Source: MoCI, Export import databank FY17Ores, Slag and Ash16.2Cotton13.2Copper and articles6.9Salt, Sulphur, earths and calAppliances5.2
“China’s emergence as a great economic power has induced an epochal shift in patterns of worldtrade. Simultaneously, it has challenged much of the received empirical wisdom about how labormarkets adjust to trade shocks. Alongside the heralded consumer benefits of expanded trade aresubstantial adjustment costs and distributional consequences. These impacts are most visible in thelocal labor markets in which the industries exposed to foreign competition are concentrated.Adjustment in local labor markets is remarkably slow, with wages and labor-force participation ratesremaining depressed and unemployment rates remaining elevated for at least a full decade after theChina trade shock commences. Exposed workers experience greater job churning and reduced lifetimeincome with gains yet to materialize ”David Autor, American Economic Review (2016)India’s learnings from China-ASEAN FTASince full enactment of the ACFTA in 2010, ASEAN- 6 countries’ (Indo, Malay, Thai, Viet, Phil,Sing) goods trade with China has gone from a surplus of USD 53bn to a deficit of USD 54bn in 2016.China's trade balance with ASEAN-640200-20-40-60-80-100ASEAN trade balance with 232016332-15-32-10-32Thailand and Malaysia are the only countries which have a trade surplus with China. However, thesurplus has reduced since 2010.China has been the largest market for ASEAN exports of parts andcomponents (intermediate goods) since 2004. The substantial trade between the two countries was aresult of surge in intermediate goods trade particularly in IT and electronics goods. With the exceptionof Brunei, Cambodia and Laos, all ASEAN countries significantly participated in the trade ofintermediate goods.Consumer electronics and car parts and components are particularly important in Regional ValueChains between ASEAN and China, with Singapore, Malaysia and Thailand playing a key role, whileRVCs in textiles and clothing are significant only for CLMV (Cambodia, Laos, Malaysia andVietnam). China lags behind ASEAN in the competitiveness of electronics production chain. A studyof the trade flows between the two partners as per 2-digit HS code reveals that the key drivers of tradebetween ASEAN and China are – machinery, electrical equipment, mineral products and fuels .Malaysia and Thailand’s trade surplus with China is primarily due to surplus in the machinery andelectric equipment, mineral fuels and oil category. Philippines also has a trade surplus in electricmachinery, equipment and appliances wrt China. Vietnam maintains a trade deficit across all
categories with China. Indonesia also maintains a trade deficit with China in all categories exceptmineral fuel, oils and vegetable oil. Thus Indonesia is not fully integrated into the regional value chainunder the China ASEAN FTA. While looking at the benefits generated from an FTA in terms of RVCscreated under China ASEAN FTA, India should look at Indonesia’s role in China ASEAN FTA andnot compare itself to Malaysia and Thailand. It is important to note that China maintains a trade surpluswith all ASEAN countries in categories like - base metals, textile apparel and auto and auto partsGiven China’s current structure with excess capcity in most industries, subsidies to somesticindusyries and its price competiitveness across sectors, it is not surprising that China currently has themaximum number of Anto dumping duty initiations against it. Its worth noting that nearly one-sixthof anti-dumping cases on China are from India (149/840).Case In Hand: Imports of ‘Toluene Di-Isocyanate (TDI)’ originating in or exported from China PR,Japan and Korea RP. (13th December, 2017).This bring us to a very important question- What are we trying to achieve out of RCEP?Regional comprehensive Partnership Agreement (RCEP) is a proposed free trade agreement (FTA)between 10 ASEAN countries and their six FTA partners, namely Australia, China, India, Japan, Koreaand New Zealand. It accounts for 25% of global GDP, 30% of global trade, 26% of FDI flows and45% of the total population. From India’s point of view RCEP is critical. RCEP countries account foralmost 27% of India’s total trade. Exports to RCEP account for about 15% of India’s total exports andimports from RCEP comprise 35% of India’s total imports. India runs a trade deficit with ASEAN aswell as the partner countries of RCEP. India’s trade deficit with the bloc has risen from 9 billion inFY05 to 83 billion in FY17, of which China alone accounts for over 60% of the deficit. India alreadyhas bilateral FTAs with ASEAN, Korea and Japan and negotiations are underway with Australia andNew Zealand. There is also termendous pressure on India to complete negotiations on time and offertariff eliminations on majority of the tariff lines (more than what was negotiated under AIFTA). MostRCEP contries see India has a huge potwntial market for their exports.Given India’s inability to negotiate a good services deal in the past, RCEP negotiations especially withChina need a second thought. Indian industry will have more to lose than gain if it agrees to a liberaltariff elimination schedule specially w.r.t China.A separate tariff schedule for different partnercountries has already been rejected by member countries. At a time of growing protectionism and US’sstance towards China opening our market to China can be prove to be disastrous given proper standardsand processes are not in place in India. Trade agreements are a means to promote bilateral trade, withboth parties benefitting as a result of tade complementarities. With China, India’s trade seem to bevery skewed and China’s capcity overhang in most sectors may lead to a surge of imports into Indiawith very limited access for Indian exports into the chinese market.
India’s trade balance with RCEP (USDbn)India's trade deficit with RCEP countries (USDbn)0.0-10.0ChinaASEANKoreaAustraliaJapanNew Zealand-20.0-30.0-40.0-50.0-60.0While RCEP negotiations at the current stage need a careful thought, India’s current trade pacts alsoneed a rejig. India seems to have underutilised its existing FTAs. The percentage of India’sinternational trade routed through the preferential route/FTAs is very low. According to the AsianDevelopment Bank, the utilisation rate of India’s FTAs varies between 5% and 25%, which is one ofthe lowest in Asia. Moreover, exports to FTA partner countries and non-partner countries have grownat the same pace. Complex rules of origin criteria, lack of information on FTAs, higher compliancecosts and administrative delays dissuade exporters from using preferential routes. The compliance costof availing benefits under these FTAs is so high that exporters prefer using the normal route. India hasactively pursued FTAs with several major trading partners in the past without benefitting much.Some Policy RecommendationsBefore getting into any multilateral trade deal india should firstly, review and assess its existing FTAsin terms of benefits to various stakeholders like industry and consumers, trade complementarities andchanging trade patterns in the past decade. Second, negotiating bilateral FTAs with countries wheretrade complementarities and margin of prefeence is high may benefit India in the long run. Third,higher complicance costs nullify the benfits of margin of preference, thus redu
A NOTE ON FREE TRADE AGREEMENTS AND THEIR COSTS* Dr. V.K. Saraswat1, Prachi Priya2 and Aniruddha Ghosh3 * Disclaimer: Opinions and recommendations in this article are exclusively of the authors and not of any other individual or institution. 1 Dr. V.K. Saraswat is the former DRDO Chief & Secretary Defence R&D, recipient of Padma Shri & Padma Bhushan and is currently Member, NITI Aayog