Transcription
Maryland EnergyAdministration CleanFuels TechnicalAssistance Program:Anne Arundel CountySeptember 29, 2021Submitted to:Maryland Energy AdministrationandAnne Arundel CountySubmitted by:ICF
CFTA Report – Anne Arundel CountyTable of ContentsI.Executive Summary. 3II.Introduction. 4III. Overview of Motivations and Priorities. 4IV. Current Fleet Inventory . 4V.Electrification Best Fit and Availability Assessment . 6VI. Economic Analysis . 9VII. EVSE Needs Assessment Overview. 12VIII. Emissions Analysis . 13IX. Conclusion . 14Appendices . 17Appendix A. Transition Anne Arundel County’s Vehicle Fleet to Hybrid and EVs Memo. 17Appendix B. Assumptions and Calculations. 20Appendix C. EVSE Overview . 21Appendix D. Fleet Vehicle Parking Locations. 22Appendix E. Projected GHG Emissions ICE Replacement Vehicles VersusRecommended EV Replacements . 23Appendix F. Alternative Fuel Life-Cycle Environmental and Economic Transportation(AFLEET) Tool . 24Appendix G. Vehicle Replacement Recommendations. 252
CFTA Report – Anne Arundel CountyI. Executive SummaryThe Maryland Energy Administration (MEA) Clean Fuels Technical Assistance (CFTA) Programhas provided this fleet advisory service for Anne Arundel County, through a partnership withICF, and support from Maryland Clean Cities. ICF analyzed Anne Arundel County’s on-roadvehicle fleet comprised of 1,600 vehicles, recommending 1,489 internal combustion engine(ICE) vehicles for electrification based on available electric vehicle (EV) make and modelavailability, which includes 1,289 battery electric vehicles (BEV) and 200 plug-in hybrid electricvehicles (PHEV). These findings do not include any EV or charging station incentives. Theconversions would take place over a 15-year timeframe, with the actual number of vehicleseligible for electrification likely increasing over this time as more EV makes and models becomeavailable.Based on our analysis, converting 1,489 ICE vehicles to EVs in the next 15 years isestimated to produce the following impacts over 31 years of vehicle ownership 1: 47,214,853 total cost of ownership (TCO) savings over 31 years ofvehicle operations 28,612,302 fuel cost savings over 31 years of vehicle operations 32,869,646 maintenance savings over 31 years of vehicle operations228,709 metric tons of greenhouse gas (GHG) eliminated over 31years of vehicle operations23,882,617 gallons of gasoline displaced over 31 years of vehicleoperationsEquivalent to eliminating 26,302 homes’ energy use annually1Based on the Assumptions and Calculations outlined in Appendix B, as then applied to the U.S.Environmental Protection Agency’s Greenhouse Gas Equivalencies as-equivalencies-calculator3
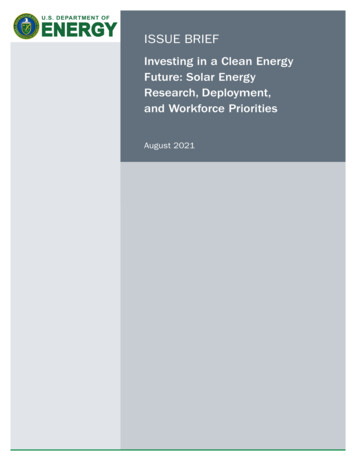
CFTA Report – Anne Arundel CountyII. IntroductionThe State Fiscal Year 2021 (FY21) CFTA Program is a new pilot, test-of-concept program whichaims to provide eligible local government and municipal fleets with technical assistance as theyconsider alternative transportation fuel options. This program is complementary to the MEA’sFY21 Clean Fuels Incentive Program. Through CFTA, a technical assistance contractor (ICF)employed by MEA was tasked to work directly with eligible fleets, selected via an applicationprocess, for the purpose of developing potential alternative fuel fleet strategies. Possiblealternative fuels for evaluation include electricity, ethanol, hydrogen, natural gas, propane, andother biofuels. The participating local government or municipal fleet chooses their preferred fuelfor technical evaluation, after discussions with ICF. Anne Arundel County selected fleetelectrification for their technical assistance assessment.III. Overview of Motivations and PrioritiesIn 2020, Anne Arundel County’s Executive released a memo2 that directed the Office of CentralServices (OCS) to begin the replacement of existing ICE fleet vehicles with EVs, with the goal oftransitioning all procurement of new, non-emergency light-duty vehicles (LDVs) and sport utilityvehicles (SUVs) to 100% EVs by FY37. The OCS also directed the County to begin long-rangeplanning to identify vehicles, infrastructure, maintenance, and personnel needed to successfullyelectrify the fleet over the next 15 years.As of August 2021, Anne Arundel County does not have any EVs in their fleet and is utilizing theCFTA Program to help plan fleet electrification, provide an overview of general charging needs,and estimate TCO savings potential. This fleet electrification evaluation factored in ArundelCounty fleet vehicles primarily being collocated on government property and domiciled atemployee homes. As the County begins fleet electrification, it will need EV and electric vehiclesupply equipment (EVSE) usage training for drivers and maintenance training for fleet andfacilities responsible for maintaining EV and EVSE.The County plans to complete an EVSE siting analysis to meet the needs of their fleetelectrification plans. Currently, the County has not purchased or installed any county-ownedEVSE on government property. Baltimore Gas & Electric (BGE) has installed several EVSE inthe County, helping provide short-term charging opportunities for early electrification.IV. Current Fleet InventoryAnne Arundel County provided fleet data for 1,600 vehicles. ICF’s evaluation included all 1,600on-road light-, medium-, and heavy-duty fleet vehicles. All vehicles operate on gasoline or dieselfuel. No emergency response vehicles were evaluated in this study. The County has no EVs inthe fleet and does not own or operate any EVSE but is working on launching five EVSE pilots atthe health department, schools, and offices across the county.Anne Arundel’s evaluated fleet is primarily composed of SUVs (61%) and light-duty pickups(18%), as seen in Figure 1. All fleet vehicles evaluated have been purchased by the County, noleased vehicles are included in this fleet.2See Appendix A.4
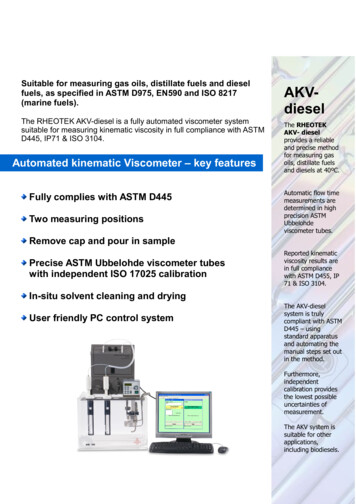
CFTA Report – Anne Arundel CountyFigure 1. Existing Fleet by Vehicle TypeICF also looked at all vehicles eligible for retirement over the next 15 years, as shown in Figure2, and evaluated electrification opportunities based on EV model availability as announcedthrough the end of April 2021. Only one round of vehicle replacements was evaluated for thisassessment, and it was determined the current fleet will be entirely replaced by 2028.Figure 2. Existing Fleet Retirement Schedule5
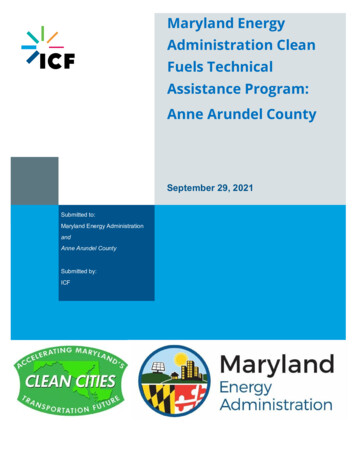
CFTA Report – Anne Arundel CountyThe exact vehicle retirement schedule is based on the assumptions identified by ICF and AnneArundel County, as shown in Appendix B. 3 The exact vehicle replacement schedule will likelyvary considerably from the proposed retirement schedule due to feasibility and financialconstraints, with larger numbers of vehicle retirements beginning in 2024. While County vehicleretirement criteria will be met in some cases prior to 2022, 2023, and 2024, the County may notbe able to feasibly take vehicles out of rotation and purchase new vehicles for a few more years.V. Electrification Best Fit and Availability AssessmentICF utilized the market mix4 of existing and future EV model available, as outlined in Figure 3,for Anne Arundel’s fleet electrification analysis.Figure 3. EV Model Availability by Vehicle TypesOverall, up to 1,489 vehicles are eligible for electrification based on current and announced EVmake and model availability. Table 1 shows the recommended quantities, by vehicle type, to bereplaced by EVs over the next 15 years.3Due to the timing of this report, the County may choose to wait until 2022 to begin implementing the recommendedfleet retirement and electrification schedule.4Through April 2021.6
CFTA Report – Anne Arundel CountyTable 1. 15-Year Electrification RecommendationsSedanSUVLight-Duty PickupMedium-Duty PickupVanSchool BusTOTALCurrentFleet11997728553130361,600Quantity Recommendedfor Electrification709752855310601,489The replacement timeline for the 1,489 fleet vehicles recommended for electrification can beseen in more detail below in Figure 4. In Figure 4, vehicle replacements take place over 8 yearsdue to the assumptions and data identified by ICF and Anne Arundel, but replacements mayend up starting in 2024 and taking more than 8 years to complete.Figure 4. Recommended EV Replacement Timeline by Vehicle TypeThe electrification schedule begins predominately with SUVs, with ICF’s analysis recommending277 for replacement in 2021. SUVs represent most vehicle replacements in 2021, 2022, 2023,7
CFTA Report – Anne Arundel Countyand 2027, with the remaining vehicle types being replaced in smaller amounts over time. From2024 to 2026, light-duty pickups become the largest replacement groups. The final two years ofvehicle replacements are one van per year in 2029 and 2030.For future models recently announced and currently nascent EV types, recommendations forelectrification do not take place until price parity between EV and ICE vehicles over TCO isachieved. Notably, no school buses are recommended for replacement at this time. If schoolbus-specific funding becomes available in the future, this recommendation may change.Alternatively, there is a scenario in which many vehicles recommended for replacement in 2021will not be replaced with EVs due to budgetary concerns and vehicle replacement cycle timing.As noted above, vehicle replacement may begin in 2024. While this timing may delay fleetelectrification, it will likely result in larger first-generation electrification TCO savings for the fleet.If the County ends up beginning electrification closer to 2024, there will be a larger number ofEVs to choose from, potentially shifting vehicle replacement recommendations. Similarly, as theEV market develops and continues making technological advancements, the County can expectthe purchase price of EVs to drop and more favorable electricity rates for EV charging tobecome readily available. Delaying electrification means that, while the County will still see TCOsavings, the County would not begin seeing savings until 2024.Of the existing fleet vehicles, Figure 5, below, shows what fuel types could replace the existingfleet from 2020 through 2036. Most vehicle replacements will be EVs, with some fleet vehiclesbeing replaced by ICE vehicles.Figure 5. Recommended EV Replacement Timeline by Fuel Type8
CFTA Report – Anne Arundel CountyVI. Economic AnalysisTo determine the TCO, the vehicle lifespans of the 1,489 vehicles suggested for electrificationwere evaluated. The incremental EVSE needed to charge these vehicles, the assumed cost ofEVSE purchase, installation, and grant opportunities were included in TCO calculations.These assumptions include installing Level 2 and direct-current fast charging (DCFC) EVSEcharging stations. Figure 6 includes the cost of all 1,489 EVs and recommended EVSE over theentire vehicle lifespans compared to the traditional ICE vehicle replacement. No financialincentives were included in this TCO analysis.Figure 6. Fleet TCO Comparison: Net Present Value Costs Over Vehicle LifespansPlease see U.S. Department of Energy’s (DOE) Alternative FuelsData Center for all currently available Maryland and Federal EV andEVSE incentives. Information is also available at MarylandEV.org.9
CFTA Report – Anne Arundel CountyDifferent vehicle types are responsible for different average electrification TCO savings. Electricheavy-duty vehicles typically have much larger capital costs than their traditional counterpartsand are less frequently available. Anne Arundel’s fleet consists of mostly light- and medium-dutyvehicles, making the opportunity to capitalize on existing TCO savings more easily accessible.Table 2 outlines the TCO savings projected for Anne Arundel County by vehicle type.Table 2. TCO Savings by Vehicle TypeVehicle TypeSedanSUVLight-Duty PickupMedium-Duty PickupVanTOTALTCO Savings 485,762 29,827,668 9,593,512 2,021,278 5,286,633 47,214,853If Anne Arundel decides to pursue financial incentives, such as the MEA Clean Fuel IncentiveProgram which was available in FY21, then additional vehicles and vehicle types are alsofinancially beneficial for electrification.Table 3 provides a breakdown of the infrastructure assumptions made in the TCO modeling, toallocate EVs and EVSE plugs. Depending on vehicle duty cycle and application, the number ofvehicles per plug may fluctuate. For example, if vehicles are fully rotated throughout the day,less plugs may be needed, while more plugs may be needed for vehicles on the same dutycycle which need to charge simultaneously. Similarly, the analysis assumes that domiciledvehicles will have access to Level 2 chargers at their workplace or at home, requiring fewer onsite Level 2 plugs for overnight charging. See the DOE Alternative Fuels Data Center for moreinformation about Charging Infrastructure Procurement and Installation, including average costs.Table 3. Number of EVs per Plug and Charger Level AssumptionsVehicle TypeSedanSUVLight-Duty PickupMedium-Duty PickupVanSchool BusEVs per Plug222444Charger LevelLevel 2Level 2Level 2DCFCDCFCDCFCAs vehicles are replaced through 2035, lifespans extend beyond 2035 and TCO calculationsextend out to 2050. The TCO comparisons in Figures 7 and 8 show that TCO savings willalmost always be realized annually, except for the first 2 years of electrification. After the initialcapital costs associated with purchasing EVs to replace existing ICE fleet vehicles, the yearsfollowing 2022 will all provide operational savings.10
CFTA Report – Anne Arundel CountyFigure 7. Cumulative TCO Comparison From 2021 to 2050Figure 8. TCO Comparison by YearThis report estimates the payback period, with incentives, for purchase fleet electrification toend in 2041. However, the length of the payback period can be significantly influenced by theamount of financial incentives Anne Arundel pursues and wins. The more funding the Countyobtains for EVs and EVSE, the shorter the payback period.11
CFTA Report – Anne Arundel CountyAs noted in Section V, the County may not be able to replace fleet vehicles with EVs until 2024.In this case, the TCO savings noted in this report will be delayed for the first three years of thereplacement cycle. Current projected TCO for 2021, 2022, and 2023 are noted in Table 4.Table 4. Projected TCO Costs for 2021 to 2023ICE TCOEV Replacement TCO2021 11,919,258 14,051,6202022 22,612,216 25,029,1102023 36,141,283 36,913,102While the current analysis projects the TCO costs to break even in 2024, delaying fleetelectrification until 2024 will not guarantee the same results, due to changes in EV purchaseprices, infrastructure costs, maintenance and training costs for employees, and more. Manyvehicles not currently recommended for electrification by 2035 will likely become eligible forelectrification beyond 2035. As new makes and models become available and technologydevelops, it is expected that later and subsequent EV purchases will be less expensive due tomore accessible and affordable EV options.VII. EVSE Needs Assessment OverviewTable 5 provides a more in-depth breakdown of the EVSE infrastructure assumptions made inthe TCO modeling. Using Table 5 as a potential guide can help Anne Arundel strategically planEVSE installation to limit infrastructure costs. While this fleet electrification analysis does notinclude a complete EVSE needs and siting assessment, these preliminary results can help AnneArundel begin planning for future infrastructure build out. Appendix C provides an overview ofEVSE types and a breakdown of how to assess EVSE needs.Table 5. EVSE Considerations by Vehicle Type5Vehicle TypeSedanSUVLight-Duty PickupMedium-Duty PickupVanTOTALNumber of VehiclesRecommended for 5000132740The County plans to rely on BGE’s Level 2 EVSE for short-term charging needs, however theywill have to pay commercial charging rates. Installing county-owned EVSE will result in a lowercost/kWh to charge fleet vehicles in the future and should be prioritized long-term. Whenconsidering where to begin charging infrastructure construction, locations with the highestnumber of fleet vehicles should be prioritized to ensure charging demand is met. Table 6provides shows the five locations with the most fleet vehicles. Appendix D provides an overviewof the number of vehicles at each County parking location.Table 4 offers projected Level 2 and DCFC EVSE needs based on current model assumptions andnumber of vehicles recommended for electrification.512
CFTA Report – Anne Arundel CountyTable 6. County Parking Locations with the Most Vehicles6Locations445 Maxwell Frye Rd, Millersville, MD 21109Heritage Office Complex435 C Maxwell Frye Road, Millersville, MD3 Harry S. Truman Parkway, Annapolis, MD 21401437 Maxwell Frye Road, Millersville, MD 21108Number ofVehiclesIdentified forElectrification5959252017Similarly, as the County begins planning EVSE installations, it should assess the fleet’s currentand future charging needs. Recommendations on how to futureproof charging infrastructureinclude, but are not limited to, the following: Determine the number of vehicles that will need EVSE in the short- and long-term;Identify the number of existing parking spaces at various locations;Identify the number of parking spaces with the electrical capacity to install Level 2 EVSE;Evaluate electrical panel distribution voltage and capacity;Standardize EVSE siting design (e.g., signage, 7 accessibility,8 use requirements, parkingspace design, Americans with Disabilities Act requirements,9 etc.) and permitting; and,Adopt building codes10 that require pre-wiring compatible with EVSE installation.VIII. Emissions AnalysisImprovements in vehicle fuel economy and technologies, have provided incremental vehicleemissions savings over the years. However, converting an ICE vehicle to an EV will provide asignificant, immediate emissions savings at a much larger scale than choosing a more fuelefficient ICE vehicle. Converting 1,489 ICE vehicles to EVs would potentially save Anne Arundel228,709 metric tons (MT) of GHG emissions over the lifespan of all converted EVs, through2050. Additionally, 134 MT of NOx will be reduced over the lifespan of all converted EVs,through 2050. Figure 9, below, shows the emissions trajectory of the replacement with new ICEvehicles versus the replacement with EVs. This includes factoring in the petroleum fuelreductions, offset by a potential electricity consumption increase.6Provided by Anne Arundel County on May 26, 2021. This reflects the number of vehicles assigned to each parkinglocation as provided by the County. This does not reflect the vehicle department assignments.7U.S. Department of Energy Alternative Fuels Data Center, Signage for PEV Charging Stations, retrieved fromhttps://afdc.energy.gov/fuels/electricity charging station signage.html8 California PEV Collaborative, Accessibility and Signage for PEV Charging Infrastructure, retrieved tachments/ca accessibility for ev charging.pdf?15248610819 Guidance in Complying with ADA Requirements, U.S. Department of Energy, 2014, retrieved CC complyingwithADArequirements 1114.pdf10 IECC, Proposed Changes to the 2019 International Codes, up-B-CAH-compressed.pdf13
CFTA Report – Anne Arundel CountyFigure 9. Cumulative Fleet GHG EmissionsThese calculations are for wheel-to-well emissions, balancing the gasoline and diesel emissionssavings with the emissions created to produce electricity, based on the Anne Arundel gridgeneration mix. A more detailed comparison of projected annual GHG emissions levels on arein Appendix E.Estimated lifetime emissions savings per vehicle type for the 1,489 vehicles are available below,in Table 7. Actual emissions per vehicle can vary dramatically based on the vehicle beingreplaced and average mileage.Table 7. Lifetime Vehicle Emissions by Vehicle TypeVehicle TypeSedanSUVLight-Duty PickupMedium-Duty PickupVanTOTALLifetime GHG EmissionsReductions (MT)5,038159,01948,3342,49213,827228,709Lifetime NOx EmissionsReductions (MT)1.362929.40547.12095.833390.2135134IX. ConclusionThis analysis identifies 1,498 vehicles for electrification in Anne Arundel’s fleet over the next 15years. If Anne Arundel follows the recommended replacement schedule for transitioning fromICE vehicles to EVs, the County can expect to see operational savings following 2022 and areduction in GHG emissions up to 228,709 MT.As Anne Arundel begins electrifying its fleet, it should anticipate certain barriers and challenges.The largest barrier that fleets can face when electrifying their fleet is the cost of acquiring EVsand building charging infrastructure. To help minimize the incremental cost of acquiring EVs andrealize all potential cost savings of fleet electrification, Anne Arundel may consider applying for14
CFTA Report – Anne Arundel Countygrant and funding opportunities. While funding availability is not guaranteed, Anne Arundelshould explore the following financial incentives currently offered in Maryland: Zero Emission School Bus Grant Program and Study Solar Canopy EVSE Infrastructure Grant Clean Fuel Incentive Program (CFIP) for EVs and Charging Stations EVSE Workplace Charging Grant EVSE Rebate Program Maryland Smart Energy Communities (MSEC)Incentives available to local governments in Maryland include funding from MEA, VolkswagenSettlement Funds, and potentially future federal funding. When applying for grant funding, theCounty needs to be strategic as some funding opportunities cannot be combined with others.For example, Volkswagen Settlement funds are distributed by the Maryland Department of theEnvironment and cannot be combined with other Maryland-based funding opportunities. Whilethe County can apply for all funding opportunities, it should consider the implications of havingto potentially choose between awards. Similarly, the County should monitor federal activity fornew EV and EVSE incentives that are anticipated to be released.The County can also partner with BGE to pursue public charging stations, however publicstations are not intended for fleet use. Similarly, to realize the lower fuel costs of EVs comparedto ICE vehicles, Anne Arundel should monitor their electricity use to ensure charging occursduring off-peak hours.Along with the cost of vehicle acquisition, range anxiety can present barriers to EV users. Tofamiliarize individuals in charge of operating and maintaining EVs and EVSE, Anne Arundel canuse the following sampling of EV resources to develop educational materials: Maryland EV DOE Alternative Fuels Data Center’s Electricity Basics DOE Alternative Fuels Data Center’s Developing Infrastructure to Charge PEVs DOE’s Electric-Drive Vehicles report DOE’s fueleconomy.gov website for all vehicle models available SemaConnect’s Basics About Charging Stations CALSTART’s Zero-Emission Technology Inventory (ZETI) tool National Alternative Fuels Training Consortium’s Electric Drive Vehicle AutomotiveTechnician TrainingTo ensure Anne Arundel is prepared for fleet electrification, the County should follow theserecommended next steps: Determining the number of vehicles that will need EVSE Identify the number of exiting parking spaces at various locations15
CFTA Report – Anne Arundel County Identify the number of parking spaces with the capacity to install Level 2 EVSE Complete electrical panel distribution voltage and capacity evaluations Standardize EVSE siting design (e.g., signage, accessibility use requirements, parkingspace design, Americans with Disabilities Act requirements, etc.) Streamline EVSE permitting Adopt building codes that require pre-wiring compatible with future EVSE installation Identify and apply for relevant grant funding opportunities to help offset the cost of EVpurchases and EVSE construction Begin implementing the recommended vehicle replacement schedule into the fleetvehicle acquisition plan Develop EV and EVSE usage training for drivers Develop fleet and facilities maintenance training for all employees responsible for drivingor maintaining an EV or EVSE Determine where EVs will be housed overnight Begin a siting analysis to identify potential EVSE installation locations16
CFTA Report – Anne Arundel CountyAppendicesAppendix A. Transition Anne Arundel County’s Vehicle Fleet toHybrid and EVs Memo17
CFTA Report – Anne Arundel County18
CFTA Report – Anne Arundel County19
CFTA Report – Anne Arundel CountyAppendix B. Assumptions and CalculationsKey assumptions and data sources that were used in this analysis include the following: Recommendation Threshold: EVs are recommended only when the EV TCO is 5% ofthe TCO of the comparable ICE vehicle. Vehicle Pricing: The model uses manufacturer suggested retail prices (MSRPs) for EVswhere available. When MSRP pricing is unavailable, the model uses average pricingbased on vehicle and fuel type based on Argonne National Laboratory’s Alternative FuelLife Cycle Environmental and Economic Transportation (AFLEET) Tool and ICF’sComparison of Medium- and Heavy-Duty Technologies in California report for theCalifornia Electric Transportation Coalition. Vehicle pricing was escalated annually usingthe U.S. Energy Information Administration’s (EIA) 2020 Annual Energy Outlook (AEO)and ICF’s Comparison of Medium- and Heavy-Duty Technologies in California report forthe California Electric Transportation Coalition. The model assumes a combination ofowned and lease vehicles. Lease vehicle prices were based as a payment function ofthe 5-year lease, represented as PMT (rate, nper, pv, [fv], [type]) PMT (4%, .33%,MSRP, (5-year lease/vehicle useful life) Annual Mileage: Anne Arundel County provided mileage estimates to utilize. Fuel Costs: The existing fleet fuel costs were estimated using the vehicles’ annualmileage, AFLEET fuel economy assumptions by vehicle and fuel type, and base fuelprices per gallon. The model uses 2.45 per gallon of diesel and 2.20 per gallon ofgasoline rates, as provided by Anne Arundel County. The model escalates gasoline anddiesel pricing annually using projections from the U.S. EIA’s 2020 AEO Reference Casefor Transportation. Maintenance Costs: Existing fleet maintenance costs were estimated using AFLEETdollar per mile assumptions by vehicle type and by fuel type. Maintenance costs wereescalated 2% annually. Additional maintenance savings for EVs may be realized overtime, however an initial capital outlay is needed to train maintenance staff and adjustoperations to handle EVs. Electricity Pricing: The model uses 0.13/kWh base rate, as provided by Anne ArundelCounty. Vehicle Replacements: Anne Arundel County provided vehicle replacementpreferences to utilize. Audi, BMW, and Tesla vehicles were removed from replacementrecommendation options. Timeframe: Based on the vehicle retirement schedule, this analysis focuses on vehiclereplacements for 2021 through 2035, with TCO calculations extending out to 2050 tocapture entirety of vehicle lifespans. Discount Rate: 5% was used for net present value (NPV) calculations. Temperatures: Utilized the average annual Anne Arundel temperatures to calculate theimpact on battery performance and reduced battery range.20
CFTA Report – Anne Arundel CountyAppendix C. EVSE OverviewDOE’s Alternative Fuel Data Center offers resources to better understand EVSE infrastructurerequirements. The following information is a primer of some of the resources available:EVSE Charging TypesDescriptionConnectortype(s)Level 1Alternating CurrentLevel 2Alternating CurrentJ1772 charge portJ1772 charge portDC Fast ChargingUses a standard plug - 120Used for both BEV andvolt (V), single phase service PHEV charging. 208/240 Vwith a three-prong electricalAC split phase service that isoutlet at 15-20 amperage (A) less than or equal to 80 A.UseResidential or workplacechargingResidential, workplace, orpublic chargingLimitationsLow power deliverylengthens charging timeRequires additionalinfrastructure and wiringTime tocharge2 to 5-mi range/1-hrcharging. Depending on thevehicle battery size, PHEVsfully charge in 2-7 hours andBEVs in 14-20 hours10 to 25-m
Assistance Program: Anne Arundel County September 29, 2021. . Anne Arundel County provided fleet data for 1,600 vehicles. ICF's evaluation included all 1,600 on-road light-, medium-, and heavy-duty fleet vehicles. All vehicle s operate on gasoline or diesel fuel. No emergency response vehicles were evaluated in this study.