Transcription
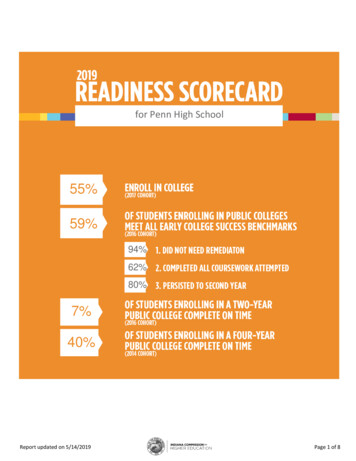
for Penn High School55%59%94%62%80%7%40%Report updated on 5/14/2019Page 1 of 8
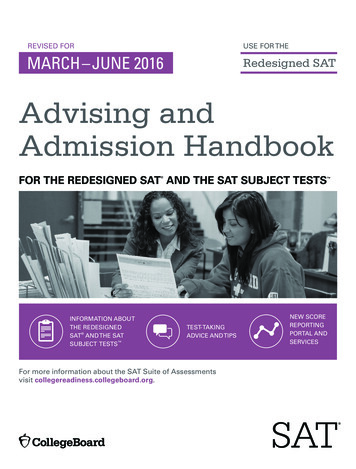
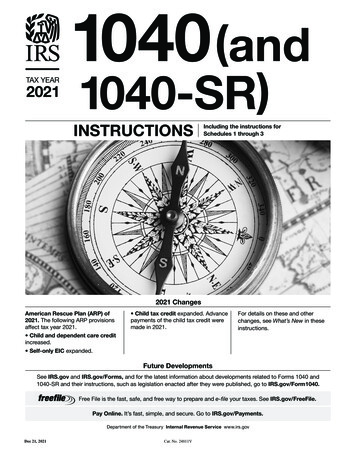
2017 High School GraduatesPenn High SchoolCollege Going (within a year of high school graduation)High School Graduates Enrolling in College# of HSGraduates# Enrolled inCollege% Enrolled inCollegeHonors37134994%Core 4070825135%General15427%Graduated with Waiver2744416%Graduated without Waiver82056068%Took and Passed an AP Test23521591%Took but Did Not Pass an AP Test13011286%Did Not Take an AP Test72927738%Earned Dual Credit from an Indiana Public College58747381%Did Not Earn Dual Credit from an Indiana Public College50713126%625792%1,03254753%Free or Reduced Lunch1497349%Non Free or Reduced High School Diploma TypeHigh School Graduation Waiver StatusAdvanced Placement StatusDual Credit Status21st Century Scholar Status21st Century ScholarNon 21st Century ScholarSocioeconomic StatusRace/EthnicityAll StudentsReport updated on 5/14/2019Page 2 of 8
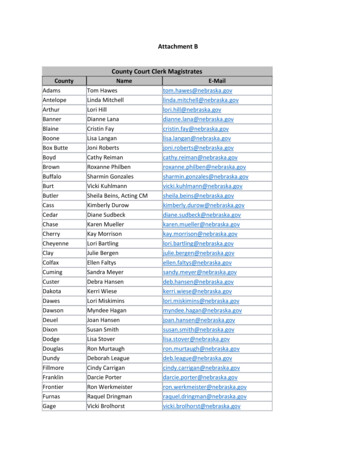
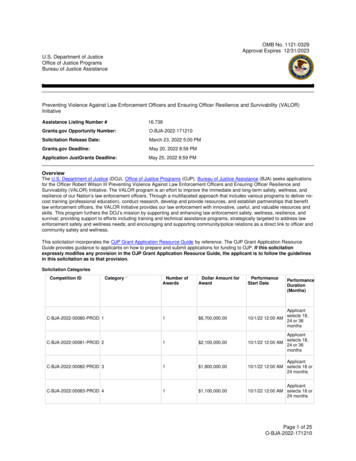
2017 High School GraduatesPenn High SchoolHigh School Graduate Enrollment by College TypeIndiana Public College440% of Total HSGraduates40.2%Indiana Private College (non-profit)676.1%Indiana Private College (for-profit)00.0%Out-of-State Public College504.6%Out-of-State Private College (non-profit)433.9%Out-of-State Private College (for-profit)40.4%Non-degree Granting School00.0%Indiana State-Affiliated Public00.0%49044.8%# Enrolled in INPublic College% of Total Enrolledin IN Public CollegeBall State University409.1%Indiana State University51.1%University of Southern Indiana00.0%Indiana University-Bloomington7116.1%Indiana University-East00.0%Indiana University-Kokomo00.0%Indiana University-Northwest00.0%Indiana University-Purdue University-Indianapolis327.3%Indiana University-South Bend14533.0%Indiana University-Southeast00.0%Purdue University-Fort Wayne61.4%Purdue University-Northwest20.5%Purdue University-Polytechnic Statewide30.7%Purdue University-West Lafayette6715.2%Ivy Tech Community College6815.5%Vincennes University10.2%College TypeDid Not Enroll in College# of HS GraduatesIndiana Public College EnrollmentIndiana Public College Enrollment by CollegeCollegeReport updated on 5/14/2019Page 3 of 8
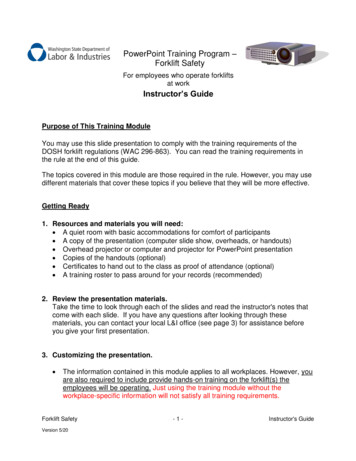
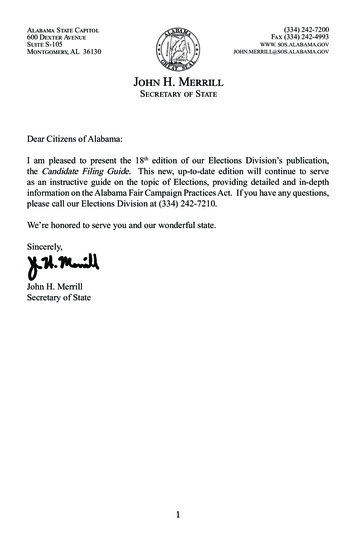
2017 High School GraduatesPenn High SchoolIndiana Public College Enrollment by Degree Type# Enrolled in INPublic College% of Total Enrolledin IN Public CollegeBachelor's Degree (four-year)36683.2%Associate Degree (two-year)6414.5%Award of at least 1 but less than 2 academic years40.9%Award of less than 1 academic year61.4%Unclassified undergraduate00.0%# Enrolled in INPublic College% of Total Enrolledin IN Public CollegeArts and Humanities7718%Business and , Technology, Engineering, and Math (STEM)7918%Social and Behavioral Sciences and Human Services338%Trades245%Undecided194%# Enrolled in INPublic College% of Total Enrolledin IN Public CollegeFull-Time Students37485%Part-Time Students6615%Degree TypeIndiana Public College Enrollment by Program TypeProgram TypeIndiana Public College Enrollment by StatusStatusAcademic PreparationIndiana Public College Remediation by Subject# Enrolled in INPublic College% of Total Enrolledin IN Public College# EarningRemedial Credits% EarningRemedial CreditsMath Only102%990%English/Language Arts Only82%******Both Math and English/Language41%******41895%----SubjectNo RemediationReport updated on 5/14/2019Page 4 of 8
2017 High School GraduatesPenn High SchoolIndiana Public College Students Needing RemediationBreakdown# Enrolled# Earningin IN Public # Needing % Needing RemedialCollege Remediation RemediationCredits% EarningRemedialCreditsHigh School Diploma TypeHonors23952%******Core 40***************General***************Graduated with Waiver351029%550%Graduated without Waiver405123%1192%Took and Passed an AP Test14832%******Took but Did Not Pass an AP Test7111%******Did Not Take an AP Test221188%1267%Earned Dual Credit from an Indiana Public College34672%******Did Not Earn Dual Credit from an Indiana Public College941516%******21st Century Scholar4824%******Non 21st Century Scholar392205%******Free or Reduced Lunch5635%******Non Free or Reduced 440225%1673%High School Graduation Waiver StatusAdvanced Placement StatusDual Credit Status21st Century Scholar StatusSocioeconomic StatusRace/EthnicityAll StudentsReport updated on 5/14/2019Page 5 of 8
2017 High School GraduatesPenn High SchoolStudent PerformanceIndiana Public College Student Performance# Enrolled in INPublic CollegeAverage FreshmanYear GPAAverage FreshmanCredit Hours EarnedHonors2393.228.51Core 40*********General*********Graduated with Waiver351.26.64Graduated without Waiver4052.824.38Took and Passed an AP Test1483.329.16Took but Did Not Pass an AP Test712.725.46Did Not Take an AP Test2212.218.02Earned Dual Credit from an Indiana Public College3462.925.78Did Not Earn Dual Credit from an Indiana Public College941.612.6021st Century Scholar482.524.42Non 21st Century Scholar3922.722.79Free or Reduced Lunch562.320.63Non Free or Reduced 25.71BreakdownHigh School Diploma TypeHigh School Graduation Waiver StatusAdvanced Placement StatusDual Credit Status21st Century Scholar StatusSocioeconomic StatusRace/EthnicityEnrollment StatusFull-Time StudentsPart-Time StudentsAll StudentsReport updated on 5/14/2019661.57.414402.622.97Page 6 of 8
2017 High School GraduatesPenn High SchoolReport updated on 5/14/2019Page 7 of 8
2017 High School GraduatesPenn High SchoolData Sources: Indiana Commission for Higher Education (CHE); Indiana Department of Education (IDOE), National StudentClearinghouse (NSC)NOTES:High School Graduates ;͞Students͟Ϳ͗ Count of Indiana high school graduates and associated disaggregations are based onthe total count of graduates reported on the IDOE-GR report for 2017. Graduate counts are not IDOE cohort graduatecounts and thus may not match cohort graduate counts and associated disaggregations reported in other places, such asDOE Compass. SOURCE: IDOECollege Enrollment: Represents students reported as enrolled in postsecondary education, regardless of institution type,within the year following high school graduation (e.g., for 2017 high school graduates, postsecondary enrollment is countedfor 2017-18 school year). A student was considered enrolled only if: a) s/he was enrolled as a degree or certificate-seekingundergraduate student and b) s/he was enrolled for the equivalent of at least one semester during the school year.SOURCES: NSC, CHEIndiana Public College Enrollment: Represents students reported as enrolled in an Indiana public postsecondary institution.SOURCE: CHE21st Century Scholar Status: Represents students who were eligible for affirmation and affirmed. Students who wereenrolled in K-12 as Scholars but did not affirm, or students who affirmed but were not eligible, are not considered 21stCentury Scholars for this report. SOURCE: CHEAP Participation/Passing Exam Status: Represents students who sat for and/or passed (received score of 3 or higher) atleast one Advanced Placement exam. SOURCE: IDOEDual Credit Status: Represents students who earned/did not earn credit hours awarded by Indiana public colleges that wererecognized by both the high school and the postsecondary institution. Dual credit calculations only include credits awardedby Indiana publics. SOURCE: CHEFull-time/Part-time Enrollment Status: Full-time enrollment defined as enrolled in 12 or more credits in the semester ofentry at an Indiana public college. Part-time enrollment defined as enrolled in fewer than 12 credits in the semester of entryat an Indiana public college. SOURCE: CHERemediation Enrollment: Represents Indiana public college students identified as deficient in the general competenciesnecessary for regular postsecondary curriculum in English/language arts and/or mathematics. Students enrolled in bothcredit and non-credit remedial coursework are included in remediation totals. SOURCE: CHERemediation Success: Represents Indiana public college students who successfully complete the subject(s) in which theywere identified as needing remediation. Students who were identified as needing remediation in both English/language artsand math needed to successfully complete both English/language arts and math in order to be counted as earning remedialcredit. SOURCE: CHEFreshman GPA: Represents cumulative grade point average for the latest term of enrollment at an Indiana public college inthe year following high school graduation. SOURCE: CHEFreshman Credit Hours Earned: Represents average number of institutional credits earned during the year following highschool graduation at an Indiana public college. SOURCE: CHE***Not Applicable/Suppressed Data: Data may be missing either because no data were available or fewer than 10 studentswere in a group and the data had to be suppressed for privacy reasons. In some cases, at least two groups of student datahad to be suppressed because of complementary suppression rulesReport updated on 5/14/2019Page 8 of 8
Penn High School. High School Graduate Enrollment by College Type College Type # of HS Graduates % of Total HS Graduates Indiana Public College 440 40.2% . High School Graduation Waiver Status Graduated with Waiver 35 10 29% 5 50% Graduated without Waiver 405 12 3% 11 92%