Transcription
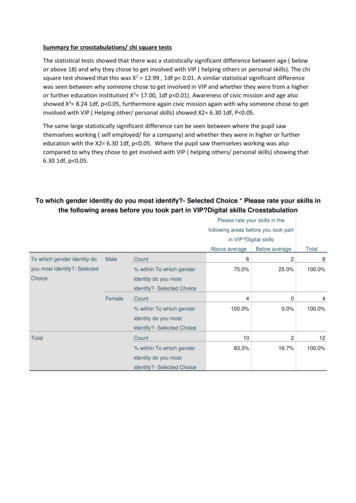
Summary for crosstabulations/ chi square testsThe statistical tests showed that there was a statistically significant difference between age ( belowor above 18) and why they chose to get involved with VIP ( helping others or personal skills). The chisquare test showed that this was X2 12.99 , 1df p 0.01. A similar statistical significant differencewas seen between why someone chose to get involved in VIP and whether they were from a higheror further education institution( X2 17.00, 1df p 0.01). Awareness of civic mission and age alsoshowed X2 8.24 1df, p 0.05, furthermore again civic mission again with why someone chose to getinvolved with VIP ( Helping other/ personal skills) showed X2 6.30 1df, P 0.05.The same large statistically significant difference can be seen between where the pupil sawthemselves working ( self employed/ for a company) and whether they were in higher or furthereducation with the X2 6.30 1df, p 0.05. Where the pupil saw themselves working was alsocompared to why they chose to get involved with VIP ( helping others/ personal skills) showing that6.30 1df, p 0.05.To which gender identity do you most identify?- Selected Choice * Please rate your skills inthe following areas before you took part in VIP?Digital skills CrosstabulationPlease rate your skills in thefollowing areas before you took partin VIP?Digital skillsAbove averageTo which gender identity doMaleCountyou most identify?- Selected% within To which genderChoiceidentity do you mostBelow 1021283.3%16.7%100.0%identify?- Selected ChoiceFemaleCount% within To which genderidentity do you mostidentify?- Selected ChoiceTotalCount% within To which genderidentity do you mostidentify?- Selected Choice
Chi-Square TestsAsymptoticValuePearson Chi-SquaredfSignificance (2-Exact Sig. (2-Exact Sig. 8Continuity CorrectionbLikelihood RatioFisher's Exact TestLinear-by-Linear Association1.100cN of Valid Cases1.294Point . 3 cells (75.0%) have expected count less than 5. The minimum expected count is .67.b. Computed only for a 2x2 tablec. The standardized statistic is -1.049.Age? * Please rate your skills in the following areas before you tookpart in VIP?Digital skills CrosstabulationPlease rate your skills in thefollowing areas before you tookpart in VIP?Digital skillsAbove averageAge?below 18Count% within Age?above 18Count% within Age?TotalCount% within Age?Below 1021283.3%16.7%100.0%Chi-Square TestsAsymptoticValuePearson Chi-SquareContinuity CorrectiondfSignificance (2-Exact Sig. (2-Exact Sig. 5bLikelihood RatioFisher's Exact TestLinear-by-Linear Association2.200cN of Valid Cases1.13812a. 2 cells (50.0%) have expected count less than 5. The minimum expected count is 1.00.b. Computed only for a 2x2 tablec. The standardized statistic is 1.483.Point Probability.455.227.455.227.455.227.455.227.227
To which gender identity do you most identify?- Selected Choice * Please rate your skills inthe following areas before you took part in VIP? Self reflection CrosstabulationPlease rate your skills in thefollowing areas before you took partin VIP? Self reflectionAbove averageTo which gender identity doMaleCountyou most identify?- Selected% within To which genderChoiceidentity do you mostBelow 1311492.9%7.1%100.0%identify?- Selected ChoiceFemaleCount% within To which genderidentity do you mostidentify?- Selected ChoiceTotalCount% within To which genderidentity do you mostidentify?- Selected ChoiceChi-Square TestsAsymptoticValuePearson Chi-SquareContinuityCorrectionbLikelihood RatiodfSignificance (2-Exact Sig. (2-Exact Sig. Fisher's Exact TestLinear-by-Linear AssociationN of Valid Cases.556c1.45614a. 3 cells (75.0%) have expected count less than 5. The minimum expected count is .36.b. Computed only for a 2x2 tablec. The standardized statistic is -.745.Point 3
To which gender identity do you most identify?- Selected Choice * Please rate your skills inthe following areas after you took part in VIP? Self reflection CrosstabulationPlease rate your skills in thefollowing areas after you took partin VIP? Self reflectionAbove averageTo which gender identity doMaleCountyou most identify?- Selected% within To which genderChoiceidentity do you mostBelow 0%1511693.8%6.3%100.0%identify?- Selected ChoiceFemaleCount% within To which genderidentity do you mostidentify?- Selected ChoiceTotalCount% within To which genderidentity do you mostidentify?- Selected ChoiceChi-Square TestsAsymptoticValuePearson Chi-SquaredfSignificance (2-Exact Sig. (2-Exact Sig. 0Continuity CorrectionbLikelihood RatioFisher's Exact TestLinear-by-Linear Association1.667cN of Valid Cases1.19716a. 2 cells (50.0%) have expected count less than 5. The minimum expected count is .38.b. Computed only for a 2x2 tablec. The standardized statistic is 1.291.Point Probability.375.375.375.375.375.375.375.375.375
Age? * Please rate your skills in the following areas before you tookpart in VIP? Self reflection CrosstabulationPlease rate your skills in thefollowing areas before you tookpart in VIP? Self reflectionAbove averageAge?below 18Count% within Age?above 18Count% within Age?TotalCount% within Age?Below 1311492.9%7.1%100.0%Chi-Square TestsAsymptoticValuePearson Chi-SquareContinuity CorrectionbLikelihood RatiodfSignificance (2-Exact Sig. (2-Exact Sig. 8Fisher's Exact TestLinear-by-Linear AssociationN of Valid Cases.750c1.38614a. 2 cells (50.0%) have expected count less than 5. The minimum expected count is .43.b. Computed only for a 2x2 tablec. The standardized statistic is .866.Point 1
Age? * Please rate your skills in the following areas after you tookpart in VIP? Self reflection CrosstabulationPlease rate your skills in thefollowing areas after you took partin VIP? Self reflectionAbove averageAge?below 18Count% within Age?above 693.8%6.3%100.0%Count% within Age?TotalBelow averageCount% within Age?Chi-Square TestsAsymptoticValuedfSignificance (2-Exact Sig. (2-Exact Sig. (1-sided)sided)sided).640a1.424Continuity Correctionb.00011.000Likelihood Ratio.9801.322Pearson Chi-SquareFisher's Exact TestLinear-by-Linear AssociationN of Valid Cases.600c1.43916a. 2 cells (50.0%) have expected count less than 5. The minimum expected count is .38.b. Computed only for a 2x2 tablec. The standardized statistic is .775.Point 5
Age? * Please rate the importance of each of the reasons for yourinvolvement in the valleys innovation project? Gain workexperience CrosstabulationPlease rate the importance of eachof the reasons for your involvementin the valleys innovation project?Gain work experiencevery importantAge?below 18Count% within Age?above 18Count% within Age?TotalCount% within Age?less .0%1431782.4%17.6%100.0%Chi-Square TestsAsymptoticValuePearson Chi-SquareContinuitydfSignificance (2-Exact Sig. (2-Exact Sig. 6CorrectionbLikelihood RatioFisher's Exact TestLinear-by-Linear Association1.870cN of Valid Cases1.17117a. 3 cells (75.0%) have expected count less than 5. The minimum expected count is 1.06.b. Computed only for a 2x2 tablec. The standardized statistic is 1.368.Point Probability.272.243.272.243.515.243.272.243.243
To which gender identity do you most identify?- Selected Choice * Please rate the importanceof each of the reasons for your involvement in the valleys innovation project? Gain workexperience CrosstabulationPlease rate the importance of eachof the reasons for your involvementin the valleys innovation project?Gain work experiencevery importantTo which gender identity doMaleCountyou most identify?- Selected% within To which genderChoiceidentity do you mostless .0%1431782.4%17.6%100.0%identify?- Selected ChoiceFemaleCount% within To which genderidentity do you mostidentify?- Selected ChoiceTotalCount% within To which genderidentity do you mostidentify?- Selected ChoiceChi-Square TestsAsymptoticValuedfSignificance (2-Exact Sig. (2-Exact Sig. (1-sided)sided)sided).006a1.938Continuity Correctionb.00011.000Likelihood Ratio.0061.937Pearson Chi-SquareFisher's Exact TestLinear-by-Linear AssociationN of Valid 817a. 3 cells (75.0%) have expected count less than 5. The minimum expected count is 1.06.b. Computed only for a 2x2 tablec. The standardized statistic is -.076.Point Probability.485
To which gender identity do you most identify?- Selected Choice * Please rate the importanceof each of the reasons for your involvement in the valleys innovation project? Buildconfidence CrosstabulationPlease rate the importance of eachof the reasons for your involvementin the valleys innovation project?Build confidencevery importantTo which gender identity doMaleCountyou most identify?- Selected% within To which genderChoiceidentity do you mostless .0%1521788.2%11.8%100.0%identify?- Selected ChoiceFemaleCount% within To which genderidentity do you mostidentify?- Selected ChoiceTotalCount% within To which genderidentity do you mostidentify?- Selected ChoiceChi-Square TestsAsymptoticValuePearson Chi-SquareContinuityCorrectionbLikelihood RatiodfSignificance (2-Exact Sig. (2-Exact Sig. Fisher's Exact TestLinear-by-Linear AssociationN of Valid Cases.202c1.65317a. 2 cells (50.0%) have expected count less than 5. The minimum expected count is .71.b. Computed only for a 2x2 tablec. The standardized statistic is .449.Point Probabili1.000.5961.000.5961.000.5961.000.596.4
Age? * Please rate the importance of each of the reasons for yourinvolvement in the valleys innovation project? Build confidenceCrosstabulationPlease rate the importance of eachof the reasons for your involvementin the valleys innovation project?Build confidencevery importantAge?below 18Count% within Age?above 18Count% within Age?TotalCount% within Age?less .0%1521788.2%11.8%100.0%Chi-Square TestsAsymptoticValuePearson Chi-SquareContinuitydfSignificance (2-Exact Sig. (2-Exact Sig. 0CorrectionbLikelihood RatioFisher's Exact TestLinear-by-Linear Association1.164cN of Valid Cases1.28117a. 2 cells (50.0%) have expected count less than 5. The minimum expected count is .71.b. Computed only for a 2x2 tablec. The standardized statistic is 1.079.Point Probability.515.404.515.404.515.404.515.404.404
Age? * Why did you choose to get involved in VIP? CrosstabulationWhy did you choose to getinvolved in VIP?Helping othersAge?below 18Count% within Age?above 18Count% within Age?TotalCount% within Age?Personal %5121729.4%70.6%100.0%Chi-Square TestsAsymptoticValuePearson Chi-SquareContinuity CorrectionbLikelihood RatiodfSignificance (2-Exact Sig. (2-Exact Sig. .000Fisher's Exact TestLinear-by-Linear AssociationN of Valid Cases12.222c1.00017a. 3 cells (75.0%) have expected count less than 5. The minimum expected count is 1.76.b. Computed only for a 2x2 tablePoint Probability.001.001.001.001.001.001.001.001.001
c. The standardized statistic is 3.496.To which gender identity do you most identify?- Selected Choice * Why did you choose to getinvolved in VIP? CrosstabulationWhy did you choose to get involvedin VIP?Helping othersTo which gender identity doMaleCountyou most identify?- Selected% within To which genderChoiceidentity do you mostPersonal 5121729.4%70.6%100.0%identify?- Selected ChoiceFemaleCount% within To which genderidentity do you mostidentify?- Selected ChoiceTotalCount% within To which genderidentity do you mostidentify?- Selected ChoiceChi-Square TestsAsymptoticValuePearson Chi-SquareExact Sig. (2-Exact Sig. 4Continuity CorrectionbLikelihood RatiodfSignificance (2-Fisher's Exact TestLinear-by-Linear Association1.782cN of Valid Cases1.18217a. 3 cells (75.0%) have expected count less than 5. The minimum expected count is 1.76.b. Computed only for a 2x2 tablec. The standardized statistic is -1.335.Point Probability.280.205.280.205.280.205.280.205.178
Which organisation did you represent as part of VIP? * Why did you choose to get involved in VIP?CrosstabulationWhy did you choose to get involvedin VIP?Helping othersWhich organisation did youHigher educationCountrepresent as part of VIP?% within Which organisationPersonal %5121729.4%70.6%100.0%did you represent as part ofVIP?Further educationCount% within Which organisationdid you represent as part ofVIP?TotalCount% within Which organisationdid you represent as part ofVIP?Chi-Square TestsAsymptoticValuedfSignificance (2-Exact Sig. (2-Exact Sig. (1-sided)sided)sided)17.000a1.000Continuity Correctionb12.5251.000Likelihood Ratio20.5971.000Pearson Chi-SquareFisher's Exact TestLinear-by-Linear Association16.000cN of Valid Cases1.00017a. 3 cells (75.0%) have expected count less than 5. The minimum expected count is 1.47.b. Computed only for a 2x2 tablec. The standardized statistic is 4.000.Point Probability.000.000.000.000.000.000.000.000.000
Which organisation did you represent as part of VIP? * How aware are you of the civic mission of yourinstitution? CrosstabulationHow aware are you of the civic missionof your institution?AwareWhich organisation did youHigher educationCountrepresent as part of VIP?% within Which organisation didNot 0you represent as part of VIP?Further educationCount% within Which organisation did100.0you represent as part of VIP?TotalCount% within Which organisation didyou represent as part of VIP?Chi-Square TestsAsymptoticValuedfSignificance (2-Exact Sig. (2-Exact Sig. (1-sided)sided)sided)6.296a1.012Continuity Correctionb3.9051.048Likelihood Ratio8.2321.004Pearson Chi-SquareFisher's Exact TestLinear-by-Linear Association5.926cN of Valid Cases1.01517a. 2 cells (50.0%) have expected count less than 5. The minimum expected count is 2.35.b. Computed only for a 2x2 tablec. The standardized statistic is 2.434.Point .0
To which gender identity do you most identify?- Selected Choice * How aware are you of thecivic mission of your institution? CrosstabulationHow aware are you of the civicmission of your institution?AwareTo which gender identity doMaleCountyou most identify?- Selected% within To which genderChoiceidentity do you mostNot 81752.9%47.1%100.0%identify?- Selected ChoiceFemaleCount% within To which genderidentity do you mostidentify?- Selected ChoiceTotalCount% within To which genderidentity do you mostidentify?- Selected ChoiceChi-Square TestsAsymptoticValuedfSignificance (2-Exact Sig. (2-Exact Sig. (1-sided)sided)sided).701a1.402Continuity Correctionb.1081.742Likelihood Ratio.7121.399Pearson Chi-SquareFisher's Exact TestLinear-by-Linear AssociationN of Valid Cases.660c1.41717a. 2 cells (50.0%) have expected count less than 5. The minimum expected count is 2.82.b. Computed only for a 2x2 tablec. The standardized statistic is -.812.Point Probability.620.373.620.373.620.373.620.373.285
Age? * How aware are you of the civic mission of your institution?CrosstabulationHow aware are you of the civicmission of your institution?AwareAge?below 18Count% within Age?above 18Count% within Age?TotalCount% within Age?Not 81752.9%47.1%100.0%Chi-Square TestsAsymptoticValuePearson Chi-SquareExact Sig. (2-Exact Sig. 001Continuity CorrectionbLikelihood RatiodfSignificance (2-Fisher's Exact TestLinear-by-Linear Association7.758cN of Valid Cases1.00517a. 2 cells (50.0%) have expected count less than 5. The minimum expected count is 2.82.b. Computed only for a 2x2 tablec. The standardized statistic is 2.785.Point Probability.009.007.009.007.009.007.009.007.007
Why did you choose to get involved in VIP? * How aware are you of the civic mission of yourinstitution? CrosstabulationHow aware are you of the civicmission of your institution?AwareWhy did you choose to getHelping othersinvolved in VIP?Count% within Why did you chooseNot 81752.9%47.1%100.0%to get involved in VIP?Personal skillsCount% within Why did you chooseto get involved in VIP?TotalCount% within Why did you chooseto get involved in VIP?Chi-Square TestsAsymptoticValuedfSignificance (2-Exact Sig. (2-Exact Sig. (1-sided)sided)sided)6.296a1.012Continuity Correctionb3.9051.048Likelihood Ratio8.2321.004Pearson Chi-SquareFisher's Exact TestLinear-by-Linear Association5.926cN of Valid Cases1.01517a. 2 cells (50.0%) have expected count less than 5. The minimum expected count is 2.35.b. Computed only for a 2x2 tablec. The standardized statistic is 2.434.Point Probability.029.020.029.020.029.020.029.020.020
Which organisation did you represent as part of VIP? * On completing your studies, where do you seeyourself working? CrosstabulationOn completing your studies, wheredo you see yourself working?self employedWhich organisation did youHigher educationCountrepresent as part of VIP?% within Which organisationFor a %981752.9%47.1%100.0%did you represent as part ofVIP?Further educationCount% within Which organisationdid you represent as part ofVIP?TotalCount% within Which organisationdid you represent as part ofVIP?Chi-Square TestsAsymptoticValuePearson Chi-SquareContinuityCorrectionbLikelihood RatiodfSignificance (2-Exact Sig. (2-Exact Sig. 04Fisher's Exact TestLinear-by-Linear AssociationN of Valid Cases5.926c1.01517a. 2 cells (50.0%) have expected count less than 5. The minimum expected count is 2.35.b. Computed only for a 2x2 tablePoint Probability.029.020.029.020.029.020.029.020.020
Why did you choose to get involved in VIP? * On completing your studies, where do you see yourselfworking? CrosstabulationOn completing your studies, wheredo you see yourself working?self employedWhy did you choose to getHelping othersCountinvolved in VIP?% within Why did you chooseFor a %981752.9%47.1%100.0%to get involved in VIP?Personal skillsCount% within Why did you chooseto get involved in VIP?TotalCount% within Why did you chooseto get involved in VIP?c. The standardized statistic is 2.434.Chi-Square TestsAsymptoticValuePearson Chi-SquareContinuitydfSignificance (2-Exact Sig. (2-Exact Sig. 04CorrectionbLikelihood RatioFisher's Exact TestLinear-by-Linear Association5.926cN of Valid Cases1.01517a. 2 cells (50.0%) have expected count less than 5. The minimum expected count is 2.35.b. Computed only for a 2x2 tablec. The standardized statistic is 2.434.Point Probability.029.020.029.020.029.020.029.020.020
Please rate the importance of each of the reasons for your involvement in the valleys innovationproject? Gain work experience * On completing your studies, where do you see yourself working?CrosstabulationOn completing your studies, wheredo you see yourself working?self employedPlease rate the importance of very importantCounteach of the reasons for your% within Please rate theinvolvement in the valleysimportance of each of theinnovation project? Gain workreasons for your involvementexperiencein the valleys innovationFor a %981752.9%47.1%100.0%project? Gain workexperienceless importantCount% within Please rate theimportance of each of thereasons for your involvementin the valleys innovationproject? Gain workexperienceTotalCount% within Please rate theimportance of each of thereasons for your involvementin the valleys innovationproject? Gain workexperienceChi-Square TestsAsymptoticValuePearson Chi-SquareContinuityCorrectionbLikelihood RatiodfSignificance (2-Exact Sig. (2-Exact Sig. 22Fisher's Exact TestLinear-by-Linear AssociationN of Valid Cases3.857c1.05017a. 2 cells (50.0%) have expected count less than 5. The minimum expected count is 1.41.Point Probability.082.082.082.082.082.082.082.082.082
b. Computed only for a 2x2 tablec. The standardized statistic is 1.964.Parametric and non-parametric testingSome of the findings from the parametric and non parametric tests were that there was a statistically significantpositive correlation between ratings of the skills creating and seizing opportunities after taking part in VIP andcommunication skills at 0.9, meaning a strong positive correlation. Another was that this was also seen before VIP witha positive correlation of 0.8.1)Tests of NormalityKolmogorov-SmirnovaStatisticPlease rate your skills in 15.066following areas before youtook part in VIP?Communication skillsa. Lilliefors Significance CorrectionThe sig. value is above 0.05 so therefore can be said to be normally distributed, furthermore the normal Q-Qplot shows that the data appears normally distributed as it follows the diagonal line closely and does notappear to have a non-linear pattern.
Tests of Normality
Kolmogorov-SmirnovaStatisticPlease rate your skills in ing areas before youtook part in VIP? Creatingand seizing opportunitiesa. Lilliefors Significance CorrectionFrom the normality tests it is clear that both are normally distributed.dfSig.14.261
There are two continuous variables, both are normally distributed and the relationship is linear therefore a pearsonstest can be used.CorrelationsPlease rate yourPlease rate your skills in thePearson Correlationfollowing areas after youSig. (2-tailed)took part in VIP? CreatingNskills in thePlease rate yourfollowing areasskills in theafter you tookfollowing areaspart in VIP?after you tookCreating andpart in .0001514.874**1and seizing opportunitiesPlease rate your skills in thePearson Correlationfollowing areas after youSig. (2-tailed)took part in VIP?NCommunication skills**. Correlation is significant at the 0.01 level (2-tailed).0001414
2)Tests of NormalityKolmogorov-SmirnovaStatisticPlease rate your knowledgeof local contact within thebusiness community? AfterVIPa. Lilliefors Significance 2dfSig.16.373
Tests of NormalityKolmogorov-SmirnovaStatisticHow did you rate the overallexperience of taking part inthe Valleys InnovationProjecta. Lilliefors Significance 9dfSig.17.007
There are 2 continuous variables, both normally distributed , the linear relationship is 0.03 and there areoutliers, so therefore spearmans rho should be used.CorrelationsSpearman's rhoPlease rate your knowledgeCorrelation Coefficientof local contact within theSig. (2-tailed)business community? AfterNPlease rate yourHow did youknowledge ofrate the overalllocal contactexperience ofwithin thetaking part in thebusinessValleyscommunity?InnovationAfter How did you rate the overallCorrelation Coefficientexperience of taking part inSig. (2-tailed)the Valleys InnovationNProject
3)Tests of NormalityKolmogorov-SmirnovaStatisticPlease rate your skills in thefollowing areas before youtook part in VIP?Communication skillsa. Lilliefors Significance 0dfSig.15.066
Tests of NormalityKolmogorov-SmirnovaStatisticPlease rate your skills in thefollowing areas before youtook part in VIP? Creatingand seizing opportunitiesa. Lilliefors Significance 5dfSig.14.261
CorrelationsPlease rate yourPlease rate your skills in thePearson Correlationfollowing areas before youSig. (2-tailed)took part in VIP? CreatingNskills in thePlease rate yourfollowing areasskills in thebefore you tookfollowing areaspart in VIP?before you tookCreating andpart in .0001414.830**1and seizing opportunitiesPlease rate your skills in thePearson Correlationfollowing areas before youSig. (2-tailed)took part in VIP?NCommunication skills**. Correlation is significant at the 0.01 level (2-tailed).0001415
4)Tests of NormalityKolmogorov-SmirnovaStatisticPlease rate your knowledgeof the local employmentmarket before VIP?a. Lilliefors Significance 3dfSig.17.036
Group StatisticsWhich organisation did yourepresent as part of VIP?NMeanStd. DeviationStd. Error MeanPlease rate your knowledgeHigher education53.00001.87083.83666of the local employmentFurther education122.83331.46680.42343market before VIP?
5)Tests of NormalityKolmogorov-SmirnovaStatisticPlease rate your knowledgeof the local employmentmarket after VIP?a. Lilliefors Significance 5dfSig.16.097
Group StatisticsWhich organisation did yourepresent as part of VIP?NMeanStd. DeviationStd. Error MeanPlease rate your knowledgeHigher education55.40001.14018.50990of the local employmentFurther education114.27271.79393.54089market after VIP?Both the above are for higher or further education and below is the discrete institutions
6)Tests of NormalityKolmogorov-SmirnovaStatisticPlease rate your knowledgeof the local employmentmarket before VIP?a. Lilliefors Significance 3dfSig.17.036
ANOVAPlease rate your knowledge of the local employment market before VIP?Sum of SquaresdfMean SquareBetween Groups10.16533.388Within Groups27.600132.123Total37.76516F1.596Sig.238
7)Tests of NormalityKolmogorov-SmirnovaStatisticPlease rate your g.90516of the local employmentmarket after VIP?a. Lilliefors Significance CorrectionANOVAPlease rate your knowledge of the local employment market after VIP?Sum of SquaresBetween GroupsdfMean Square7.75032.583Within Groups34.000122.833Total41.75015FSig.912.464.097
8Tests of NormalityKolmogorov-SmirnovaStatisticPlease rate your confidencestarting up your ownbusiness in the Valleysregion? - Before VIPa. Lilliefors Significance 1dfSig.17.023
Group Statisticsplease rate your reslience towork on tasks when there areobstacles? before VIPNMeanStd. DeviationStd. Error MeanPlease rate your confidenceGood resilience83.25001.48805.52610starting up your ownBad resilience93.11111.76383.58794business in the Valleysregion? - Before VIP
9)Tests of NormalityKolmogorov-SmirnovaStatisticPlease rate your confidence.139starting up your ownbusiness in the Valleysregion? - After VIP*. This is a lower bound of the true significance.a. Lilliefors Significance Sig.15.192
WarningsThe Independent Samples table is not produced.This was due to the fact that resilience was divided into 2 categories, good/bad and no oneresponded to bad resilience. Below is resilience as a continuous variable
10)Tests of NormalityKolmogorov-SmirnovaStatisticPlease rate your confidencestarting up your ownbusiness in the Valleysregion? - Before VIPa. Lilliefors Significance 1dfSig.17.023
Tests of kSig.StatisticdfSig.
Please rate your resilience towork on tasks when thereare obstacles? - Before VIPa. Lilliefors Significance Correction.19517.086.93317.244
The variables are normally distributed, however the scatter plot shows outliers and the relationship isn’t linear,therefore a spearhmans rho is usedCorrelationsPlease rate yourSpearman's rhoPlease rate your resilience to Correlation CoefficientPlease rate yourconfidenceresilience tostarting up yourwork on tasksown business inwhen there arethe Valleysobstacles? -region? - BeforeBefore VIPVIP1.000.373.1411717work on tasks when thereSig. (2-tailed)are obstacles? - Before VIPNPlease rate your confidenceCorrelation Coefficient.3731.000starting up your ownSig. (2-tailed).141.business in the ValleysN1717region? - Before VIP
Tests of NormalityKolmogorov-SmirnovaStatisticPlease rate your confidence.139starting up your ownbusiness in the Valleysregion? - After VIP*. This is a lower bound of the true significance.a. Lilliefors Significance Sig.15.192
Tests of kSig.StatisticdfSig.
Please rate your resilience to.19616.101.87216.029work on tasks when thereare obstacles? - After VIPa. Lilliefors Significance CorrectionThe variables are normally distributed however as there are outliers and the relationship isn’t linear then aspearmans rho test is used.
CorrelationsPlease rate yourSpearman's rhoPlease rate your resilience to Correlation CoefficientPlease rate yourconfidenceresilience
Summary for crosstabulations/ chi square tests The statistical tests showed that there was a statistically significant difference between age ( below or above 18) and why they chose to get involved with VIP ( helping others or personal skills). The chi square test showed that this was X2 12.99 , 1df p 0.01. A similar statistical significant .