Transcription
Fall 2020Enrollment Management Strategic PlanKey Performance Indicators:Current Trends and Progress on IndicatorsINDIANA UNIVERSITY–PURDUE UNIVERSITY INDIANAPOLIS
Purpose of Presentation1. Enrollment Management key performance indicators presented in aneffort to measure the quality of IUPUI’s performance and assist indeveloping performance goals and strategies:2. Provide data update on all components of IUPUI’s EnrollmentManagement Key Performance Indicators: Current Trends and Progresson Indicators3. Determine the conclusions which should be drawn from the data as abasis for subsequent action discussionsINDIANA UNIVERSITY–PURDUE UNIVERSITY INDIANAPOLIS
Key Performance Indicators and theStrategic Planning Process1.Reflect various components of the institution’s strategicgoals and are essentially what will be used to monitor theinstitution’s progress and determine its success.2.The appropriateness of each measure is commonlydetermined by a committee and may depend largely onwhat data are already available.3.Goals and strategies articulate how the institution willachieve its vision and measures of performance will providean indication of the progress the institution is makingtowards reaching those goals.4.KPIs measure the quality of an organization’s performanceand assist in developing performance goals and strategies.–Adapted from adapted from Hanover University Press, 2010, www.hanoverresearch.comKey Performance Indicators for Administrative Support UnitsINDIANA UNIVERSITY–PURDUE UNIVERSITY INDIANAPOLIS
Heads and Credit Metrics* Includes degree seeking and non-degree studentsOffice of Institutional Research and Decision Support
Heads and Credit Metrics* Includes degree seeking and non-degree studentsOffice of Institutional Research and Decision Support
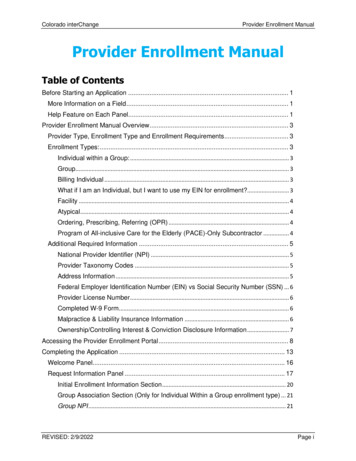
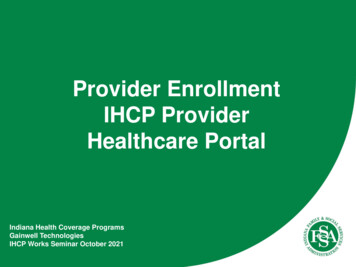
Heads and Credit MetricsIUPUI-IndianapolisCampus Total 2018201920202021202220232024202528,772 28,756 28,915 28,815 28,750 28,756 28,907 28,403 28,284 28,270 27,698 27,384 27,127Strategic Plan Goals28,907 29,114 29,321 29,528 29,735 29,942 30,150 30,672 31,194 31,716 32,238 32,760Undergraduate Enrollment 19970 20564 20664 20580 20631 20738 20798 20334 20273 20,156 19,442 19,098 18,796Strategic Plan GoalsGraduate/Prof Enrollment20,798 20,977 21,155 21,334 21,513 21,692 21,870 22,368 22,866 23,364 23,862 24,36081928251823581198018Strategic Plan Goals* Includes degree seeking and non-degree studentsOffice of Institutional Research and Decision 6819582238252828083048328835283768400
Heads and Credit MetricsIUPUI-IndianapolisCampus Total 24202528,772 28,756 28,915 28,815 28,750 28,756 28,907 28,403 28,284 28,270 27,698 27,384 27,127Strategic Plan Goals28,907 29,114 29,321 29,528 29,735 29,942 30,150 30,672 31,194 31,716 32,238 32,760* Includes degree seeking and non-degree studentsOffice of Institutional Research and Decision Support
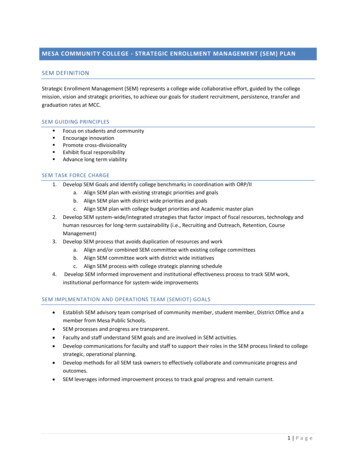
Heads and Credit MetricsIUPUI-IndianapolisUndergraduate 0,79820,00018,0002008 2009 2010 2011 2012 2013 2014 2015 2016 2017 2018 2019 2020 2021 2022 2023 2024 2025Actual19,970 20,564 20,664 20,580 20,631 20,738 20,798 20,334 20,273 20,156 19,442 19,098 18,796Strategic Plan Goals20,798 20,977 21,155 21,334 21,513 21,692 21,870 22,368 22,866 23,364 23,862 24,360* Includes degree seeking and non-degree studentsOffice of Institutional Research and Decision Support
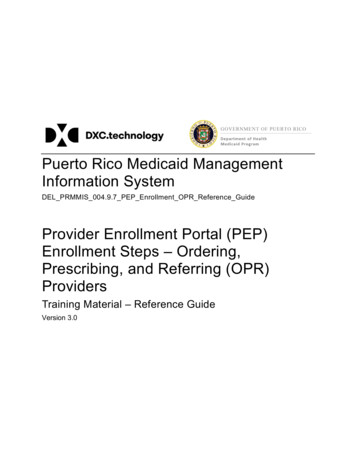
Heads and Credit MetricsIUPUI-IndianapolisGraduate/Professional ,1098,0007,800ActualStrategic Plan Goals2009 2010 2011 2012 2013 2014 2015 2016 2017 2018 2019 2020 2021 2022 2023 2024 20258,192 8,251 8,235 8,119 8,018 8,109 8,069 8,011 8,114 8,256 8,286 8,3318,109 8,138 8,166 8,195 8,223 8,252 8,280 8,304 8,328 8,352 8,376 8,400* Includes degree seeking and non-degree studentsOffice of Institutional Research and Decision Support
Heads and Credit MetricsIUPUI-IndianapolisGraduate unt2,500DoctoralPractice2,0001,5001,000500-Ma stersCertificateGrad ResearchGrad 172604786432,79020123,9602904396972,792Office of Institutional Research and Decision ,0511942628672,91220203,9862392538592,994
Heads and Credit MetricsCredit HoursIUPUI-IndianapolisCampus Credit 0Total Credit 5,22785,31585,40285,402Strategic Plan GoalsUndergraduateStrategic Plan GoalsGraduateStrategic Plan GoalsOffice of Institutional Research and Decision 40285,40285,40285,40285,402
Heads and Credit MetricsIUPUI-IndianapolisCampus Credit Hours400,000378,790375,000Credit 212022202320242025314,888 322,826 327,243 327,965 328,629 336,901 346,546 342,468 352,434 354,608 348,857 344,443 339,528Strategic Plan Goals346,546 348,803 351,061 353,318 355,575 357,833 360,090 363,830 367,570 371,310 375,050 378,790* Includes degree seeking and non-degree studentsOffice of Institutional Research and Decision Support
Heads and Credit MetricsIUPUI-IndianapolisUndergraduate Credit Hours305,000292,810285,000Credit Hours274,317265,000 16201720182019202020212022202320242025241,562 245,011 245,267 246,342 254,268 261,299 257,912 267,053 267,674 260,992 256,229 251,802Strategic Plan Goals* Includes degree seeking and non-degree studentsOffice of Institutional Research and Decision Support261,299 263,469 265,638 267,808 269,978 272,148 274,317 278,016 281,714 285,413 289,111 292,810
Heads and Credit MetricsIUPUI-IndianapolisGraduate/Professional Credit Hours900008750085,980Credit 8524784556Strategic Plan Goals* Includes degree seeking and non-degree studentsOffice of Institutional Research and Decision 381 86,934 87,865 88,214 87,72685,247 85,051 85,139 85,227 85,315 85,402 85,490 85,588 85,686 85,783 85,882 85,980
Total Enrollment MetricsBy Ethnic DiversityIUPUI-IndianapolisEthnic Diversity % Enrollment All .0%5.0%0.0%2008 2009 2010 2011 2012 2013 2014 2015 2016 2017 2018 2019 2020 2021 2022 2023 2024 2025Actual15.9% 16.3% 18.5% 19.9% 21.7% 22.6% 23.2% 23.9% 24.9% 25.8% 26.8% 28.6% 30.3%Strategic Plan Goals23.2% 23.4% 23.6% 23.8% 24.1% 24.3% 24.5% 24.9% 25.3% 25.7% 26.1% 26.5%Includes U.S. Students of Color categories: African American, American Indian, Asian, Hispanic/Latinx, Pacific Islander,Two or More Races. International students are excluded.Office of Institutional Research and Decision Support
Total Enrollment MetricsBy Ethnic DiversityIUPUI-IndianapolisMinority Share Enrollment All StudentsBy Specific Ethnic Groups12.0%10.0%8.0%6.0%4.0%2.0%0.0%African AmericanLanti(x)Two or %20199.6%8.4%4.4%20209.9%9.2%4.6%Note: In 2010 there was a change it the Ethnicity/Race Definition as applied by the federal governmentOffice of Institutional Research and Decision SupportINDIANA UNIVERSITY–PURDUE UNIVERSITY INDIANAPOLIS
Entering Student MetricsBeginner EnrollmentIUPUI-IndianapolisIncoming Undergraduate 0002,5002,0002008 2009 2010 2011 2012 2013 2014 2015 2016 2017 2018 2019 2020 2021 2022 2023 2024 2025Actual2,734 2,699 2,604 2,763 3,060 3,489 3,584 3,622 3,761 3,820 3,649 3,763 3,331Strategic Plan Goals3,584 3,670 3,756 3,842 3,928 4,014 4,100 4,140 4,180 4,220 4,260 4,300Office of Institutional Research and Decision Support
Entering Student MetricsBeginner EnrollmentIUPUI-IndianapolisIncoming Undergraduate Beginners21st Century and First Generation15001000500021st CenturyFirst Gen200932210932010362104420114311159Office of Institutional Research and Decision 74953
Entering Student MetricsBeginner EnrollmentIUPUI-IndianapolisIncoming Undergraduate BeginnersAverage HS GPA4.00Average HS GPA3.753.523.503.423.383.253.00ActualStrategic Plan Goals2008 2009 2010 2011 2012 2013 2014 2015 2016 2017 2018 2019 2020 2021 2022 2023 2024 20253.25 3.30 3.29 3.28 3.28 3.37 3.38 3.43 3.46 3.47 3.48 3.49 3.533.38 3.39 3.40 3.40 3.41 3.42 3.42 3.44 3.46 3.48 3.50 3.52Office of Institutional Research and Decision Support
Entering Student MetricsBeginner EnrollmentIUPUI-IndianapolisIncoming Undergraduate BeginnersAverage SAT120011501118Average SAT Scores110010501000950900BaselinePre-2017Conv 2017Strategic Plan 0902011103310131089Office of Institutional Research and Decision 6112010482020 2021 2022 2023 2024 20251033 1033 1033 1033 1033 1033104311181050 1054 1058 1062 1066 1070
Entering Student MetricsBeginner EnrollmentIUPUI-IndianapolisIncoming Undergraduate Beginners% with Honors Diplomas90.0%77.2%Percentage with Honors .0%10.0%0.0%2008 2009 2010 2011 2012 2013 2014 2015 2016 2017 2018 2019 2020 2021 2022 2023 2024 2025Actual45.2% 53.1% 49.3% 49.7% 55.3% 61.6% 59.4% 66.4% 64.1% 57.6% 64.7% 65.1% 67.3%Strategic Plan Goals59.4% 60.5% 61.7% 62.8% 63.9% 65.1% 66.2% 68.4% 70.6% 72.8% 75.0% 77.2%% on ALL incoming undergraduate Beginners not just Indiana. A similar pattern is seen regardless of Residency Status.Office of Institutional Research and Decision Support
Entering Student MetricsBeginner EnrollmentIUPUI-IndianapolisIncoming Undergraduate Beginners% Ethnic 5.0%10.0%5.0%0.0%2008 2009 2010 2011 2012 2013 2014 2015 2016 2017 2018 2019 2020 2021 2022 2023 2024 2025Actual17.3% 16.3% 22.4% 25.2% 27.3% 26.3% 23.4% 24.7% 28.3% 28.3% 30.3% 33.9% 35.3%Strategic Plan Goals23.7% 24.3% 24.8% 25.4% 25.9% 26.5% 27.0% 27.4% 27.8% 28.2% 28.6% 29.0%Includes U.S. students of color categories: African American, American Indian, Asian, Hispanic/Latino(a), Pacific Islander,Two or More Races. International students are excluded.Note: In 2010 there was a change it the Ethnicity/Race Definition as applied by the federal governmentOffice of Institutional Research and Decision Support
Entering Student MetricsBeginner EnrollmentIUPUI-IndianapolisIncoming Undergraduate Beginners% Ethnic Diversity by Specific 2009201020112012201320142015African American 9.4%8.7%10.9% 11.5% .1%7.7%Two or More0.0%0.0%3.9%4.3%5.6%4.4%4.0%5.5%Note: In 2010 there was a change it the Ethnicity/Race Definition as applied by the federal 11.1%5.8%20199.0%14.1%5.6%20209.7%14.0%5.9%Office of Institutional Research and Decision SupportINDIANA UNIVERSITY–PURDUE UNIVERSITY INDIANAPOLIS
Entering Student MetricsTransfer EnrollmentIUPUI-IndianapolisIncoming Undergraduate Transfers2,250Head Count1,7501,780Total Transfers1,6101,5661,2281,25010309102 Yr Transfers7502504 Yr 08909910Strategic Plan GoalsStrategic Plan Goals2 Yr Transfers ActualStrategic Plan Goals750700Total Transfers Actual 1,6114 Yr Transfers 461,78071072073074075093495898210061030Profiles the makeup of our Incoming Transfer Cohort - does not include Intercampus Transfers (ICT)Office of Institutional Research and Decision Support
Incoming Undergraduate Transfers% Ethnic DiversityIUPUI-IndianapolisIncoming Undergraduate Transfers% Ethnic 5.0%10.0%5.0%0.0%ActualStrategic Plan Goals2010 2011 2012 2013 2014 2015 2016 2017 2018 2019 2020 2021 2022 2023 2024 202524.7% 26.1% 27.0% 27.6% 26.8% 28.2% 29.1% 29.2% 31.6% 33.2% 34.3%26.8% 27.2% 27.6% 28.0% 28.4% 28.8% 29.2% 29.6% 30.0% 30.4% 30.8% 31.2%Profiles the makeup of our Incoming Transfer Cohort - does not include Intercampus Transfers (ICT)Office of Institutional Research and Decision SupportINDIANA UNIVERSITY–PURDUE UNIVERSITY INDIANAPOLIS
Incoming Undergraduate Transfers% Ethnic Diversity by Specific GroupsIUPUI-IndianapolisIncoming Undergraduate Transfers% Ethnic Diversity by Specific %African AmericanLanti(x)Two or .6%5.4%201915.6%8.4%4.1%202014.7%8.7%5.5%Profiles the makeup of our Incoming Transfer Cohort - does not include Intercampus Transfers (ICT)Office of Institutional Research and Decision SupportINDIANA UNIVERSITY–PURDUE UNIVERSITY INDIANAPOLIS
Entering Student MetricsGraduate EnrollmentIUPUI - IndianapolisIncoming Graduate/Professional 21,7171,5961,6001,1008166002008Total Graduate Actual 18819820Strategic Plan GoalsGraduate ActualStrategic Plan GoalsProfessional ActualStrategic Plan GoalsOffice of Institutional Research and Decision 621,7421,7671,7921,8171,842820820820820820
Entering Student MetricsNon-Resident Enrollment2000New Degree Seeking StudentsNew Domestic 80715600400200New International Non-ResidentNew MSEP Non-Resident0Total Entering 623646669692715145154235308387350391Strategic Plan GoalsNew International304363456432Strategic Plan GoalsNew Domestic529531559540Strategic Plan GoalsMSEPStrategic Plan GoalsOffice of Institutional Research and Decision 828863898933968728741754767780
Entering Student MetricsCredits Awarded Through PLAIUPUI - IndianapolisCredits by Prior Learning Assessment1200010000Credit Hours80006000400020000Cre dit By Exam(AP,IBH,IBS)IU Special CreditHS Dual Credit(In cludes IU 25785169384927989099985 Credit by Exam includes credits awarded via the following exams: Advance Placement (AP), International BaccalaureateHonors (IBH), International Baccalaureate Standard (IBS) IU Special Credit are course credits awarded by IU though a variety of means including: Test, Work, Life Experience, Other The sharp increase in IU Special Credits during AY 13-14 is due to 25 transfer students being awarded Life ExperienceNursing credits HS Dual Credit is College credit awarded by institutions of Higher Education – including Indiana University (ACP/DCP/SPAN)Office of Institutional Research and Decision Support
Total Enrollment MetricsVeteransIUPUI-IndianapolisVeteran 004002000ActualStrategic Plan 4202512101220123012401250* This data represents counts of students identified as Veterans in UIRR enrollment files (IR CEN TRM SNPSHT GT). This method differs from previousattempts to quantify Veteran students. Data is available beginning in 2014.Office of Institutional Research and Decision Support
Total Enrollment MetricsInternational StudentsInternational EnrollmentDegree and Non-degree3,5003,276 15.0%13.0%3,0002,56310.0% 11.0%2,5008.5%1,8942,0009.0%1,802Total International1,500% of Total Campus Enrollment3.0%INTL Undergrad500Total 0222023202420257106101,015 1,102 1,215 1,258 1,341 1,407 1,4741,017 1,011 1,121 1,148 1,166 1,060 1,069Grad/Professional Degree-Seeking% of Total Enrollment20151,894 1,980 2,070 2,183 2,297 2,324 2,563 2,699 2,839 2,981 3,127 3,276UGRD Degree-SeekingGrad/Professional Degree-Seeking20141,350 1,437 1,585 1,812 1,894 1,980 2,010 2,047 1,891 1,820 1,458Total INTLUGRD Degree-Seeking7.0%5.0%1,102INTL Grad/Prof1,0001,4741,3838481,011 1,121 1,160 1,200 1,263 1,248 1,383 1,484 1,561 1,640 1,720 1,8024.7%4.9%% of Total EnrollmentOffice of Institutional Research and Decision Support5.5%6.3%6.6%6.9%7.1%7.2%6.8%6.6% 5.40%6.6%6.9%7.2%7.5%7.8%8.2%8.5%8.8%9.1%9.4%9.7% 10.0%-1.0%
Student Performance MetricsAverage Undergraduate HoursIUPUI-IndianapolisAverage Undergraduate Credit Hours1615.01515.0141312.7121110All Undergraduates2004 2005 2006 2007 2008 2009 2010 2011 2012 2013 2014 2015 2016 2017 2018 2019 2020 2021 2022 2023 2024 202511.2 11.3 11.5 11.6 11.8Strategic Plan GoalsFirst Fall(New FYU & TRU)1212.1 12.1 12.2 12.5 12.7 12.9 13.4 13.5 13.6 13.4 13.412.7 13.1 13.5 13.9 14.3 14.6 15.0 15.0 15.0 15.0 15.0 15.011.9 12.3 12.4 12.7 12.8 13.1 12.9 12.9 12.8 13.5 13.9 14.1 14.4 14.4 14.5 14.5 14.3First Fall13.6 13.6 13.7 13.7 13.7 13.9 13.8 13.7 13.7 14.3 14.6 14.7 15.0 15.0 15.0 14.9 15.0(New FT FYU & TRU)Office of Institutional Research and Decision Support
Student Performance MetricsRetention/Graduation RatesOffice of Institutional Research and Decision Support
How do wecompare?
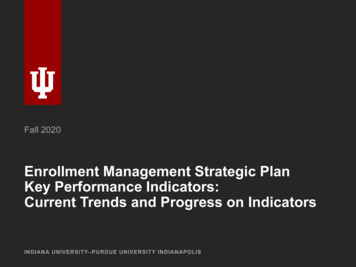
Official Peer Institutions:First-Time Full-Time BeginnersPeer InstitutionsOne-Year RetentionFour-Year GraduationSix-Year GraduationUniv. of South Florida91%55%73%Temple University89%49%73%Univ. of Utah89%32%70%University at Buffalo - SUNY87%60%76%Univ. of Cincinnati86%34%67%Virginia Commonwealth85%44%67%Univ. of Alabama-Birmingham82%35%58%Univ. of Illinois-Chicago80%34%59%Univ. of Louisville80%32%57%Wayne State University79%18%47%Univ. of New MexicoIUPUI74%72%22%24%49%48%Univ. of Colorado-Denver72%22%48%Note: Retention cohort 2017, Four-Year Graduation and Six-Year Graduation Rates 2012. Includes Columbus. Source: IPEDSINDIANA UNIVERSITY–PURDUE UNIVERSITY INDIANAPOLIS
Fall 2017 Comparisons: Large, Urban PublicInstitutionHeadcount Selectivity UrbanizationAvg. SAT/ACTOne-YearRetention*Temple U51411City Large122389%U at Buffalo, SUNY41701 Suburb Large122587%Virginia Commonwealth U41782City Midsize116585%U of Alabama-Birmingham22071City Midsize121682%U of Illinois-Chicago40142City Large116080%U of Louisville26401City Large121080%Wayne State U*23982City Large116879%U of New Mexico31703City Large111674%IUPUI38803City Large109872%U of Colorado Denver14082City Large116072%Note: The Consortium for Student Retention Data Exchange (CSRDE). IUPUI Indianapolis Only. First-time beginners including fulltime and part-time students. Fall 2017 data. *Wayne State did not participate in CSRDE last year. *One-Year Retention Based on IPEDS.INDIANA UNIVERSITY–PURDUE UNIVERSITY INDIANAPOLIS
Fall 2017 ComparisonsInstitutionFederalPellGrants24yrsFirst Fall FallUnder Rep.CampusorGPASpringMinoritiesHousingolderBelow 2.0 Retn RateU at Buffalo, SUNY36%16%0%75%13%96%Temple U29%20%0%77%10%95%Virginia Commonwealth U32%30%0%82%16%94%U of Alabama-Birmingham*40%28%1%76%9%94%Wayne State U*44%18%0%38%16%93%U of Louisville33%17%0%75%16%92%U of Illinois-Chicago61%48%0%33%17%91%U of New Mexico38%59%1%25%12%87%U of Colorado Denver43%37%1%Not Available19%87%IUPUI42%17%1%39%21%86%Note: The Consortium for Student Retention Data Exchange (CSRDE). IUPUI Indianapolis Only. First-time beginners including fulltime and part-time students.* Fall 2016 data. Wayne State did not participate in CSRDE last year. U of Alabama-Birmingham did not report 2017 Fall-Springretention.INDIANA UNIVERSITY–PURDUE UNIVERSITY INDIANAPOLIS
Institutional Aid and ScholarshipsPeer InstitutionNumber ofFull-TimeBeginnersNumber ofFull-TimeBeginnersReceiving% Beginners AverageOne-YearReceivingAmount Per RetentionBeginnerUniversity of Colorado Denver1,40971751% 2,95072%University of New Mexico3,1702,66484% 3,00974%University at Buffalo4,1702,73065% 3,34087%University of South Florida4,1032,59263% 4,39591%IUPUI3,9332,51464% 5,36372%University of Cincinnati5,3582,87554% 5,75786%Virginia Commonwealth4,1172,44959% 5,28685%University of Illinois Chicago4,0142,46261% 5,49080%University of Utah3,8532,68270% 5,84989%Wayne State University2,5672,17685% 6,56279%University of AlabamaBirminghamTemple University2,2281,71077% 7,87982%5,1414,12580% 7,28289%University of Louisville2,6401,82369% 8,47680%Note: Cohort 2017. First-Time, Full-Time Beginners Includes Columbus. Source: The Integrated Postsecondary Education Data System (IPEDS) .Percent beginners receiving Institutional Aid and Scholarships.INDIANA UNIVERSITY–PURDUE UNIVERSITY INDIANAPOLIS
ICHE Performance Funding1. Overall Degree Completion2. On-Time Degree Completion Rate3. At-Risk Degree Completion (PELL)4. High-Impact Degree Completion (STEM)5. Persistence Counts (30 Credit Hours, 60 Credit Hours, 90 Credit Hours)INDIANA UNIVERSITY–PURDUE UNIVERSITY INDIANAPOLIS41
Student Performance MetricsIndiana Resident Pell Recipients* The “at-risk” degree completions is defined as pell recipients in the year of degree conferral.Office of Institutional Research and Decision Support
Student Performance MetricsHigh Impact Degrees (STEM)* Indiana resident students in negotiated list of high impact majors/degrees (UIRR) for performance funding.At IUPUI this does not include degrees in School of Medicine or Dentistry.Office of Institutional Research and Decision Support
Student Performance MetricsDegrees Conferred*Does not include Associates or Undergradate CertificatesOffice of Institutional Research and Decision Support
Financial Aid MetricsUndergraduate Loan DebtThese figures include only graduates who entered IU as First-Year students and student loans from federal, IU, andprivate sources borrowed at IU during that program of study -- as defined by the Common Data Set (CDS).Office of Institutional Research and Decision Support
Financial Aid MetricsLoan Default Rate* The 2015 IUPUI Official rate is final. The Indianapolis and Columbus rates are still draft calculations.The official default rates are now calculated on a 3-year average basis, which only goes back to theFY2010 cohort. (Prior to the FY2010 cohort, default rates were calculated on a 2-year basis and are notcomparable with the current logic.)Office of Institutional Research and Decision Support
Financial Aid MetricsAverage Net Price by IncomeThe IPEDS net price estimates the average out-of-pocket costs for first-year, full-time undergraduates awarded gift aid(excluding private gift aid). Room and board and other non-tuition expense estimates decreased in 2013-14 by using a moremoderate cost estimate methodology. Since the average net price is the difference between estimated costs like room andboard and the average IPEDS gift aid, the average net changed significantly beginning in 2013-14.Office of Institutional Research and Decision Support
Definition of Unmet NeedThe National Common Data Set provides aframework for determining the percentage ofeach student’s academic year financial needthat is “met” by gift aid (scholarships,fellowships, grants and fee remissions),subsidized federal student loans (loans that donot capitalize interest while students are inschool), and federal work study earnings.Unmet need is the portion of a student’sacademic year financial need that exceedsthese forms of financial aid.Students may choose to borrow unsubsidizedfederal or private loans to cover this “unmet”portion of their financial need. This takesfinancial need and subtracts need based aiduntil it reaches zero.This includes Stafford/Perkins subsidized loans,but not unsubsidized. This does not includeparent loans or private loans. It does includemilitary benefits.
Annual Unmet Financial Need andOne-Year Retention FT, FT Beginners1,088 Fall 2018 beginners did not return to the IUPUI IN campus in Fall 2019INDIANA UNIVERSITY–PURDUE UNIVERSITY INDIANAPOLIS49
*5,321 with unmet financial need levels over 6,000INDIANA UNIVERSITY–PURDUE UNIVERSITY INDIANAPOLIS50
*892 beginners with unmet financial need over 6,000INDIANA UNIVERSITY–PURDUE UNIVERSITY INDIANAPOLIS51
Financial Aid MetricsUnmet Need of Undergraduate Degree SeekersUnmet need as defined in the Common Data Set (CDS) for degree-seeking undergraduates enrolled at fall censusis an average (mean) for the academic year (fall spring). The CDS limits its unmet need figures to students withboth need and aid.Office of Institutional Research and Decision Support
Financial Aid MetricsUnmet Need of Undergraduate Degree SeekersUnmet need as defined in the Common Data Set (CDS) for degree-seeking undergraduates enrolled at fall censusis an average (mean) for the academic year (fall spring). The CDS limits its unmet need figures to students withboth need and aid.Office of Institutional Research and Decision Support
Financial Aid MetricsAid Awarded to Undergraduate Degree SeekersOffice of Institutional Research and Decision Support
Financial Aid MetricsAid Awarded to Undergraduate Degree SeekersOffice of Institutional Research and Decision Support
Financial Aid MetricsAid Awarded to Undergraduate Degree SeekersOffice of Institutional Research and Decision Support
Strategic Plan Data Link ReportsMore Information available here(Including IUPUI Indianapolis andColumbus):IUPUI Data LinkInstitutional Research and DecisionSupportirds.iupui.eduContact us with questions orrequests for information!INDIANA UNIVERSITY–PURDUE UNIVERSITY INDIANAPOLIS
Graduate/Prof Enrollment 8192 8251 8235 8119 8018 8109 8069 8011 8,114 8,256 8,286 8,331 Strategic Plan Goals 8109 8138 8166 8195 8223 8252 8280 8304 8328 8352 8376 8400 30,150 32,760 21,870 24,360 8,280 8,400 0 5,000 10,000 15,000 20,000 25,000 30,000 35,000 t IUPUI-Indianapolis Campus Enrollment 20,79