Transcription
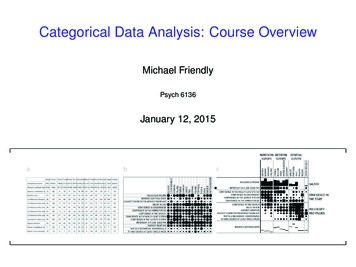
Categorical Data Analysis: Course OverviewMichael FriendlyPsych 6136January 12, 2015
Course organizationCourse goalsThis course is designed as a broad, applied introduction to the statisticalanalysis of categorical (or discrete) data, with an emphasis on:Emphasis: visualization methodsexploratory graphics: see patterns, trends, anomalies in your datamodel diagnostic methods: assess violations of assumptionsmodel summary methods: provide an interpretable summary of your dataEmphasis: theory practiceUnderstand how to translate research questions into statisticalhypotheses and modelsUnderstand the difference between simple, non-parametric approaches(e.g., χ2 test for indpendence) and model-based methods (logisticregression, GLM)Framework for thinking about categorical data analysis in visual terms2 / 29
Course organizationCourse outline1. Exploratory and hypothesis testing methodsWeek 1:Week 2:Week 3:Week 4:Week 5:Week 6:Overview; Introduction to ROne-way tables and goodness-of-fit testTwo-way tables: independence and associationTwo-way tables: ordinal data and dependent samplesThree-way tables: different types of independenceCorrespondence analysis2. Model-based methodsWeek 7: Logistic regression IWeek 8: Logistic regression IIWeek 9: Multinomial logistic regression modelsWeek 10: Log-linear modelsWeek 11: Loglinear models: Advanced topicsWeek 12: Generalized Linear Models: Poisson regressionWeek 13: Course summary & additional topics3 / 29
Course organizationTextbooksMain texts:Friendly, M. and Meyer, D. (2015). Visualizing Categorical Data with R. Tobe published by Chapman & Hall. Chapters will be made available on theweb (password 6/Agresti, Alan (2007). An Introduction to Categorical Data Analysis. 2nded. John Wiley & Sons, Inc.: New York. ISBN: 978-0-471-22618-5.Available in the bookstore.Supplementary readings:For those who desire a more in-depth treatment of categorical data analysis:Agresti, Alan (2013). Categorical Data Analysis. 3rd ed. New York: JohnWiley & Sons, Inc. New York. ISBN: 978-0-470-46363-54 / 29
What is categorical data?What is categorical data?A categorical variable is one for which the possible measured or assignedvalues consist of a discrete set of categories, which may be ordered orunordered.Some typical examples are:Gender, with categories “Male”, “Female”.Marital status, with categories “Never married”, “Married”,“Separated”, “Divorced”, “Widowed”.Party preference, with categories “NDP”, “Liberal”, “Conservative”,“Green”.Treatment outcome, with categories “no improvement”, “someimprovement”, or “marked improvement”.Age, with categories “0-9”, “10-19”, “20-29”, “30-39”, . . . .Number of children, with categories 0, 1, 2, . . . .5 / 29
What is categorical data?Categorical data structuresCategorical data structures: 1-way tablesSimplest case: 1-way frequency distributionUnordered factorQuestions:Are all hair colors equally likely?Do blondes have more fun?Is there a difference in voting intentions between Liberal and Conservative?6 / 29
What is categorical data?Categorical data structuresCategorical data structures: 1-way tables200Votes1500050100100Count200300250400Even here, simple graphs are better than tablesBlackBrownRedHair colorBlondBQConsGreenLiberalNDPPartyBut these don’t really provide answers to the questions. Why?7 / 29
What is categorical data?Categorical data structuresCategorical data structuresSimplest case: 1-way frequency distributionOrdered, quantitative factorQuestions:What is the form of this distribution?Is it useful to think of this as a binomial distribution?If so, is Pr(male) .5 reasonable?How could so many families have 12 children?8 / 29
What is categorical data?Categorical data structuresCategorical data structures: 1-way tablesWhen a particular distribution is in mind,better to plot the data together with the fitted frequenciesbetter still: a hanging rootogram– plot frequencies on sqrt scale, andhang the bars from the fitted values. 120030 1000 sqrt(Frequency)Frequency 800 600 10 400 20 200 0 0 01 2345678Number of male children91011 120123456789101112Number of male children9 / 29
What is categorical data?Categorical data structuresCategorical data structures: 2x2 tablesContingency tables (2 2 . . . )Two-wayThree-way, stratified by another factorQuestions:Is admission associated with gender?Does admission rate vary with department?10 / 29
What is categorical data?Categorical data structuresCategorical data structures: Larger tablesContingency tables (larger)Two-wayThree-way11 / 29
What is categorical data?Categorical data structuresTable and case-formThe previous examples were shown intable form# observations # cells in the tablevariables: factors COUNTEach has an equivalent representation incase form# observations total COUNTvariables: factorsCase form is required if there arecontinuous variables12 / 29
Analysis MethodsCategorical data: Analysis methodsMethods of analysis for categorical data fall into two main categories:Non-parametric, randomization-based methodsMake minimal assumptionsUseful for hypothesis-testing:Are men more likely to be admitted than women?Are hair color and eye color associated?Does the binomial distribution fit these data?Mostly for two-way tables (possibly stratified)R:Pearson Chi-square: chisq.test()Fisher’s exact test (for small expected frequencies): fisher.test()Mantel-Haenszel tests (ordered categories: test for linear association):CMHtest()SAS: PROC FREQ — can do all the aboveSPSS: Crosstabs13 / 29
Analysis MethodsCategorical data: Analysis methodsModel-based methodsMust assume random sample (possibly stratified)Useful for estimation purposes: Size of effects (std. errors, confidenceintervals)More suitable for multi-way tablesGreater flexibility; fitting specialized modelsSymmetry, quasi-symmetry, structured associations for square tablesModels for ordinal variablesR: glm() family, Packages: car, gnm, vcd, .estimate standard errors, covariances for model parametersconfidence intervals for parameters, predicted Pr{response}SAS: PROC LOGISTIC, CATMOD, GENMOD , INSIGHT (Fit YX), .SPSS: Hiloglinear, Loglinear, Generalized linear models14 / 29
Analysis MethodsCategorical data: Response vs. Association modelsResponse modelsSometimes, one variable is a natural discrete response.Q: How does the response relate to explanatory variables?Admit Gender DeptParty Age Education Urban Logit models, logististic regression, generalized linear modelsAssociation modelsSometimes, the main interest is just association among variablesQ: Which variables are associated, and how?Berkeley data: [Admit Gender]? [Admit Dept]? [Gender Dept]Hair-eye data: [Hair Eye]? [Hair Sex]? [Eye, Sex] Loglinear modelsThis is similar to the distinction between regression/ANOVA vs. correlationand factor analysis15 / 29
Analysis MethodsGraphical methodsGraphical methods: Tables and GraphsIf I can’t picture it, I can’t understand it.Albert EinsteinGetting information from a table is like extracting sunlight from acucumber.Farquhar & Farquhar, 1891Tables vs. GraphsTables are best suited for look-up and calculation—read off exact numbersshow additional calculations (e.g., % change)Graphs are better for:showing patterns, trends, anomalies,making comparisonsseeing the unexpected!Visual presentation as communication:what do you want to say or show? design graphs and tables to ’speak to the eyes’16 / 29
Analysis MethodsGraphical methodsGraphical methods: Communication goalsDifferent audiences require different graphs:Presentation: A single, carefully crafted graph to appeal to a wideaudienceExploration, analysis: Many related graphics from differentperspectives, for a narrow audience (often: you!)17 / 29
Analysis MethodsGraphical methodsGraphical methods: Presentation goalsDifferent presentation goals appeal to different design principlesBasic functions of data displayPrimary UseAnalysisPresentation GoalDesign ionDiagnosisModel buildingData DisplayPresentationComparisonto SimulateAestheticsto PersuadeRhetoricto InformExposition18 / 29
Analysis MethodsGraphical methodsGraphical methods: Quantitative dataQuantitative data (amounts) are naturally displayed in terms ofmagnitude position along a scaleScatterplot of Income vs.ExperienceBoxplot of Income by Gender19 / 29
Analysis MethodsGraphical methodsGraphical methods: Categorical dataFrequency data (counts) are more naturally displayed in terms ofcount area (Friendly, 1995)Model: (DeptGender)(Admit)1493CBAAdmit?: NoAdmit?: YesDE1198FSex: Male5571278Sex: FemaleFourfold display for 2 2 tableAdmittedRejectedMaleFemaleMosaic plot for 3-way table20 / 29
Analysis MethodsEffect orderingPrinciples of Graphical DisplaysEffect ordering (Friendly and Kwan, 2003)— In tables and graphs, sortunordered factors according to the effects you want to see/show.Auto data: PC2/1 orderWeitla igh gth77 78 G tioat nkom icern ispneP rase ruroep epTu DWLeRTHPrRRM Gthkat p78 p77 cegh rngt oomatio plaiun sePG nreerisTu TrRRPrRM LeHGDAuto data: Alpha orderLHTu WGTDRRRM Prro enisep ep se ruP G iceipl ratiom gtghe77 78 at nk rnoahtTuDRLe WTrHPRM RisroPG ep ep ricomunk ea ngt eigh spla rntio78 77 ethtGra“Corrgrams: Exploratory displays for correlation matrices” (Friendly, 2002)21 / 29
Analysis MethodsEffect orderingEffect ordering and high-lighting for tablesTable: Hair color - Eye color data: Effect orderedHair colorEye colorBrownHazelGreenBlueModel:Color coding:n in each 1694Independence: [Hair][Eye] χ2 (9) 138.29 -4 -2 -1n expected0 1 2 4n expected22 / 29
Analysis MethodsEffect orderingClustered heat map: Showing patterns in tablesThe clustered heat map is one method formaking large tables more visually understandable.Social statistics from UN surveyRows and columns are sorted,using cluster analysisStandardized data values areencoded using color23 / 29
Analysis MethodsEffect orderingBertifier: Turning tables into graphicsBertifier: A web app implementing Bertin’s idea of the reorderable matrix.See: http://www.aviz.fr/bertifier123A table: Attitudes and attributes by countryValues encoded by size and shapeSorted and grouped by themes and country regionsWatch: Youtube video of Bertifier24 / 29
Analysis MethodsEffect orderingVisual comparisonsComparisons— Make visual comparisons easy17512150101258Sqrt(frequency)FrequencyVisual grouping— connect with lines, make key comparisons contiguousBaselines— compare data to model against a line, preferably horizontalFrequencies often better plotted on a square-root scale10075506422500-201234Number of OccurrencesStandard histogram with fit560123456Number of OccurrencesSuspended rootogram25 / 29
Analysis MethodsEffect orderingSmall multiples— combine stratified graphs into coherent displays(Tufte, 1983)e.g., scatterplot matrix for quantitative data: all pairwise me61197.51Women026 / 29
Analysis MethodsEffect orderingRejectRejecte.g., mosaic matrix for quantitative data: all pairwise mosaic jectDeptAABBCC D E FD EFAdmitMaleFemaleFemaleMaleAdmitRejectMaleFemale27 / 29
Analysis MethodsEffect orderingGraphical methods: Categorical dataExploratory methodsMinimal assumptions (like non-parametric methods)Show the data, not just summariesBut can add summaries: smoothed curve(s), trend lines, .Help detect patterns, trends, anomalies, suggest hypothesesPlots for model-based methodsResidual plots - departures from model, omitted terms, .Effect plots - estimated probabilities of response or log oddsDiagnostic plots - influence, violation of assumptions28 / 29
Analysis MethodsEffect orderingReferences IFriendly, M. Conceptual and visual models for categorical data. The AmericanStatistician, 49:153–160, 1995.Friendly, M. Corrgrams: Exploratory displays for correlation matrices. TheAmerican Statistician, 56(4):316–324, 2002.Friendly, M. and Kwan, E. Effect ordering for data displays. ComputationalStatistics and Data Analysis, 43(4):509–539, 2003.Tufte, E. R. The Visual Display of Quantitative Information. Graphics Press,Cheshire, CT, 1983.29 / 29
Agresti, Alan (2007). An Introduction to Categorical Data Analysis. 2nd ed. John Wiley & Sons, Inc.: New York. ISBN: 978--471-22618-5. Available in the bookstore. Supplementary readings: For those who desire a more in-depth treatment of categorical data analysis: Agresti, Alan (2013). Categorical Data Analysis. 3rd ed. New York: John Wiley .