Transcription
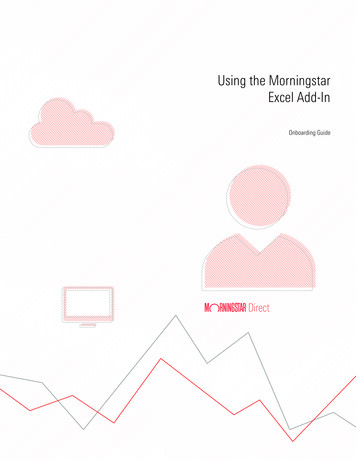
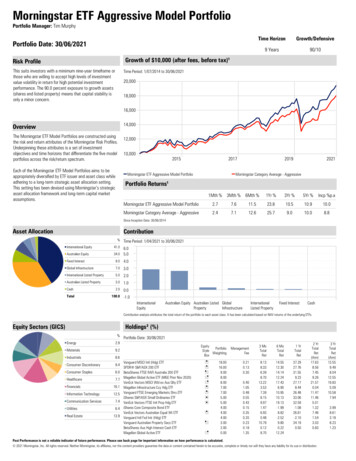
Morningstar ETF Aggressive Model PortfolioPortfolio Manager: Tim MurphyPortfolio Date: 30/06/2021Time HorizonGrowth/Defensive9 Years90/10Growth of 10,000 (after fees, before tax)¹Risk ProfileThis suits investors with a minimum nine-year timeframe orthose who are willing to accept high levels of investmentvalue volatility in return for high potential investmentperformance. The 90.0 percent exposure to growth assets(shares and listed property) means that capital stability isonly a minor concern.Time Period: 1/07/2014 to 30/06/202120,00018,00016,00014,000OverviewThe Morningstar ETF Model Portfolios are constructed usingthe risk and return attributes of the Morningstar Risk Profiles.Underpinning these attributes is a set of investmentobjectives and time horizons that differentiate the five modelportfolios across the risk/return spectrum.Each of the Morningstar ETF Model Portfolios aims to beappropriately diversified by ETF issuer and asset class whileadhering to a long-term strategic asset allocation setting.This setting has been devised using Morningstar’s strategicasset allocation framework and long-term capital marketassumptions.12,00010,00020152017Morningstar ETF Aggressive Model Portfolio20192021Morningstar Category Average - AggressivePortfolio Returns¹1Mth %3Mth %6Mth %1Yr %3Yr %5Yr %Incp %p.aMorningstar ETF Aggressive Model Portfolio2.77.611.523.810.510.910.0Morningstar Category Average - Aggressive2.47.112.625.79.010.08.8Since Inception Date: 30/06/2014Asset AllocationContribution%Time Period: 1/04/2021 to 30/06/2021International Equity41.0Australian Equity34.06.05.0Fixed Interest8.04.0Global Infrastructure7.03.0International Listed Property5.02.0Australian Listed lEquityAustralian Equity Australian Listed GlobalPropertyInfrastructureInternationalListed PropertyFixed InterestCashContribution analysis attributes the total return of the portfolio to each asset class. It has been calculated based on NAV returns of the underlying ETFs.Holdings² (%)Equity Sectors (GICS)%Energy2.9Materials9.2Industrials8.6Consumer Discretionary9.4Consumer Staples6.0Healthcare7.7Financials16.1Information Technology12.5Communication Services7.4Utilities6.4Real Estate13.9Portfolio Date: 30/06/2021EquityPortfolioStyleWeightingBoxVanguard MSCI Intl (Hdg) ETFSPDR S&P/ASX 200 ETFBetaShares FTSE RAFI Australia 200 ETFMagellan Global Active ETF (MGE Prior Nov 2020)VanEck Vectors MSCI Wld ex Aus Qlty ETFMagellan Infrastructure Ccy Hdg ETFVanguard FTSE Emerging Markets Shrs ETFiShares S&P/ASX Small Ordinaries ETFVanEck Vectors FTSE Intl Prop Hdg ETFiShares Core Composite Bond ETFVanEck Vectors Australian Equal Wt ETFVanguard Intl Fxd Intr (Hdg) ETFVanguard Australian Property Secs ETFBetaShares Aus High Interest Cash ETFMagellan Global Active 0.181.353 MoTotalRet6 MoTotalRet1 034.190.502 65.011.327.461.543.030.83Past Performance is not a reliable indicator of future performance. Please see back page for important information on how performance is calculated. 2021 Morningstar, Inc. All rights reserved. Neither Morningstar, its affiliates, nor the content providers guarantee the data or content contained herein to be accurate, complete or timely nor will they have any liability for its use or distribution.3 43.998.613.188.231.23
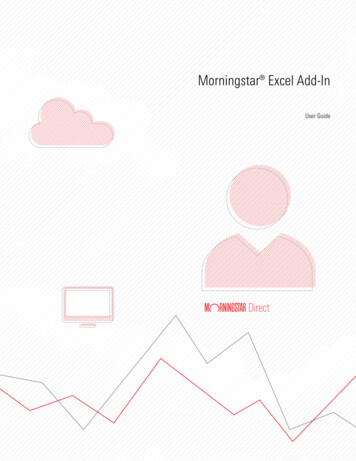
Morningstar ETF Growth Model PortfolioPortfolio Manager: Tim MurphyPortfolio Date: 30/06/2021Time HorizonGrowth/Defensive7 Years70/30Growth of 10,000 (after fees, before tax)¹Risk ProfileThis suits investors with a minimum seven-year timeframe orthose who are willing to accept higher levels of investmentvalue volatility in return for higher potential investmentperformance. Some capital stability is still desired, but theprimary concern is a higher return, hence the 70.0 percentexposure to growth assets (shares and listed property).Time Period: 1/07/2014 to ,000The Morningstar ETF Model Portfolios are constructed usingthe risk and return attributes of the Morningstar Risk Profiles.Underpinning these attributes is a set of investmentobjectives and time horizons that differentiate the five modelportfolios across the risk/return spectrum.12,000Each of the Morningstar ETF Model Portfolios aims to beappropriately diversified by ETF issuer and asset class whileadhering to a long-term strategic asset allocation setting.This setting has been devised using Morningstar’s strategicasset allocation framework and long-term capital marketassumptions.11,00010,00020152017Morningstar ETF Growth Model Portfolio20192021Morningstar Category Average - GrowthPortfolio Returns¹1Mth %3Mth %6Mth %1Yr %3Yr %5Yr %Incp %p.aMorningstar ETF Growth Model Portfolio2.26.18.818.79.29.38.7Morningstar Category Average - Growth1.95.89.420.17.78.17.1Since Inception Date: 30/06/2014Asset AllocationContribution%Time Period: 1/04/2021 to 30/06/2021International Equity32.05.0Australian Equity26.04.0Fixed Interest26.03.0Global Infrastructure6.0Cash4.0International Listed Property3.01.0Australian Listed Australian Equity Australian Listed Fixed isted PropertyCashContribution analysis attributes the total return of the portfolio to each asset class. It has been calculated based on NAV returns of the underlying ETFs.Holdings² (%)Equity Sectors (GICS)%Energy3.1Materials8.9IndustrialsConsumer DiscretionaryConsumer StaplesHealthcareFinancialsInformation TechnologyCommunication ServicesUtilitiesReal Estate9.0 Vanguard MSCI Intl (Hdg) ETFSPDR S&P/ASX 200 ETF9.1 iShares Core Composite Bond ETF6.0 BetaShares FTSE RAFI Australia 200 ETFMagellan Global Active ETF (MGE Prior Nov 2020)7.5Vanguard Intl Fxd Intr (Hdg) ETF16.2 BetaShares Legg Mason Australian Bd ETFMagellan Infrastructure Ccy Hdg ETF12.3VanEck Vectors Australian Equal Wt ETF7.5 VanEck Vectors MSCI Wld ex Aus Qlty ETF7.1 Vanguard FTSE Emerging Markets Shrs ETFVanguard Intl Credit Secs (Hdg) ETF13.3 BetaShares Aus High Interest Cash ETFVanEck Vectors FTSE Intl Prop Hdg ETFVanguard Australian Property Secs ETFMagellan Global Active ETFEquityStyleBoxÈÈÇÉÈÈÉÈËÇÉPortfolio 0.300.200.421.050.350.400.480.300.180.430.231.353 MoTotalRet6 MoTotalRet1 26.481.520.5032.5934.192 4621.5711.473.160.835.013.03Past Performance is not a reliable indicator of future performance. Please see back page for important information on how performance is calculated. 2021 Morningstar, Inc. All rights reserved. Neither Morningstar, its affiliates, nor the content providers guarantee the data or content contained herein to be accurate, complete or timely nor will they have any liability for its use or distribution.3 9.8310.584.801.238.23
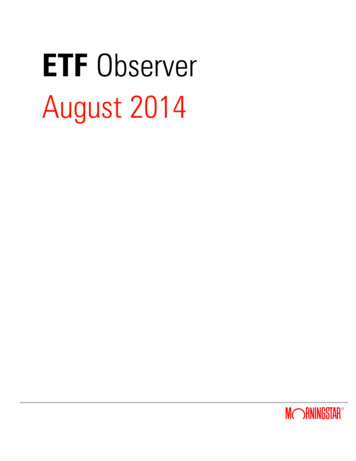
Morningstar ETF Balanced Model PortfolioPortfolio Manager: Tim MurphyPortfolio Date: 30/06/2021Time HorizonGrowth/Defensive5 Years50/50Growth of 10,000 (after fees, before tax)¹Risk ProfileThis suits investors with a minimum five-year timeframe orthose who seek both income and capital growth. Thisportfolio suits investors who desire a modest level of capitalstability but are willing to accept moderate investment valuevolatility in return for commensurate potential investmentperformance, hence the 50.0 percent exposure to growth(shares and listed property) and 50.0 percent exposure toincome (cash and fixed interest) assets.Time Period: 1/07/2014 to e Morningstar ETF Model Portfolios are constructed usingthe risk and return attributes of the Morningstar Risk Profiles.Underpinning these attributes is a set of investmentobjectives and time horizons that differentiate the five modelportfolios across the risk/return spectrum.Each of the Morningstar ETF Model Portfolios aims to beappropriately diversified by ETF issuer and asset class whileadhering to a long-term strategic asset allocation setting.This setting has been devised using Morningstar’s strategicasset allocation framework and long-term capital gstar ETF Balanced Model Portfolio20192021Morningstar Category Average - BalancedPortfolio Returns¹1Mth %3Mth %6Mth %1Yr %3Yr %5Yr %Incp %p.aMorningstar ETF Balanced Model Portfolio1.64.65.813.17.47.27.1Morningstar Category Average - Balanced1.44.56.815.06.36.46.0Since Inception Date: 30/06/2014Asset AllocationContribution%Fixed Interest39.0International Equity22.0Australian Equity19.0Cash11.0Global InfrastructureInternational Listed PropertyTotal5.04.0100.0Time Period: 1/04/2021 to alian Equity Fixed InterestGlobalInfrastructureInternationalListed PropertyCashAustralian ListedPropertyContribution analysis attributes the total return of the portfolio to each asset class. It has been calculated based on NAV returns of the underlying ETFs.Holdings² (%)Equity Sectors (GICS)%Energy3.1Materials9.0Industrials9.3Consumer Discretionary9.0Consumer Staples5.9Healthcare7.5Financials16.3Information Technology11.9Communication Services7.3Utilities7.8Real Estate13.0EquityStyleBoxBetaShares Aus High Interest Cash ETFiShares Core Composite Bond ETFBetaShares Legg Mason Australian Bd ETFVanguard Intl Fxd Intr (Hdg) ETFVanguard MSCI Intl (Hdg) ETFSPDR S&P/ASX 200 ETFVanguard Intl Credit Secs (Hdg) ETFBetaShares FTSE RAFI Australia 200 ETFMagellan Global Active ETF (MGE Prior Nov 2020)Magellan Infrastructure Ccy Hdg ETFVanEck Vectors Australian Equal Wt ETFVanEck Vectors FTSE Intl Prop Hdg ETFVanEck Vectors MSCI Wld ex Aus Qlty ETFVanguard FTSE Emerging Markets Shrs ETFMagellan Global Active ETFÈÈÇÉÈÈËÉÈÉPortfolio 0.200.210.130.300.301.050.350.430.400.481.353 MoTotalRet6 MoTotalRet1 YrTotalRet2 YrTotalRet(Ann)3 60.047.465.0121.5711.471.233.99Past Performance is not a reliable indicator of future performance. Please see back page for important information on how performance is calculated. 2021 Morningstar, Inc. All rights reserved. Neither Morningstar, its affiliates, nor the content providers guarantee the data or content contained herein to be accurate, complete or timely nor will they have any liability for its use or 8310.58
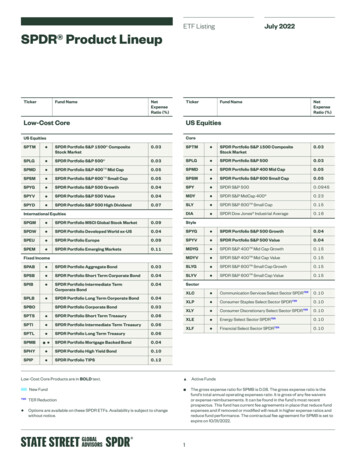
Morningstar ETF Cautious Model PortfolioPortfolio Manager: Tim MurphyPortfolio Date: 30/06/2021Time HorizonGrowth/Defensive3 Years30/70Growth of 10,000 (after fees, before tax)¹Risk ProfileThis suits investors with a minimum three-year timeframe orthose who primarily seek income with some potential forcapital growth. This portfolio also suits investors seeking alow level of investment value volatility, and therefore willingto accept lower potential investment performance, hence the70.0 percent exposure to income assets (cash and fixedinterest).Time Period: 1/07/2014 to e Morningstar ETF Model Portfolios are constructed usingthe risk and return attributes of the Morningstar Risk Profiles.Underpinning these attributes is a set of investmentobjectives and time horizons that differentiate the five modelportfolios across the risk/return spectrum.Each of the Morningstar ETF Model Portfolios aims to beappropriately diversified by ETF issuer and asset class whileadhering to a long-term strategic asset allocation setting.This setting has been devised using Morningstar’s strategicasset allocation framework and long-term capital gstar ETF Cautious Model Portfolio20192021Morningstar Category Average - ModeratePortfolio Returns¹1Mth %3Mth %6Mth %1Yr %3Yr %5Yr %Incp %p.aMorningstar ETF Cautious Model Portfolio1.13.23.27.15.65.15.5Morningstar Category Average - Moderate1.03.03.58.74.74.44.3Since Inception Date: 30/06/2014Asset AllocationContribution%Fixed Interest48.0Cash22.0International Equity13.0Australian Equity11.0Global InfrastructureInternational Listed PropertyTotal3.0Time Period: 1/04/2021 to 30/06/20211.00.03.0100.0-1.0Australian Equity InternationalEquityFixed InterestGlobalInfrastructureInternationalListed PropertyCashAustralian ListedPropertyContribution analysis attributes the total return of the portfolio to each asset class. It has been calculated based on NAV returns of the underlying ETFs.Holdings² (%)Equity Sectors (GICS)%Energy2.6Materials8.3Industrials9.4Consumer Discretionary8.7Consumer Staples6.0Healthcare8.2Financials13.6Information Technology12.7Communication Services7.8UtilitiesReal Estate7.914.9EquityStyleBoxBetaShares Aus High Interest Cash ETFiShares Core Composite Bond ETFBetaShares Legg Mason Australian Bd ETFVanguard Intl Fxd Intr (Hdg) ETFVanguard Intl Credit Secs (Hdg) ETFSPDR S&P/ASX 200 ETFVanguard MSCI Intl (Hdg) ETFMagellan Global Active ETF (MGE Prior Nov 2020)Magellan Infrastructure Ccy Hdg ETFVanEck Vectors Australian Equal Wt ETFVanEck Vectors FTSE Intl Prop Hdg ETFVanEck Vectors MSCI Wld ex Aus Qlty ETFMagellan Global Active ETFÈÈÉÈÈËÉÉPortfolio .130.211.050.350.430.401.353 MoTotalRet6 MoTotalRet1 YrTotalRet2 YrTotalRet(Ann)3 543.168.5617.639.260.047.465.0121.571.233.99Past Performance is not a reliable indicator of future performance. Please see back page for important information on how performance is calculated. 2021 Morningstar, Inc. All rights reserved. Neither Morningstar, its affiliates, nor the content providers guarantee the data or content contained herein to be accurate, complete or timely nor will they have any liability for its use or distribution.3.184.809.4913.5512.555.098.6119.83
Morningstar ETF Conservative Model PortfolioPortfolio Manager: Tim MurphyPortfolio Date: 30/06/2021Time HorizonGrowth/Defensive2 Years15/85Growth of 10,000 (after fees, before tax)¹Risk ProfileThis suits investors with a minimum two-year timeframe orthose that seek a portfolio comprising mainly of interestbearing assets. This portfolio suits investors who give a highpriority to the preservation of capital and are therefore willingto accept lower potential investment performance, hence the85.0 percent exposure to income assets (cash and fixedinterest).Time Period: 1/07/2014 to e Morningstar ETF Model Portfolios are constructed usingthe risk and return attributes of the Morningstar Risk Profiles.Underpinning these attributes is a set of investmentobjectives and time horizons that differentiate the five modelportfolios across the risk/return spectrum.Each of the Morningstar ETF Model Portfolios aims to beappropriately diversified by ETF issuer and asset class whileadhering to a long-term strategic asset allocation setting.This setting has been devised using Morningstar’s strategicasset allocation framework and long-term capital gstar ETF Conservative Model Portfolio20192021Morningstar Category Average - ConservativePortfolio Returns¹1Mth %3Mth %6Mth %1Yr %3Yr %5Yr %Incp %p.aMorningstar ETF Conservative Model Portfolio0.71.91.13.54.13.74.2Morningstar Category Average - Conservative0.62.21.34.93.63.33.5Since Inception Date: 30/06/2014Asset AllocationContribution% Time Period: 1/04/2021 to 30/06/2021Fixed Interest57.0 1.0Cash28.0International EquityAustralian EquityGlobal InfrastructureTotal7.0 0.55.03.0100.00.0-0.5Fixed InterestAustralian EquityInternational EquityGlobal Infrastructure International ListedPropertyCashContribution analysis attributes the total return of the portfolio to each asset class. It has been calculated based on NAV returns of the underlying ETFs.Holdings² (%)Equity Sectors r DiscretionaryConsumer StaplesHealthcareEquityStyleBox10.3 BetaShares Aus High Interest Cash ETF6.9 iShares Core Composite Bond ETF7.0 BetaShares Legg Mason Australian Bd ETFPortfolio ManagementWeightingFee3 MoTotalRet6 MoTotalRet1 YrTotalRet2 YrTotalRet(Ann)3 79Financials14.1 Vanguard Intl Fxd Intr (Hdg) ETF14.000.200.48-2.52-2.101.543.18Information Technology11.1 Vanguard Intl Credit Secs (Hdg) 27.768.569.4912.55Communication ServicesUtilitiesReal Estate9.4 SPDR S&P/ASX 200 ETF14.2 Magellan Global Active ETF (MGE Prior Nov 2020)ÈÉ4.008.7012.249.239.265.7 Magellan Infrastructure Ccy Hdg ETFÈ3.001.053.536.908.440.045.09Vanguard MSCI Intl (Hdg) ETFÈ3.000.218.1314.5537.2917.6313.55Magellan Global Active ETFÉ0.001.358.7012.24Past Performance is not a reliable indicator of future performance. Please see back page for important information on how performance is calculated. 2021 Morningstar, Inc. All rights reserved. Neither Morningstar, its affiliates, nor the content providers guarantee the data or content contained herein to be accurate, complete or timely nor will they have any liability for its use or distribution.
Morningstar ETF Portfolios Methodology and Disclaimer¹How is the Morningstar ETF Model Portfolios' Performance Calculated?Performance results represent modelled performance only. Past performance of any investment is not a reliable indicator of future performance andthe performance described here is of a theoretical model. The model performance will differ from actual performance which follows that modeldepending on actual transaction fees, taxes and other factors including transaction timing and divergence from constituent weightings, roundingadjustments and minimum trade sizes.Performance of the Morningstar ETF Model Portfolios is expressed on the following basis: before deduction of transaction costs or fees (i.e. brokerage fees or bid/ask spreads) and taxes payable without allowing for franking credits; and income and distributions that would notionally be received are theoretically reinvested without any tax deduction.²How is the individual holding’s performance calculated?Morningstar calculates the performance on the following basis: before transaction costs or fees (i.e. brokerage fees or bid/ask spreads) and taxes payable income and distributions received during the period are reinvested without any tax deductionDisclaimer 2021 Morningstar, Inc. All rights reserved. Any general advice or ‘regulated financial advice’ under New Zealand law has been prepared by MorningstarAustralasia Pty Ltd (ABN: 95 090 665 544, AFSL: 240892) and/or Morningstar Research Ltd, subsidiaries of Morningstar, Inc, without reference to yourobjectives, financial situation or needs. Refer to our Financial Services Guide (AU) and Financial Advice Provider Disclosure Statement (NZ) for moreinformation at www.morningstar.com.au/s/fsg.pdf and www.morningstar.com.au/s/fapds.pdf. You should consider the advice in light of these matters andif applicable, the relevant Product Disclosure Statement before making any decision to invest. Our publications, ratings and products should be viewed asan additional investment resource, not as your sole source of information. Past performance does not necessarily indicate a financial product’s futureperformance. To obtain advice tailored to your situation, contact a professional financial adviser. Some material is copyright and published under licencefrom ASX Operations Pty Ltd ACN 004 523 782.
VanEck Vectors MSCI Wld ex Aus Qlty ETF Vanguard FTSE Emerging Markets Shrs ETF Vanguard Intl Credit Secs (Hdg) ETF BetaShares Aus High Interest Cash ETF VanEck Vectors FTSE Intl Prop Hdg ETF Vanguard Australian Property Secs ETF Magellan Global Active ETF 8.00 0.15 7.00 7.00 0.20 6.00 0.42 5.00 0.30 4.00 0.18 8.13 14.55 37.29 17.63 13.55