Transcription
Asset management industry – A nextstep towards further consolidationFinancial Advisory, November 2020
The asset management industry continuous to be an attractivemarket in terms of revenue growth and profitability, howeverthe industry is facing challenges from different anglesThere is substantial pressure on profitability and active playersstruggle to outperform passive product offerings including aneed for scale to operate efficiently not the least because ofcompliance and regulatory requirements. In response manyasset management companies have been changing strategiesto expand scale trusting that size will result in a competitiveadvantage 2020 Deloitte The NetherlandsInvestment management – A next step towards further consolidation2
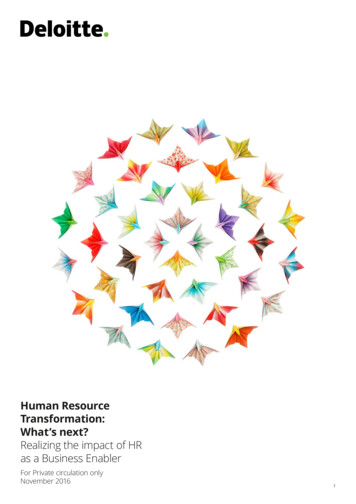
1. IntroductionThe asset management industry has shown substantialgrowth in net assets driven by driven by a search for yieldon investmentsTotal net asset increase of word wide regulated open-end funds (EUR trillion)60c. EUR 49trillionyear-endin 20199.5%453015For the period 2010 to 2019, the asset management industry* hasshown substantial growth in net assets** driven by low term yields ongovernment bonds, mainly in the EU zone, and driven by a search foryield on investments.We expect for the near future a further increase in growth for theinvestment management industry driven by i) an increase in appetitefor long term personal savings and ii) attracting new clients by offeringnew investments – PE investments and more cross border activities.Due to fee pressure from increased regulatory costs and investments toimprove customer experience, together with a scattered investmentmanager landscape in the Netherlands, we expect a furtherconsolidation in the market of investment US and EU 10 year government bonds4.0%US3.0%EU2.0%1.0%-1.0%Jan 2010Aug 2020MSCI index (Jan 2010 as starting point)25020015010050* In this document asset management industry includes both pure play asset management companies as well as wealthinvestment management companies.** Measured based on regulated funds (bonds, money-market, mixed and equity funds) 2020 Deloitte The Netherlands0Jan 2010Aug 2020Source: ICI factbook 2020, Capital IQInvestment management – A next step towards further consolidation3
1. IntroductionWe have performed an analysis to provide industry insights of the investment management industry and to share ourview for the foreseeable futureOther sections in this document6We have performed an analysis to provideindustry insights of the global investmentmanagement industry in terms of some ofthe key industry’s financial metrices.5As we experience an increase in M&Atransactions over the last few years we focuson some integration pitfalls followed byvaluation considerations for assetmanagement companies globally.4Next, we provide a condensed overview ofthe asset management industry in theNetherlands followed by our expectedoutlook for the foreseeable future givencurrent industry challenges and trends.32 2020 Deloitte The NetherlandsOutlookThe NetherlandsValuationConsiderationsM&A and synergyrealisationIndustry insightsInvestment management – A next step towards further consolidation4
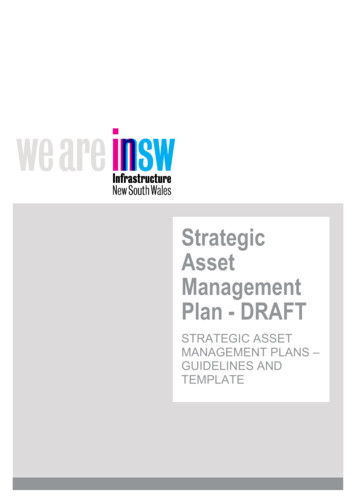
2. Industry insightsThe top 10 listed global asset management companiesaccount for more than 90% of total AUM of our peergroupFor years, the asset management industry has been an attractiveindustry given the high margins, high historical growth and capitalrequirements which are in general less tight compared to banks.Industry concentration is a key characteristic of the asset managementindustry. Globally, the ten largest listed asset management companiesaccount for over 90% of total assets under management.We have analysed the development of key financials of publicly listedasset management companies* to assess if there are any differences interms of profitability in relation to size.Based on reported 2019 asset under management (“AUM”) we dividedour sample of 40 companies in three groups: Top 10 asset management companies Mid-size asset management companies Small size asset management companies* Peer group companies selected based on publicly owned financial service providers of whichthe majority of the activities consist of asset management. 2020 Deloitte The NetherlandsAsset Managers peer group’s AUM 2019 ( bn)BlackRock, Inc.Amundi SAInvesco Ltd.T. Rowe Price Group, Inc.Affiliated Managers Group, Inc.Franklin Resources, Inc.Schroders plcFederated Hermes, Inc.Janus Henderson Group plcAnima Holding S.p.A.BrightSphere Investment Group Inc.GAM Holding AGArtisan Partners Asset Management Inc.Man Group plcVirtus Investment Partners, Inc.CI Financial CorpAshmore Group PLCCohen & Steers, Inc.Pendal Group LimitedMagellan Financial Group LimitedJupiter Fund Management PlcPzena Investment Management, IncGAMCO Investors, Inc.Liontrust Asset Management PLCPerpetual LimitedManning & Napier, Inc.Impax Asset Management Group plcBrooks Macdonald Group plcPolar Capital Holdings plcValue Partners Group LimitedPremier Miton Group plcCity of London Investment Group PLCHennessy Advisors, Inc.Australian Ethical Investment Ltd.U.S. Global Investors, Inc.Easton Investments LimitedJS Investments LimitedK2 Asset Management Holdings LtdShriram Asset Management Company Limited6,6211,4191,0931,075644635Top-10 asset 181717171514137542210000200Mid-size asset managersSmall size asset managers4006001,2001,400Investment management – A next step towards further consolidation6,8005
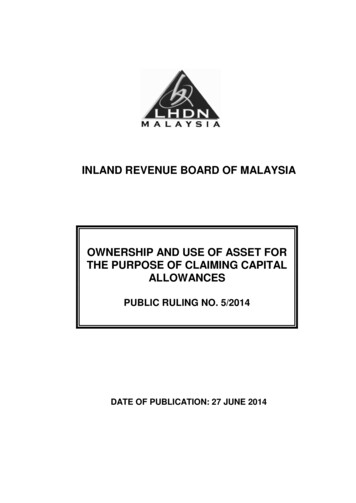
2. Industry insightsThe smallest listed asset management companies are mainly located in Europe and the Asia-Pacific regionThe US and Canada show the highest concentration of the top-10 assetmanagement companies followed by Europe. None of the top-10 largestasset management companies is located in the Asia-Pacific region.Asia is one such market for asset management companies as majordemographic shifts are taking place in the region. This region accountsfor c. 62% of the world’s millennials as well as 63% of the world’s agingworkforce. Investment managers are aiming to provide investmentsolutions to both of these groups. According to earlier analysis *, thisopportunity may result in EUR 2.3 trillion AUM in 2020.Asset management companies in Asia-Pacific are mainly present in thesmall size bucket (c.26%). Although the Asia-Pacific asset managementindustry is growing, the firms are still comparatively small.Finding new markets and investors for existing products is key forprofitable growth for asset management companies.Top-10 Asset managers 2019* Deloitte, 2020 investment management outlook, 2019Mid-size asset managers 2019US and CanadaEurope7.7%11.5%19.3%25.7%Asia / Pacific 15bn AUMTop-1033.9%80.7% 2020 Deloitte The NetherlandsSmall size asset managers 2019(excl. top10)54.6% 15bnAUM66.6%Investment management – A next step towards further consolidation6
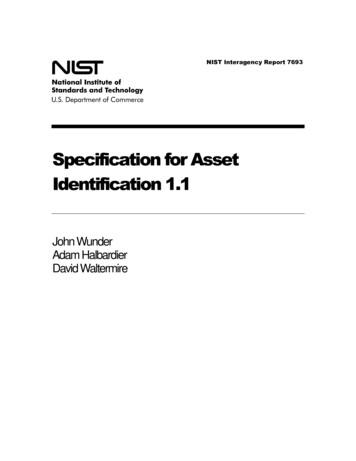
2. Industry insightsInvestment management has shown high growth in terms of AUM, revenues and profit. Profitability margins aredecreasing from 2015 to 2019, due to greater price transparency and increasing cost awareness among clientsAssets under management ( bn)Revenues ( bn)Costs ( bn)Profit margin (%)3.2%10.0%10.8%Total AUM increased with an annualgrowth rate of 14.5% between 2010and 2014 and with 10.0% for theperiod 2015 - 2019. This growth isthe result of net inflows in funds, aswell as a favorable marketenvironment.Note: Above graphs are based on the peer group oflisted Asset Managers presented on p.5 2020 Deloitte The Netherlands-6.0%2.0%309.5%14.5%’10 ’11 ’12 ’13 ’14 ’15 ’16 ’17 ’18 ’194.5%3229293430302925’10 ’11 ’12 ’13 ’14 ’15 ’16 ’17 ’18 ’19’10 ’11 ’12 ’13 ’14 ’15 ’16 ’17 ’18 ’19Total revenues increased with aCAGR* of 10.8% for the period2010 to 2014 and with 3.2% for theperiod 2015 - 2019. On a relativebasis, increase in revenues islagging AUM growth implying apressure on fees.Costs increased by a CAGR of 4.5%for the period 2015-2019. It shows afaster increase than revenues for thesame period indicating lower profitmargins for asset managers. The maindriver of cost increases relates toregulatory costs and investments toimprove customer experience.* Compound annual growth rate26’10 ’11 ’12 ’13 ’14 ’15 ’16 ’17 ’18 ’19EBIT margins remain behind as costsare rising at a higher pace thanrevenues. Changes to currentoperating models are necessary inorder to stay profitable in the future.Investment management – A next step towards further consolidation7
2. Industry insightsRevenue growth remains behind AUM growth in allregions, indicating that fees are under pressureAUM CAGR 2015 - 2019Revenues CAGR 2015 - 201912.5%9.4%7.8%Even though the US / Canada dominate the asset management industry,there has been significant growth in AUM in Asia-Pacific and Europe inthe past five years. Europe has been the strongest contributor in termsof AUM growth, averaging 12.5% per year since 2015.However, revenue growth remained behind AUM growth rates in allregions, indicating that fund fees are under pressure. Both in the US /Canada and Europe costs exceed revenue growth rates during the pastfive years, showing on average declining margins in these maturemarkets.6.9%3.7%2.0%US / CanadaEuropeAsia / PacificEuropeAsia / Pacific *Improvement (decline) of absoluteEBIT margin 2015 vs 2019Costs CAGR 2015 - 2019In US / Canada and Europe profitability is under pressure resulting in adecline in the development of EBIT-margins for the period 2015 - 2019.In Asia-Pacific markets profitability has improved slightly since 2015.US / Canada8.0%3.8%3.3%2.6%US / Canada* As indicated on slide 6, the Asia/Pacific region is considered a growth market due to relatively high number of millennialsand 63% and aging workforce. Given that analysis only includes listed asset management companies, the presented revenueCAGR for the Asia/Pacific may not reflect this potential.EuropeAsia / Pacific-3.2%-2.9%US / CanadaEuropeAsia / PacificNote: Above graphs are based on the peer group of listed Asset Managers presented on p.5 2020 Deloitte The NetherlandsInvestment management – A next step towards further consolidation8
2. Industry insightsCapital requirements for asset management companieswill be changing in 2021The way in which asset management companies are to be treated forthe purposes of prudential regulation is changing. The introduction ofthe Investment Firms Regulation 1 (IFR) and Investment Firms Directive(IFD)2 will make significant alterations to the EU prudential frameworkgoverning asset management companies.Currently, both asset management companies and credit institutionsare subject to the same EU prudential rules, being a combination of theprovisions set out in Capital Requirements Regulation (CRR) and theCapital Requirements Directive (CRD IV) which are derived from theBasel standards.The current rules differentiate between more than 10 differentcategories of companies. The categories will be simplified into three andbe a function of company’s size and activity, not just the regulatoryactivities it undertakes. They are expected to come into force as permid-year 2021 (26 June).Company classification under IFR/IFD123Capital requirements under IFR/IFDClass 1 companiesClass 1 companies will be thosethat are bank like or pose asystemic risk. These firms willcontinue under CRD IV.These companies will remainsubject to CRR and CRD IV andmay be required to bereauthorized as a creditinstitution.Class 2 companiesAsset management companiesexceeding the categorisationthresholds for small and noninterconnected companies.Class 2 asset managers will besubject to the full prudentialIFR/IFD regime.Higher of: initial capital requirements(ICR) (EUR 75k, EUR 150k orEUR 750k) fixed overhead requirement(FOR), being 25% of fixedoverheads of the previousyear Only applicable to class 2companies: K-factorrequirements, being a riskweighted formula for eachtype of activity the companyundertakes including risks tocustomers, market and firm.Class 3 companiesSmall and non-interconnectedasset management companies.These companies will also besubject to the new IFR regimeSource: AIMA, a brave new world new capital requirements for investment firms, 2018 2020 Deloitte The NetherlandsInvestment management – A next step towards further consolidation9
3. M&A and synergy realisationDecreasing margins, scatted number of assetmanagement companies and search for cost efficiency,have driven M&A transactionsGlobal Investment Management M&A – YTD AugustVolumeValue (US B)21.4% bn35For 2020, despite COVID-19 the number of deals and deal valueremains at a steady level.25206876185095542015 YTDAugust2016 YTDAugust6341510502017 YTDAugust2018 YTDAugust2019 YTDAugustGlobal Investment Management M&A – Monthly2020 YTDAugustVolumeValue (US B) bn10103890108959583826757576mrt-20Developments such as i) the lack of organic growth as institutionalretirement plans unwind and individuals are not able to set up theirsavings plan, ii) continuous fee pressure and iii) an increase in fixedcosts as clients request more innovative reporting and customerexperience, further increased the pace in M&A transaction of assetmanagement companies. Up to 2018 the number of deals worldwideincreased to 714 YTD August followed by a decline to 634 deals for YTDAugust 2020.71430jan-20Driven by historical low barriers to entry, high margins and strongorganic growth, transactions between asset managers have beenconsidered attractive.819042 2020 Deloitte The NetherlandsInvestment management – A next step towards further rt-19jan-19nov-18sep-18010
3. M&A and synergy realisationSize does not always matter in terms of profitabilityMatrix 2019 Asset Under Management / ProfitabilityEBIT margin85%For years, many mergers and acquisitions in the asset managementindustry were initiated for amongst others to add investmentcapabilities, expansion of distribution channels and to generateeconomies of scale by creating cost advantages.60%55%50%As can be observed in the graph to the right there is no clear correlationbetween higher AUM and higher profitability margins1. The problem isthat having a higher AUM does not necessarily make a firm morecompetitive. Value is also created in areas where a specific assetmanagement company has a competitive advantage or when companiesstrategically build such a position.Integration is key and research has shown that successfully integratedfirms*: Have a much higher increase of net flows; and Have a cost structure which is 8.5% lower compared to nonintegrated firms and have profitability levels that are 20% higher.45%40%35%30%25%20%15%10%5%1In terms of EBIT margin* More Perfect Unions, Integrating to Add Value in Asset ManagementM&A, Casey Quirk, Deloitte, 2019 2020 Deloitte The Netherlands0%02004006008001,0001,2001,400Note: The size of the circles in above graphs represents the volume of revenues, themiddle of the circle is placed at the level of AuM and EBIT margin on the x- and y-axisInvestment management – A next step towards further consolidation6,800AuM ( bn)11
3. M&A and synergy realisationRealisation of synergies following M&A transactions hasproven to be difficult to accomplishResearch* has proven that successful integration strategies have beendifficult. The following four measures are crucial:1. Organizational models: Avoid co-leadership structures and reducelayers in the organization which may result in a decrease ofheadcount and corresponding costs of 60%;2.3.4.Distribution strategy: Less integrated firms have in general ahigher proportion of distribution expenses related to sales. Abetter use of technology, better customer segmentation and ahigher focus on a mix of talent – instead of only focusing on salespeople – is positively correlated with profitability.Enterprise and investment operations: Compared to peers,successfully integrated asset managers spend less on investmentoperations, middle and back-office systems and functions such aslegal, finance, compliance and risk management.Technology: Although for a majority of asset managers technologycosts have been optimized by e.g. means of outsourcing, furtherimprovements can be realized in terms of i) expenses for marketdata, ii) hardware, primarily network and data centers, iii) clientrelationship management tools, iv) cyber and disaster recoveryprograms, v) finance and finance operations and vi) investmentsystems including order management and trade processing. 2020 Deloitte The NetherlandsKey synergy drivers (% of revenue)Distribution strategy(1.8%)Reorganizing coveragestructure and shiftingspending towardtechnology and clientexperienceOrganizationalleadership (2.4%)Reducing redundanciesand migrating tometrics and rewardsthat favor collectiveexecution of the newstrategyTechnology (1.1%)Deciding where systemintegration createsefficiency –and where itdoesn’tEnterprise andinvestment operations(1.8%)Identifying areas ofleverage and overlapacross functionalsupport areas* More Perfect Unions, Integrating to Add Value in Asset ManagementM&A, Casey Quirk, Deloitte, 2019Investment management – A next step towards further consolidation12
2. Valuation4.Market insightsconsiderationsFor the period 2010 – 2019 we observe that generallyapplied valuation multiples in the asset managementindustry decreasedGenerally applied valuation multiples of asset management companiesare Enterprise Value/EBIT multiples and Enterprise Value/AUMmultiples. In selecting the appropriate multiple the following valuedrivers for asset management companies should be considered: Size Revenue growth – organic or market growth Revenue source – commission based or fee based Client portfolioEnterprise Value / EBIT multiples15x10x5x201020112012Employee compensation and employee demographics Any company specific risks.From a valuation point of view we observed that for the period 2010 –2019 Enterprise value/EBIT multiples decreased from c. 11.0x for theperiod 2010 – 2014 to c. 9.5x for the period 2015 - 2019. EnterpriseValue to AUM multiple, a common multiple in the asset managementindustry shows also a declining pattern, an average of c. 2.6% for theperiod 2010 – 2014 to c. 2.1% for the period 2015 - 2019. 2020 Deloitte The Netherlands2013201420152016201720182019Enterprise Value/AUM multiples4% 5 year average5 year %1%201020112012201320142015201620172018Investment management – A next step towards further consolidation201913
4. Valuation considerationsIn selecting AUM multiples careful consideration shouldbe made for the fee structure and profitabilityFor asset management company valuations often a rule of thumb of 1%to 2% of Enterprise Value to AUM is applied. As with each business, therevenue is a function of price and quantity where the price is the feecharged for the services to clients and the quantity the assets undermanagement.Companywith AUMRule of thumbvaluation basedon 1.5% AUMmultipleAverage feeSimplified P&LImplied EBITmultipleCompany AAUM 30bn30030%EBIT marginEBIT 90mx30bn450m1.0% fee905xEBIT450m Rev. 300mRevenuesCompany BThe value comes from the profit that is generated on the revenues.Asset management companies with low profitability should have anAUM multiple on the low-end of the range while asset managementcompanies with sustainable higher than normal margins typically shouldresult in higher Enterprise Value to AUM multiples and hence highervaluations.AUM 30bnx1500.5% feeEBIT margin23 Rev. 150m15%RevenuesEBITEBIT 23m20x450mIllustrative purpose onlyThis is explained in the graph to the right. Companies with an equalAUM, but different fee structure and profitability should in theory bevalued based on different Enterprise Value to AUM multiples.Company A and B have similar AUM balances. However, company A charges a higher feeand is significantly more profitable than company B. Consequently, company A is able togenerate approximately four times the profitability of company B. If one would apply therule of thumb 1.5% of AUM, both businesses yield a 450 valuation, an effective EBITmultiple of 5x for company A and 20x for company B.Based on this simple example, the valuation for company B based on a 1.5% AUM multipleseems too high given its profitability. On the other hand, the valuation for company Abased on the same multiple may be perceived too low compared to the valuation ofcompany B. 2020 Deloitte The NetherlandsInvestment management – A next step towards further consolidation14
4. Valuation considerationsA discounted cash flow model is better suited to estimatethe value of certain synergiesDCF schematic overviewExplicit forecast periodThis approach involves forecasting the appropriate cash flow stream foran appropriate period and then discounting it back to a present value atan appropriate discount rate. This discount rate should consider thetime value of money, inflation and the risk inherent in ownership of theasset or security interest being valued.The advantage of this approach is that the value of synergy cases can beconsidered separately. Hence, in the pricing of the potential transaction,these synergies can be included in a transparent manner.Sensitivityanalysis EBITmarginSensitivityanalysis RevenuegrowthRevenues & EBIT marginGiven the potential synergies involving M&A transactions in the assetmanagement industry, we recommend the income approach, andparticularly the discounted cash flow method in transaction valuationanalyses.Terminal Value periodFY20FY21FY22FY23FY24Enterprise Value synergy bridgeStable EBIT marginPerpetual growthrateTerminalValueSanity checkAUMSanity checkAUM *2.5%Sanity checks should be performed to assess if the resulting outcome ofthe Enterprise Value relative to AUM would be reasonable.1.0%Base caseSynergieSynergiecaseAcase onlyB* Presented figures are for illustrative purposes 2020 Deloitte The NetherlandsSynergiecase CTotalEnterpriseValueInvestment management – A next step towards further consolidationEV as% AuM15
5. The NetherlandsThe Netherlands is a very well-developed assetmanagement market in terms of regulated mutual fundsStock market capitalization as a % of GDPRegulated open-end long-termfund total net assets as % of GDP110%The demand for products offered by asset management companies isclosely linked to the development of equity markets. The Netherlands’stock market capitalization exceeds the GDP, indicating a highlydeveloped equity capital market.In the Netherlands, the asset management industry is a well-developedindustry. Measured in terms of regulated open-end funds, total netassets amounts to 94% of the total GDP which indicates a welldeveloped fund industry*.Total net assets of investments in regulated open-end funds increasedfrom EUR 671bn in 2015 to EUR 856bn in 2019.The number of funds of decreased from 1,051 funds in 2019 to 962 in2019. This is driven by among others cost-efficiency reasons - the costsof operating funds are spread across the combined assets of severalfunds in trust. According to the ICI factbook 2020, the increasedavailability of other investment offerings has resulted to changes in howinvestors are allocating their portfolios. The percentage of mutual fundcompanies attracting net new investments and retaining assetsgenerally has been lower in recent years.Regulated Open-End Funds in the Netherlands: Total net assets ( bn) 6.3%671 2020 Deloitte The Netherlands731769750856c. 5% oftotal fundsin Europe **20152016201720182019Regulated Open-End Funds: Number of Funds in the Netherlands-2.2%1,0512015* ICI Factbook 2020, page 23* For a full overview please refer to Appendix 194%1,0142016991201793196220182019c. 1.6% oftotal # offunds inEuropeNote: Please refer to the Appendix 1 and 2 for an overview of the total net assets and thenumber of funds for other countriesInvestment management – A next step towards further consolidation16
5. The NetherlandsThe number of households holding investment accounts increased by on average 8.1% per year for the period 2015 –2018. The average invested amount per household fluctuates at around EUR 26k for the period 2010 to 2018#Dutch households that hold investment account% households compared to total householdsAverage amount on investment accountEUR k# million1.51.4 8.1%-6.5%1.51.420%-7.2% 7.2%1.41.2351.21.11.14015%1.130Ø 14’15’16’17’18The number of investing householdsincreased the past five years toapproximately 1.5m at the end of 2018. Theincrease is mainly driven by low term yieldson government bonds, economic growth andthe popularity of online asset management. 2020 Deloitte The Netherlands0’10 ’11 ’12 ’13 ’14 ’15 ’16 ’17 ’18The same pattern is observed for the numberof households measured in terms of totalhouseholds. A sharp increase for the 2015 –2018 indicating an increasing appetite inholding investment accounts.Source: Kantar (TNS NIPO), De Nederlandse utch households have a combined investedcapital of circa 35bn at the end of 2018,corresponding to an average investingamount of about 23,300 per investinghousehold.Investment management – A next step towards further consolidation17
5. The NetherlandsThe asset management landscape in the Netherlands is highly scattered ranging from institutional asset managers tosmaller independent asset managers and online investment service providersThe asset management landscape in the Netherlands can be broadly split up in the groups presented below. The market is highly fragmented. Thelargest asset managers are related to institutional asset managers or banks / insurance companies. The majority of asset management companiescomprises of (smaller) independent companies. In the figure below an overview of asset management companies in the Netherlands is presented(without being complete).Institutional investors 2020 Deloitte The NetherlandsInsurance companies and banksIndependent asset managersOnline serviceprovidersInvestment management – A next step towards further consolidation18
5. The NetherlandsThe number of deals in the Dutch asset managementmarket shows a pattern towards further consolidationNumber of M&A transaction in the Dutch asset management industry125 year average8In the past five years the number of M&A transactions in theNetherlands has on average doubled compared to the preceding fiveyears.One of the main drivers is the increase of operational costs for assetmanagements to comply with, among others, the commission banregulation, GDPR privacy legislation, the anti Money Laundering andTerrorist Financing regulation, PSD2 and Mifid II. Technology may helpsome of the asset management companies to manage operationalcosts. For others this will be more challenging and/or may requiresubstantial investments.On the other hand, clients are these days more interested in passivefunds and are not willing to compensate the fees for active funds.Hence, especially the smaller asset management companies feel marketpressure to act upon these market developments and potentially searchfor partners. 2020 Deloitte The 19Overview of some M&A transactionsDateTargetAcquirerAug 2020Hof Hoorneman Bankiers NVVan Lanschot KempenJan 2020ASR bank asset managementEvi van LanschotSep 2019Nobel VermogensbeheerDelen Private BankOct 2019Attent Vermogensbeheer, Boer & OlijEffectenhuis, Auréus Vermogen and 2undisclosed asset managersCapital CoachDec 2018The Dutch business of Julius BaerWealth Management PartnersAug 2018Fair Capital Partners Asset ManagementQuadia SAApr 2018ABN AMRO Investment SolutionsCandriam Investors GroupJan 2018Think ETF Asset ManagementVan Eck Associates CorporationSept 2017First InvestmentsASR VermogensbeheerMar 2017PritleBinckbankInvestment management – A next step towards further consolidation19
6. OutlookWe expect that asset management companies continue touse M&A activity to secure new capabilities and newmarketsMarket and product development growth alternativesMarket developmentNewCOVID-19 has changed the way we work and live which will furtherdrive technology enabled solutions within the industry. The futuresuccess of asset management companies will likely depend on theirability to use the crisis to accelerate their digital transformationagenda. This may result in substantial investments for assetmanagement companies.Like last years we expect that asset management companies continue touse M&A activity to secure new capabilities and new markets. Inaddition, technology is likely to become key in improving customerexperience, analyzing data and perform operations – likely acceleratedby COVID-19. Furthermore, additional investment proposition for PEfunds may result in new net inflows.Diversification Tilt toward Asia Mergers and acquisitions Alternatives goingmainstream Vertical integration Customer solutions enabledby technologyMarketProduct developmentMarket expansion Improvements in dataanalytics and technology Permanent capital pools Opportunity zone funds Enhancements in customerexperience Rise of thematic fundsCurrentExistingProductNewSource: 2020 Investment Management Outlook, Deloitte Insights, 2019Future developments of the asset management industry can besummarized in the two-by-two growth matrix presented on the left.The four categories relate to the development of new markets andproducts. The matrix comprises four quadrants i) market development,ii) diversification, iii) market expansion and iv) product development.Asset management companies should make their own decisions onwhich of these quadrants to focus on with each having their challenges. 2020 Deloitte The NetherlandsInvestment management – A next step towards further consolidation20
Mergers and AcquisitionsFrom conceiving strategy to selecting the right partner Fromconducting thorough due diligence to closing the deal Frombeginning to end, Delo
asset management companies is located in the Asia-Pacific region. Asset management companies in Asia-Pacific are mainly present in the small size bucket (c.26%). Although the Asia-Pacific asset management industry is growing, the firms are still comparatively small. Finding new markets and investors for existing products is key for