Transcription
Building a Big Data Analytics Service Frameworkfor Mobile Advertising and MarketingLei DengSchool of ComputerNorthwestern Polytechnical UniversityXi'an, Chinadenglei@gmail.comAbstract - The unprecedented growth in mobile deviceadoption and the rapid advancement of mobile technologies &wireless networks have created new opportunities in mobilemarketing and adverting. The opportunities for MobileMarketers and Advertisers include real-time customerengagement, improve customer experience, build brandloyalty, increase revenues, and drive customer satisfaction.The challenges, however, for the Marketers and Advertisersinclude how to analyze troves of data that mobile devices emitand how to derive customer engagement insights from themobile data. This research paper addresses the challenge bydeveloping Big Data Mobile Marketing analytics andadvertising recommendation framework. The proposedframework supports both offline and online advertisingoperations in which the selected analytics techniques are usedto provide advertising recommendations based on collectedBig Data on mobile user's profiles, access behaviors, andmobility patterns. The paper presents prototyping solutiondesign as well as its application and certain experimentalresults.Keywords - big data analytics, big data application, Big dataanalytics service, mobile advertising, mobile marketing, and encommerceI. INTRODUCTIONMobile Advertising poses three distinctive Opportunitiesand/or Challenges to Marketers and Advertisers: 1) theunprecedented adoption, 2) the customer engagementchallenges due to huge mobile datasets, and, finally, and 3) thepotential impact of mobility on digital marketing.First, the Mobile device adoption is increasing at a rapidpace. As indicated in [1], “every day more than 1 million newAndroid devices are activated worldwide”. Similarly, Apple, inSeptember 2014, announced that “it had sold over 10 millioniPhone 6‟s in the first three days of it being available. This isonly 1 million more than the over 9 million iPhone 5c‟s and 5s‟that it sold in 2013[2].” In [3], the McKinsey Global Institutepredicted that the full potential of the mobile Internet is yet tobe realized; over the coming decade, this technology couldfuel significant transformation and disruption, not least fromits potential to bring two billion to three billion more peopleinto the connected world, mostly from developing economies.McKinsey institute estimates that the Mobile Internet couldJerry Gao and Chandrasekar VuppalapatiComputer Engineering DepartmentSan Jose State UniversitySan Jose, United StatesCorresponding mail: jerry.gao@sjsu.edgenerate annual economic impact of 3.7 trillion to 10.8trillion globally by 2025. This value would come from threemain sources: a) improved delivery of services, b) productivityincreases in select work categories, and c) the value fromInternet use for the new Internet users who are likely to beadded in 2025 [24].Second, the mobile devices come with different formfactors, technologies, data points, and operating systems. Thesame is true with the users of the mobile devices. The Mobileusers exhibit diverse demographics, personal preferences,behavior, social presence, and location usage. Cohen [4]stated that according to Nielsen, 61% of the USA subscriberowned a smartphone. The demographics of the mobile usagein USA shows that 81% of adults aged 25-34 havesmartphones. Almost 70% of US teens age 13 - 17 use asmartphone, and 50% of US adults 55 own a smartphone.This clearly shows the age variation associated withsmartphone usage in USA. As the complexity of mobilephone increases and as the mobile users‟ demographics &personal preferences differ, the associated size of datasetswith the devices and users‟ will increase dramatically. Inorder to engage with the customers in a meaningful way, oneneeds to analyze the huge and diverse datasets.Third, recent, May 2014, Gartner Market Analysis [5]reveals that Mobility increasingly defines digital marketing. Asper the Gartner research, consumers are increasingly using theMobile phones as the remote for their lives. Gartner MobilityMarket Survey reveals that: a) 43% of respondents spend moretime on tablets than desktop, b) 80% smartphone owners haveused their device while shopping, c) 53% of searchers purchaseas a result of a smartphone search, d) and 86% use their phoneswhile consuming other media. The social and commerceactivities that consumers engage on their Mobile phones are redefining Mobile Adverting.It is clear that the mobile devices present huge opportunitiesto the marketers and advertisers. However, there arechallenges too. The challenges are associated with the type ofthe mobile data, structured & unstructured; the exclusivity ofthe data; the privacy & the context information associated withthe data; and the mining of advertising insights from themobile user data. Unless thoroughly data mined, there is ahuge chasm between the mobile users‟ expectations and themarketers‟/advertisers‟ exclusive campaigns to target
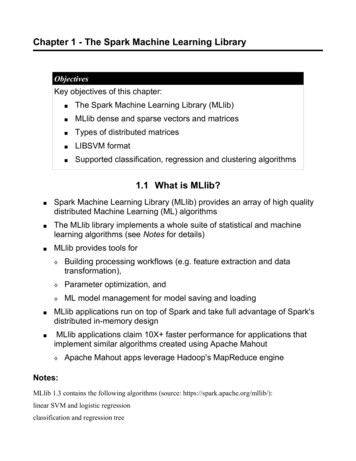
mindshare and wallet share of the mobile users. Analytics willhelp the marketers/advertisers in understanding of framing theconsumer behavior and start understand their expectation ofhow consumers like to communicate with them. In essence,the Analytics will help to close the chasm.This paper addresses the strong demand of mobile advertisingbased on a big data analytics approach. Its major contributionis its proposed innovative solution based a big data analyticsservice framework supporting mobile advertising based onmulti-dimension big data analytics. In this approach, we focuson location-based mobile advertising using by analyzing thebig data including mobile user profiling, mobile app usagepatterns, location-based mobile user access patterns, as well asmerchant related data. The paper presents our big dataanalytics methods, service framework design, as well as ourcase study results.The structure of this paper is presented as follows. Section 2discusses the basic concepts and methods about big dataanalytics for mobile advertising. Section 3 presents our bigdata analytics service system by focusing on its serviceframework. Section 4 discusses its related design andimplementation decisions, and Section 5 shows a case study.The conclusion and future work is included in Section 6.II. UNDERSTANDING BIG DATA ANALYTICS FOR MOBILEADVERTISINGBig data analytics.Big data computing environment towards analytics: Hadoopdefinitely attracts much attention as it is the first open sourcedistributed computing environment. But there are otherplatforms that have interesting advantages to the typicalHadoop implementation, especially in the real-time analyticsof dynamic information where Hadoop does not meet therequirement. Contrast to Hadoop, a batch processingframework, Storm is a stream processing framework andfocuses on continuous computation [6]. Storm was developedat twitter to process hundreds of millions of tweets generatedevery day and now is an open source big data analysis system.Spark is a scalable data analysis platform based on In-MemoryComputing and has performance advantage to Hadoop‟scluster storage method [7]. Spark is written in Scala and offerssingle data processing environment. Spark supports iterationtasks of distributed data sets.Big data analytics techniques :There are many Big Datatechniques including association rule learning, data mining,cluster analysis, crowdsourcing, machine learning, textanalytics, classification, data fusion, network analysis,optimization, predictive modeling, regression, special analysis,time series analysis and others. So, which ones are useddepends on the type of data being analyzed, the technologyavailable and the research questions one is trying to solve.Marketing analytics and advertising recommendationDecision Tree: Decision tree algorithm is used to classifythe attributes and decide the outcome of the class attribute. Inorder to construct decision tree both class attribute and itemattributes are required. Decision tree is a tree like structurewhere the intermediate nodes represent attributes of the data,leaf nodes represents the outcome of the data and the brancheshold the attribute value. Decision trees are widely used in theclassification process because no domain knowledge is neededto construct the decision tree. Figure 1 shows simple decisiontrees.Figure 1 Decision Tree ExamplesThe primary step in the decision tree algorithm is to identifythe root node for the given set of data. Multiple methods existto decide the root node of the decision tree. Information gainand Gini impurity are the primary methods used to identify theroot node. Root node plays important role in deciding whichside of decision tree the data falls into. Like everyclassification methods, decision trees are also constructedusing the training data and tested with the test data.Information Gain: Information gain is used to the root nodeand the branch nodes in the decision tree. Information gain iscalculated using entropy and information. Entropy iscalculated using the following formula [8].Information of the attribute is calculated using the followingformula.Information gain of an attribute is the difference betweenentropy and the information of that attribute. The attributewith the highest information gain is the root node, and the nextlevel nodes are identified using the next high information gainattributes. The algorithm and its pros and cons are listed below.Algorithm:Step 1: Calculate the information gain for all the attributesStep 2: Select the root node from the attribute list that has moreinformation gainStep 3: For each value of the root node
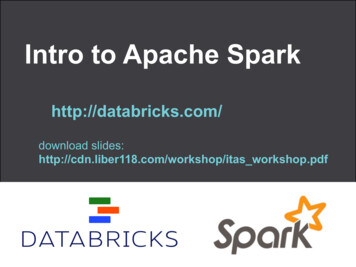
Step 4: Create a node for the attributes with next highestinformation gain.Step 5: For each value of the nodesStep 6: Create subset of training data for this nodeStep 7: If all the values of class node are same, create a leaf nodeand stopStep 8: Else go to step 5 and continueK Means Clustering: Clustering is identifying andclassifying the items in to similar groups. K-means clusteringis classifying the items in to k clusters based on their similarity.K is the number of clusters that we have to decide beforestarting the clustering process. The whole solution depends onthe K value. So, it is very important to choose a correct Kvalue. The data point is grouped in to a cluster based on theEuclidean distance between the point and the centroid of thecluster. Initial clustering can be done in one of three ways.1. Dynamically Chosen: In this method, we will choosethe first K items and assign to K clusters.2. Randomly Chosen: In this method, we randomlyselect the values and assign them to K clusters.3. Choosing from Upper and Lower Boundaries: In thismethod we will choose the values that are very distant fromeach other and use them as initial values for each cluster.Clustering Algorithm: (see Figure 2) Step 4: Move the value to the nearest cluster.Step 5: Calculate the new centroid for the cluster.Step 6: Repeat steps 3 to 5Step 7: Calculate centroid of the cluster.Step 8: For each valueStep 9: Calculate the Euclidean distance between thisvalue and the centroid of all the clusters. Step 10: Move the value to the nearest cluster.K- Nearest Neighbour: The k-nearest-neighbor method wasfirst described in the early 1950s. The method is laborintensive when given large training sets, and did not gainpopularity until the 1960s when increased computing powerbecame available. It has since been widely used in the area ofpattern recognition [8].Nearest-neighbor classifiers are based on learning byanalogy, that is, by comparing a given test tuple with trainingtuples that are similar to it. The training tuples are describedby n attributes. Each tuple represents a point in an ndimensional space. In this way, all of the training tuples arestored in an n-dimensional pattern space. When given anunknown tuple, a k-nearest-neighbor classifier searches thepattern space for the k training tuples that are closest to theunknown tuple. These k training tuples are the k “nearestneighbors” of the unknown tuple.When the „k‟ closest points are obtained, the unknownsample is then assigned to the most common class amongthose k-points. In case of k 1, the unknown sample isassigned to the closest point in the pattern space. Thecloseness is measured using the distance between the twopoints. The following table defines some of the approaches tofind distances between two points.Figure 2 Clustering Algorithm Step 1: Choose the initial values using one of the abovethree methods Step 2: For each additional value Step 3: Calculate the Euclidean distance between this pointand centroid of the clusters.Among the above-mentioned distances, the most usedsimilarity/distance metric is Euclidean distance followed byManhattan. kNN features the following properties.
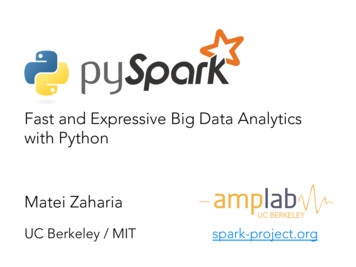
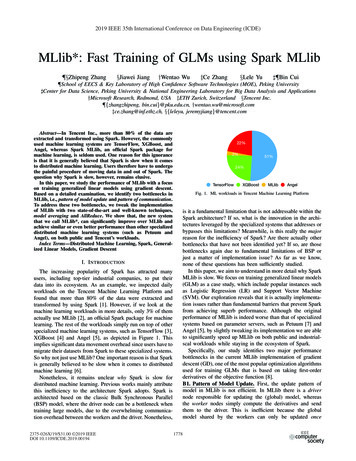
1.2.It is instance-basedIt is a Lazy Learning algorithmEager learners construct a generalization model before startingthe classification i.e., before receiving any unknown samplesfor classification. Back propagation and Decision treeinduction are examples of eager learners. In contrast to eagerlearners, Lazy learners like k-Nearest Neighbors don‟tconstruct the classifier until they receive unknown sample.They just keep storing the training sample till they receive theunknown sample. So, there is chance that Lazy Learners mayincur additional charges in terms of computation and alsomemory to store all the training samples, especially when thetraining samples to be compare the unknown sample is great.Therefore, Lazy Learner algorithms need efficient storage andindexing techniques. Since the computation in the LazyLearners is delayed till the specification of unknown samples,the classification is slower. Even though, Lazy Learnersfeature such disadvantages, they are very good at training.kNN applies equal weights to all the attributes unlike backpropagation or decision tree. This may lead to perplexity whenthere are many irrelevant attributes present in the data [8].An instance can be considered as a point in the n-dimensionalpattern space. Every feature of the instance is related to eachof the n-dimensional pattern space. The closeness is definedusing the distance measures mentioned in the table where eachof those metrics tries maximize the distance between twoextreme points or the points that lie in two different classeswhile minimize the distance between two analogous points orclosepointsthatlieinthesameclass.Recommendation Systems: The recommender systems aregrouped into two systems: content-based and collaborativefiltering. Content-based systems examine properties of theitems recommended. For instance, if a Netflix user haswatched many cowboy movies, then recommend a movieclassified in the database as having the “cowboy” genre.Collaborative filtering systems recommend items based onsimilarity measures between users and/or items. The itemsrecommended to a user are those preferred by similar users.Recommendation systems always apply knowledge discoverytechniques to provide personalize recommendations. Theamount of people accessing the web today has growntremendously and thus, dealing with such a spare data set is abig challenge for a recommender system. In traditionalrecommendation systems, which uses collaborative filteringalgorithm, the amount of work increases as the number ofusers increases. The new recommender system has beendesigned to quickly produce highly accurate recommendationsfor users on the web. There are two types of collaborativefiltering techniques which are generally used to providerecommendation: user-based collaborative filtering and itembased collaborative filtering. High level architecture ofrecommendation system is shown below.[9]Figure 3 One Recommendation Process [9]The recommendation process is performed in three steps, eachof which is handled by a separate component:Content Analyzer: When information has no structure (e.g.Geo-Location details, user preferences, social media posts),some kind of pre-processing step is needed to extractstructured relevant information. The responsibility of thecomponent is to represent the content of items (e.g. documents,Web pages, GeoLocation, product descriptions, etc.) comingfrom information sources in a form suitable for the nextprocessing steps. Data items are analyzed by feature extractiontechniques in order to shift item representation from theoriginal information space to the target one. Thisrepresentation is the input to the PROFILE LEARNER andFILTERING COMPONENT; Profile Learner: This module collects data representativeof the user preferences and attempts to generalize thisdata, in order to frame the user profile. Filtering Component: This module exploits the userprofile to suggest relevant items by matching the profilerepresentation against that of items to be recommended.III. THE SYSTERM OVERVIEWTo support system scalability, we use a holistic approachfor location-based ad recommendations. Our system leveragesthe latest open source technologies to create a big dataprocessing platform. The core recommendation engineprovides a training predictive model on a training set by usingmachine learning algorithms, such as collaborative filtering,clustering and classification.System ArchitectureAs shown in Figure 4, we designed and developed adomain-specific big data service platform for mobileadvertising and marketing. The system enables location-based
adverting to engage with its target customers by studying theirprofiles and dynamic behavior patterns. Unlike other dataanalytics engines, our system provides a holistic advertisingrecommendation approach for mobile users by providing areal-time big data based solution for precise marketing andanalysis. The current system uses the state of the art big datatechnologies, such as MongoDB and Spark over a cloudinfrastructure. The outcome of this research project consists ofthree parts: a) precise market advertising and analysisalgorithms; b) recommendation analytics algorithms; and c) aprototype system that implements the proposed algorithms andsolutions based on location-based advertising solutions.Figure 4 shows the detailed layered architecture.Figure 4 A Big Data Ad Recommendation Service System ArchitectureThe System FunctionsFigure 4 shows the following function components.1) Device Location: If the user has enabled user locationsharing on his device, he can track his location by the GeoIDassociated with his current location. The GeoID can bedivided into latitude, longitude corresponding to the zip codeof location associated with that user.2) Supporting (latitude, longitude) -- (ZipCode,Country, State, Street #): Latitude and longitude can bemapped by looking up the database. The accuracy may varydepending on the GPS signal and connection or based on theWi-Fi router accuracy.3) User Profile and Interests: The profile of the user towhom the ads are going to be served also needs to be tracked.There are various features which would be tracked such asgender, age, address, profession, interest, etc. Based on theprofile of the user as well the GeoID, the platform wouldprovide modeled recommendations to the customer on hismobile applications.4) Ad Publisher Products Item Sets: Similar to MobileUser data, the Advertiser Product data items are veryimportatnt to generate most appropriate Ads for the MobileUser. Our system design shall correlate the advertier productitems to User profile or preferences based on pre-definedsystem mapping and recommendation ourput. At minimum,our system assume an advertiser will store all the product itemattributes that enable correlation of mobile users to theproducts.(see Table 1 below).Table 1:The Product Attribute SetProduct Item Set AttributesProduct Details – include name, description, availabilityProduct Category – includes typeProduct Attributes such as color, size, modeProduct dimensionsModel NumberCustomer reviews (if any)Product ratingsProduct Cost and Manufacturing DetailsProduct & Location specifics5) n engine would develop a predictive modelbased on which the relevant advertisements would beprovided to the end user. The training dataset would be usedto create a model by applying machine learning techniquessuch as collaborative filtering, clustering and classification onthe model. A key benefit of the collaborative filteringapproach is that it does not depend upon the machine
analyzable content and hence is capable of exactlyrecommending products without priorknowledge of the itemitself.6) Customer-Oriented Requirements: The customeroriented requirements for our system generally involvesproviding qualified ad recommendations based on userpreferences, behavior ,and insights from social profile. Thesystem would track the geo location of the user and based onthe location id and location category. The location categorycould be an industrial district, university, hospital,etc. Basedon the location category associated with the user location andthe user profile, the recommendation engine would push adsto the end user. Ttable 2 below lists the related attributes.Table 2: MMobile User AttributesMobile User or Customer Attributes Summary (expandable based onthe Use Cases)Mobile User DemographicsMobile Location & Location PreferencesSocial Profile Items preferred over the internet or posting of items onTwitterMobile Application AccessMobile Commerce Data & Item Click Through DataCustomer Purchase Transaction DataKey Technologies and SolutionsSparing Streaming Architecture: Receive data streams from input sources, process themin a cluster, push out to databases/dashboards Scalable, fault-tolerant, second-scale latencies [10] Chop up data streams into batches of few seconds Spark treats each batch of data as RDDs (ResilientDistributed Datasets) and processes them using RDDoperations Processed results are pushed out in batches [11] Discretized Stream (DStream) Represents a stream of data Implemented as a sequence of RDDs MapReduce is performed on each batch for aggregation[10]We have used a number of technologies and developedseveral soultions to support our recommendation system.1) Real-time analytics based on SparkWe have developed a recommendation engine that addressesboth off-line and real-time requirements.Online processing generally involves direct interaction withone or more systems and the most current slice of data for dataprofiling to pick outliers, real-time customer engagement, realtime advertisement, etc [10]. This processing usually involvesrelatively low throughput since significant time may be spentwaiting for user input. Offline processing is typically batchoriented and often involves large volumes of data beingprocessed with little or no intervention (usually a systemoperator rather than an end user) [11].Apache Spark Streaming is an open source, big-dataprocessing system intended for distributed, real-time streamingprocessing. Streaming implements a data flow model in whichdata (time series facts) flows continuously through a topology(a network of transformation entities). The slice of data beinganalyzed at any moment in an aggregate function is specifiedby a sliding window, a concept in Complex Event Processing(CEP). A sliding window may be as low as "last minute", or"last 60 minutes", which is constantly shifting over time. Datacan be fed to Streaming through distributed messaging queueslike Flume, Twitter, ZeroMQ, Kinesis or plain old TCPsockets [12]. Size of each batch is defined as window length which isin seconds. Sliding interval is the time intervaldifference between 2 consecutive windows. [10]We have developed a recommendation engine that addressesboth off-line and real-time requirements. The recommendationengine will contain an off-line training system for producingpre-aggregation for ad recommendation to the end users. Italso will work in real-time style based on the Spark system.This real-time recommendation system will load in-streamdata as training datasets. Moreover, real-time recommendationsystem can leverage pre-aggregation results produced by offline batch mode trained machine learning models.2) GEO information integration with profile datasets.
To support location-based mobile advertsing capability, oursystem needs several fundamental profile datasets, such asgeography information for describing several aspects oflocation. There are also some other important information fortargeting and ad mapping, such as application profiles,merchant profiles (i.e. shop profiles) as well as user profiles.The ad related information is stored in MongoDB, a persistentdata repository which will be constantly updated. For theclient-side, the system is built with pure browser-basedHTML5 technologies.version of the cosine measure, the difference in scale is takeninto account.Where Ri,c is the mobile user preferred item c by user i,Ac is the average rating of user i for all the co-rated items,and Ii,j is the items set both rating by user i and user j.3) Decisions based ML algorithmsThe system provides the approaches based on both onlineas well as offline solutions is to provide ad recommendationsas a service for ad and marketing service users. Our goal indesigning the system is to support different business verticaldatasets from various business users. The solutions shouldrequire the minimum knowhow on business domainknowledge. Hence, we have selected and used the DecisionTree algorithm since it is an ideal supervised learningapproach requiring the minimum domain knowledge.The system also uses the K-means clustering approach.Figure 5 shows the procedure below.5) Similarity AnalysisFigure 5 The Procedure of K-MeansA small but important step in this system is the similarityanalysis. It takes the product items information and thecustomer information and tries to find similarity in them. Ittakes the help of association rules mining technique toidentify the patterns of the customers. As an input, this systemtakes the customer‟s profile, his interests; purchase historyrelated to advertiser or marketer product and some otherinformation based on his profile. With the help of associationrule mining, this system will try and find associations betweenthe products to be suggested and the customer and his buyinghistory, location, preference, and patterns. The figure belowexplains the methods to calculate the association and tries topredict the confidence of the customer in buying or switchingto the product.4) ClusteringWe choose the K-means algorithm that takes the number k,which specifies the desired number of clusters. To start, thealgorithm takes the first k items as the centers of our k uniqueclusters. During each iteration, each remaining item iscompared to the closest center and populates the clusters. Inthe next iterations, the cluster centers are re-computed basedon cluster centers formed in the previous pass and the clustermembership is re-evaluated. The algorithm presented below isdone for these items, in our case mobile user profile dataThe system uses the adjusted cosine measure, as followingformula, which looks at the angle between two vectors ofratings where a smaller angle is regarded as implying greatersimilarity. We normalize our data to remove noises. In thisThe system constructs a utility matrix using the utilityfunction to fetch the data about the users‟ preferences andrating for past recommended or purchased products, and usesthem to recommend a new product to someone else. Theutility function and the matrix generated from the function
looks like this. Here, the utility matrix gives a clear picture ofthe missing preferences for the items. The aim of this systemis to fill the gaps by referring the products and its attributes fitto the customer preference.6) Machine learning with high performanceAn in-memory cluster computing platform is used thatincreases performance by 100X versus traditional Hadoopdeployment. This allows our platform to load data into acluster's memory and query it repeatedly making it suitablefor different machine learning algorithms. This allows toprocess data faster, and thus helps in scaling the application.Figure 6 System Component ArchitectureSYSTEM DESIGN AND IMPLEMENTATIONThis section here discusses three items: a) system componentarchitecture design, b) system interface and connectivitydesign, and c) recommendation engine workflow.1) Fundamental data components (Profiles and GEOInfo): This location based system will need severalfundamental profile data such as geography informationfor describing several aspects of on location. There arealso some other important information for targeting andad mapping. They are application profiles, merchantprofiles (shop profiles) and user profile. When all data inthe location (GEO ID) matches to each other‟s, we willhave good ads or some good candidates in the ad space ofuser. Then following some business strategies they willbe prioritized.All these information is stored inMongoDB, they will be kept refreshing.2) Other data components: There are a few other datacomponents that are also important for this system. Theyare recommendations and result for pushing ads to endusers. Ads and profile analysis for customer review.These will be stored in MongoDB.Recommendations and Click-through rate (CTR) historyare improving recommendation machine learning models.Output files are from off-line batch mode recommendationsystem based on Hadoop. There are also several trainingdatasets in the HDFS. Loading Balancer: In order to support incremental andspike workloads, our system shall support load balancing. Analytics/Recommendation Engine: We provide a realtime processing ad recommendation engine. Thisrecommendation engine will involve an off-line trainingsystem for producing pre-aggregation for adrecommendation to the end users. It also will work in thereal-time processing Spark system.This real-time recommendation system will
service framework supporting mobile advertising based on multi-dimension big data analytics. In this approach, we focus on location-based mobile advertising using by analyzing the big data including mobile user profiling, mobile app usage patterns, location-based mobile user access patterns, as well as merchant related data.