Transcription
Measure 4.5: Graduation Rates and Program ProgressionData from this report are drawn from three sources, the EKU Graduation Report 2020, the Kentucky Center for Education and WorkforceStatistics (KCEWS, now KY-STATS) Teacher Preparation Feedback Report 2018, and the EKU COE Degrees Awarded Report 2020. Each data sourceprovides insight into program progress and completion for candidates in teacher preparation. Since many teacher preparation programs aredesigned to lead to certification and do not lead to the awarding of a degree, it is appropriate to examine data related to graduation, retention,and program completion in order to gain a complete understanding of program progression.College of Education (COE) Teaching Licensure Programs Graduation Rate Compared to All University (Non-COE) Teaching Licensure ProgramsGraduation Rate. Graduation rates for initial program completers are extracted from data collected and disseminated by EKU’s Office ofInstitutional Effectiveness in the College/Department Metric Dashboard and are available egedepartment/. It should be noted that the EPP has been working toward a process that willallow disaggregation of graduation rate data by programs that lead to initial licensure, however it has not reached that goal at this time. Themajority of preparation programs that prepare teachers for single subject P-12, 7-12, or 9-12 certifications as well as IECE (B-K) lie outside theCollege of Education and are concentrations within content degree majors. At this time, the institution’s dashboard is set up to filter to only themajor program level, not the concentration level. Therefore, for those programs leading to certification that are concentrations in the degree,the data cannot be disaggregated. For example, Music Education, which is the largest P-12 program, is a concentration under the Bachelor ofMusic degree and is reflected in the BM in Music graduation rates, but not distinguishable from the non-teaching majors in that program.Further, only undergraduate graduation rates are tracked by Institutional Effectiveness in this way. This is due in part to the varying times tocompletion typical for graduate degree seekers who are often employed. The data reported below in Table 4.5.1 and 4.5.2 were obtained bybeginning with the filters at the top of the dashboard, selecting all from the Level filter, selecting College of Education from the drop-downCollege field then selecting only initial licensure programs in EKU College of Education in the Program field. Initial licensure programs include: BSin Elementary Education (P-5), BS in Middle Grade Education, BS in Deaf/HH (P-12) El Teaching, BS in Deaf/HH (P-12) MG Teaching, BS inD/HH/HH (P-12) El Teaching, BS in Special Education, BS in Special Education/LBD P-12, BS in Deaf/Hard of Hearing Education, BS in Special EdTeaching, and BS in Early Childhood Special Education. At the Graduation Rate graph filter, selecting EKU and 4 Year from secondary filters toobtain the COE 4 Year graduation rate. The same process was repeated for the 6 Year Graduation Rate respectively.The data for the graduation rates of the educator preparation programs outside of COE benchmark were obtained by selecting the filtersthe EKU College/Department Metric Dashboard, then selecting all from the level filter, unselecting College of Education and Graduate Schoolfrom the drop-down College field, then selecting the following educator preparation programs that lie outside of EKU College of Education suchas, BS in Career & Tech Ed Teaching, BS in Business & Marketing Teaching, BA in English Teaching, BA in History Teaching, BA in French Teaching,BA in Spanish Teaching, BS in Family & Consumer Science Teaching, BS in Health Education, BS in Biology Teaching, BS in Earth Science Teaching,BS in Mathematics Teaching, and BS in Physics Teaching. At the Graduation Rate graph filters, selecting EKU and 4 Year from secondary filters toobtain the 4 Year graduation rate. The same process was repeated for the 6 Year Graduation Rate respectively. Please note that not allcertifications programs can be disaggregated, as noted above.
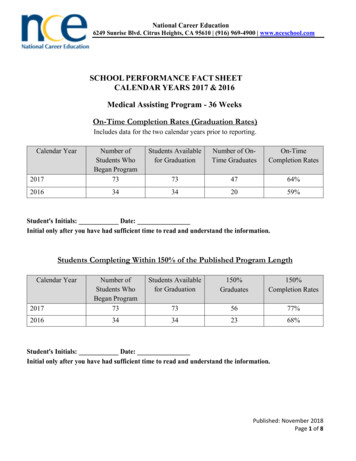
Aggregate initial College of Education graduation data in this report are conveyed two ways: first a comparison of initial educationpreparation programs only in the College of Education to initial education preparation programs outside of the College of Education ispresented; second a comparison of College of Education initial teaching program graduation rates compared to the graduation rates of all otherEKU programs outside the College of Education is shown. Data comparing College of Education initial teaching licensure programs (educatorpreparation) to initial teaching licensure programs that lie outside of the College of Education are displayed by 4-year and 6-year graduationrates for only initial graduates because all advanced education preparation programs for which data can be disaggregated lie inside the Collegeof Education. The Aggregate College of Education initial teaching licensure program graduation rates compared to the initial teaching licensureprograms outside the College of Education data are found in Table 4.5.1 below. The Disaggregated initial teaching licensure program data aredisplayed below in Table 4.5.2.Table 4.5.1 shows that the aggregate College of Education initial teaching licensure programs’ 4-year graduation rates significantly exceedthe graduation rates in 6 out of 8 cohort years with 2012 falling just 4% lower and 2014 falling 6% lower than the initial teaching licensureprograms that lie outside of the College of Education. The College of Education 6-year graduation rates significantly exceed the Non-College ofEducation initial teacher licensure program graduation rates in 5 out of 6 cohort years with 2009 only falling 1% lower the programs outside ofthe College of Education. The College of Education data are indicated by the gold bars while the data from programs outside of the College ofEducation are represented by the dark red bars.Table 4.5.1 Aggregate College of Education Teaching Licensure vs. All Other EKU Colleges Teaching Licensure 4 and 6-Year Initial Graduation RatesAGGREGATE 4 YEAR INITIAL GRADUATION RATESAGGREGATE 6 YEAR INITIAL GRADUATION RATESThe disaggregated data for the College of Education initial teaching licensure program and the initial teaching licensure programs outside ofthe College of Education 4-year and 6-year graduation rates in Table 4.5.2 below show that the 6-year graduates had a higher rate in all cohort
years both inside and outside of the College of Education. Data gaps in the table represent areas where initial licensure programs werereorganized, combined or did not have candidates. It should also be noted that many secondary and P-12 program have very low Ns, whichimpacts the graduation rate.Table 4.5.2: Disaggregated COE vs. Non-COE Teaching Licensure Programs of 4-Year and 6-Year Initial Graduation Rates4 YEAR INITIAL GRADUATION RATESFall 20096 YEAR INITIAL GRADUATION RATESFall 2010Fall 2011Fall 2012Fall 2013Fall 2014COE INITIAL PROGRAMFall 2009Fall 2010Fall 2011Fall 2012Fall 2013Fall 2014Fall 2015Fall 2016BS in Elementary Educ (P-5)28%34%35%29%42%33%35%48%50%54%67%56%68%58%BS in Middle Grade 100%50%BS in Deaf/HH (P-12) El Teach0%100%25%BS in Deaf/HH (P-12) MG Teach0%0%-0-BS in D/HH/HH (P-12) El Teach0%0%0%*********************************BS in Special Education0%0%20%0%BS in Spec ED/LBD P-1227%56%22%BS in Deaf/Hard of Hearing Ed40%43%33%20%67%43%52%56%BS in Special Ed Teaching14%29%36%31%30%-0-50%60%BS in Early Childhood SP ED-0-0%0%18%67%49%58%63%54%66%57%TOTALNON-COE Fall 2009Fall 2010Fall 2011Fall 2012Fall 2013Fall 2014Fall 2015Fall 2016Fall 2009Fall 2010Fall 2011Fall 2012Fall 2013Fall 201450%50%50%50%100%33%100%50%0%50%33%67%0%0%33%BS in Career & Tech Ed Teach50%50%17%50%50%BS in Bus & Marketing Teaching0%0%0%0%33%BA in English A in History A in French Teaching0%50%0%0%0%-0--0-0%100%-0-0%100%0%BA in Spanish Teaching0%0%33%0%0%50%100%50%0%50%50%0%50%50%BS in Fam & Cons Sci BS in Health --0-50%-0-BS in Biology Teaching20%0%40%-0-0%50%33%0%20%33%40%-0-100%50%BS in Earth Science BS in Mathematics BS in Physics Teaching0%-0-100%0%-0--0-100%-0-0%-0-100%0%-0--0-
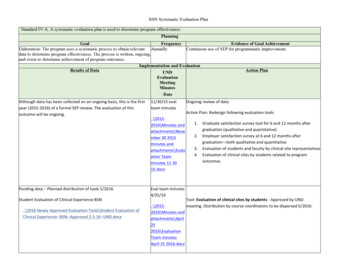
TOTAL22%27%25%32%29%39%31%43%50%45%43%49%51%56%* Moved to BS in Deaf/Hard of Hearing Ed** Moved to BS in Special Ed Teaching-0- No CandidatesCollege of Education (COE) Programs Graduation Rate Compared to All University (Non-COE) Programs Graduation Rate. Data comparingCollege of Education to All EKU programs are also displayed by 4-year and 6-year graduation rates as well as initial graduates and advancedgraduates. The 4-year and 6-year data comparing COE graduation rates to all EKU graduation programs for initial graduates reported below inTable 4.5.3 were obtained from the EKU College/Department Metric Dashboard. This data was extracted from the dashboard by beginning withthe filters at the top of the dashboard, selecting all from the level filter, selecting College of Education from the drop-down College field thenselecting only initial licensure programs in EKU College of Education. Initial licensure programs include: BS in Elementary Education (P-5), BS inMiddle Grade Education, BS in Deaf/HH (P-12) El Teaching, BS in Deaf/HH (P-12) MG Teaching, BS in D/HH/HH (P-12) El Teaching, BS in SpecialEducation, BS in Special Education/LBD P-12, BS in Deaf/Hard of Hearing Education, BS in Special Ed Teaching, and BS in Early Childhood SpecialEducation. At the Graduation Rate graph filter, selecting EKU and 4 Year from secondary filters to obtain the COE 4 Year graduation rate. Thesame process was repeated for the 6 Year Graduation Rate respectively.Initial Completer Graduation Rates. Table 4.5.3 below illustrates a comparison between the aggregate graduation rates of initial undergraduatecandidates in the College of Education and undergraduate students in all other colleges at Eastern Kentucky University over a 4-year, and 6-yearperiod. In all cases except for the 2015 cohort 4-year rate, the College of Education demonstrated higher graduation rates than all other collegescombined. The 4-year graduation rate for the 2015 cohort for the College of Education (32%) was comparable to the graduation rate for all othercolleges combined at EKU (34%). It is worth noting that the 4-year COE graduation rate significantly increased from 32% in 2015 to 47% in 2016.Graduation rates for the 6-year program completers also exceed the graduation rates for all other EKU programs combined ranging from 4% to17%. EKU College of Education consistently has higher graduation rates for 6-year initial completers by an average of 8% overall.
Table 4.5.3 College of Education vs. All Other EKU Colleges 4 and 6-Year Initial Aggregate Graduation RatesAGGREGATE INITIAL PROGRAM COMPLETERS 4 YEAR GRADUATION RATESAGGREGATE INITIAL PROGRAM COMPLETERS 6 YEAR GRADUATION RATES
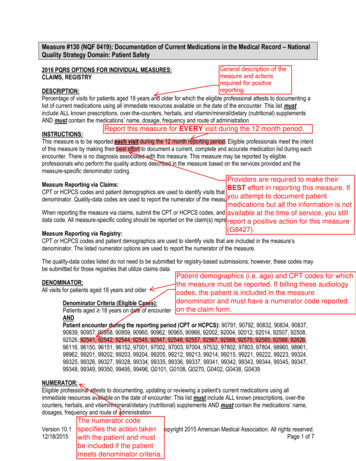
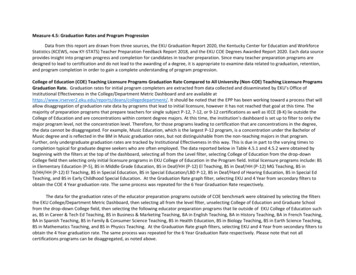
Initial Master of Arts Program and MAED Communication Disorders Licensure Acquired as Graduates. Data for the MAT and MAEDCommunication Disorders programs are unique in that they are initial programs acquired at the graduate level. These data were also found inthe EKU College/Department Metric Dashboard by beginning with the filters at the top of the dashboard, selecting “All” from the level filter,selecting College of Education and Graduate School from the drop-down College field then selecting all MAT programs: MAT in SecondaryEducation, MAT in Middle Grade Education, MAT in Interdisciplinary Early Childhood Education, MAT in Elementary Education, MAT in TeacherEducation and MAED Communication Disorders. When comparing the graduation rates of MAT and MAED Communication Disorder Programsin the College of Education to all initial teaching licensure that lie outside of the College of Education, it is evident that the COE MAT and MAEDCommunication Disorder completers graduate at rates much higher than teaching licensure programs outside of the COE.Table 4.5.4 Graduation Rates of COE Initial Licensure Programs at Graduate LevelAGGREGATE 4 YEAR INITIAL GRADUATION RATESAGGREGATE 6 YEAR INITIAL GRADUATION RATESAdvanced Program Completers Graduation Rates. The data for advanced program completers reported below in Table 4.5.5 were obtainedfrom the EKU College/Department Metric Dashboard by beginning with the filters at the top of the dashboard, selecting only GR (GraduateProgram) from the level filter, selecting College of Education from the drop-down College field then selecting only advanced licensure programsin EKU College of Education graduate program. The advanced licensure programs include: MAED in School Counseling, MAED in ElementaryEducation, MAED in Gifted Education, MAED in Middle Grade Education, MAED in Reading/Writing Education, MAED in Secondary Education,MAED in Library Science K-12, and EdS in Educational Administration & Supervision, MAED in Instructional Leadership, MAED in SpecialEducation, MAED in Literacy P-12, MAED in School Media Librarian,. At the Graduation Rate graph filters, selecting EKU and 4 Year fromsecondary filters to obtain the COE 4 Year graduation rate. The only advanced educator preparation program outside the College of Education isthe CTE Principal program, which is a concentration under the MS in CTE, therefore data on that program cannot be disaggregated as notedabove. Therefore, comparisons cannot be made to advanced programs outside the COE.
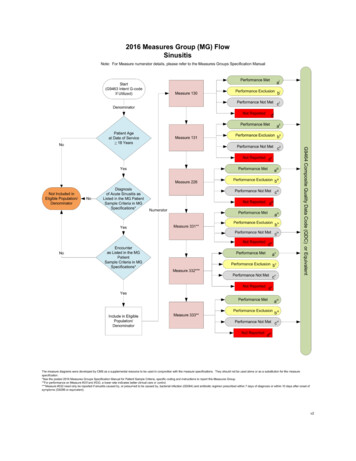
The data is Table 4.5.5 show the graduation rate trends from 2009 to 2016 for 4-year program completers. The data show growth trends asinconsistent over the 8 years shown, with graduation rates dropping in 2012. Since 2012 the graduation rate for 4-year completers has revealedimproved performance with 74% in 2016 consistent with the 74% in 2009.Table 4.5.5 College of Education 4 -Year Advanced Graduation RatesAGGREGRATE ADVANCED PROGRAM COMPLETERS 4 YEAR GRADUATION RATESTeacher Preparation Program Progress. Data reported in the next section are taken from the KY-STATS (formerly KCEWS) Teacher PreparationFeedback Report 2019, the most current version of the report. The report can be found on KY-STATS’ website athttps://kcews.ky.gov/Latest/TPPFR. Parameters for the data presented in Table 4.5.6 below were “Eastern Kentucky University” for theInstitution field, “Initial Undergraduate” for the Program field, and “All” for the Cohort field. Data show the breakdown of undergraduate initialprogram candidate progress over a 3-year period. The 2015 -2017 cohorts show a consistent percentage of undergraduate initial program
completers within 3 years (after admission to professional education). Of the 2015 cohort 55% completed within 3 years while 46% of the 2016cohort completed. The completion rate of the 2017 cohort surged to 69%. Also noted is the comparison between EKU and All Universities inKentucky which shows EKU’s completion rate ranging between 11% - 23% lower than all universities combined. While the completion rates maybe lower, the growth rate from 2015-2017 is higher for EKU. All Kentucky universities only showed a 2% gain over 3 years, EKU showed a 14%gain over the same 3 years. Program exits showed a significant increase for the 2016 cohort. Data indicate that candidates continuing andcompleting programs within the 3 years are steady for the 2015 and 2017 cohorts with the 2016 cohort having the highest percentages ofprogram exits. For the 2015 and 2016 cohorts, candidates continuing after year three remained fairly stable at around 30% while 2017 showed adecline at 15%.The EPP saw its largest program, elementary education, undergo revision in 2013 and again in 2017 which reduced additional courseworkin particular specialized courses and overall hours required. Additionally, candidates’ admission to professional education in that programtypically occurs during their first year, rather than at the end of their second year, which was typical for the prior program. The EPP recognizesthat these candidates will see higher percentages continuing into year four as a result, however, it is also expected that the percentagegraduating in four years will also increase. Also notable is the steady decline of undergraduate candidates entering professional education ineach successive cohort year. The 2017 cohort was the smallest cohort with only 170 candidates admitted to the undergraduate initialprofessional education program in that cohort year. Overall, declining enrollment in educator preparation programs at the initial level is anotable trend experienced by programs nationwide.
Table 4.5.6 EKU vs. All Universities Undergraduate Initial Teacher Preparation Program Progress 2015 – 2017 CohortsCandidate Progression for All UniversitiesCandidate Progression for Eastern Kentucky UniversityInitial Graduate Program Completers. Table 4.5.7 below shows program progress data for initial programs at the graduate level for the sameperiod. Parameters for the data presented in Table 4.5.7 below were “Eastern Kentucky University” for the Institution field, “Initial Graduate” forthe Program field, and “All” for the Cohort field. The opposite trend is reflected for the initial program candidates admitted in the same threecohort years as the initial undergraduate candidates discussed above with the numbers admitted only changed slightly dipping in the 2016cohort. From the 2015 cohort to the 2017 cohort only 1 less candidate was admitted into the teacher preparation program. While theseadmission numbers were not declining steadily, program completions steadily declined by 12% from 68% in 2015 to 56% in 2017. Whencomparing the graduate completers at EKU to the graduate completers in all Kentucky universities, EKU excelled by showing significantly highercompletion rates for all 3 cohorts: 14% higher that all KY universities in 2015, 12% higher in 2016, and 15% higher in 2017. At the same time,EKU showed lower exit rates than all KY universities, 10% lower in 2015, 5% lower in 2016, and 3% lower in 2017.
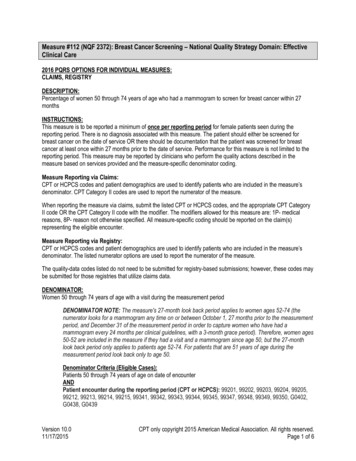
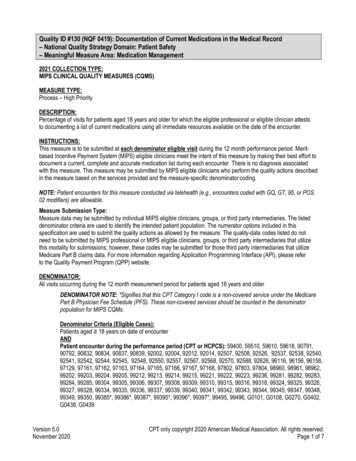
Table 4.5.7 EKU Graduate Initial Teacher Preparation Program Progress 2015 – 2017 CohortsCandidate Progression for All UniversitiesCandidate Progression for Eastern Kentucky UniversityParameters for the data presented in Figure 4.5.8 below were “Eastern Kentucky University” for the Institution field, “Initial Undergraduate” forthe Program field, and each cohort year for the Entrance Year field. The parameters were repeated for All Universities in KY. The percentagedata was added to each circle graph to convert the number of candidates who exit program to percent. Focusing on the dropout rate, thepercent calculation presented the data in a new perspective. It is interesting to note that the number of candidates who dropped out haveconsistently declined over the past 3 years. When compared to the program exit rate of all KY universities, once again, EKU shows significantlylower dropout rates between 7% in 2015 to 41% lower in 2016.
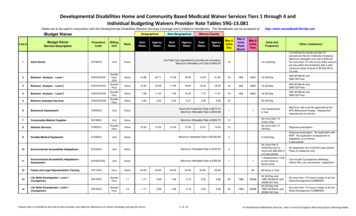
Figure 4.5.8 EKU vs. All Universities Undergraduate Initial Teacher Preparation Program Progress 2015 – 2017 CohortsProgram Exit Reasons201557%Program Exit Reasons201550%ALL KENTUCKY UNIVERSITIES - UNDERGRADUATEProgram Exit Reasons201652%EASTERN KENTUCKY UNIVERSITY - UNDERGRADUATEProgram Exit Reasons201611%Program Exit Reasons201750%Program Exit Reasons201721%Parameters for the data presented in Figure 4.5.9 below were “Eastern Kentucky University” for the Institution field, “Initial Graduate” forthe Program field, and each cohort year for the Entrance Year field. The same parameters were repeated for All Universities in Ky. In each cohortyear the highest percentage of EKU candidates who exited the program transferred to a different program or college, while the number whodropped out remained low at or below the dropout rate for all KY universities.
Figure 4.5.9 EKU Graduate Initial Teacher Preparation Program Progress 2015 – 2017 CohortsProgram Exit Reasons201523%Program Exit Reasons201519%ALL KENTUCKY UNIVERSITIES - GRADUATEProgram Exit Reasons201618%EASTERN KENTUCKY UNIVERSITY - GRADUATEProgram Exit Reasons201610%Program Exit Reasons201714%Program Exit Reasons201714%
The 4-year and 6-year data comparing COE graduation rates to all EKU graduation programs for initial graduates reported below in Table 4.5.3 were obtained from the EKU College/Department Metric Dashboard. This data was extracted from the dashboard by beginning with .