Transcription
Improving Graduation Ratesat Portland Public SchoolsA report by the District Performance AuditorJune 2013PORTLAND PUBLIC SCHOOLSPORTLAND, OREGON
PORTLAND PUBLIC SCHOOLS501 North Dixon Street / Portland, OR 97227Email: rctracy@pps.k12.or.usRichard C. TracyTelephone: (503) 916-3258District Performance AuditorMEMORANDUMTo:Board of EducationFrom:Richard C. Tracy, District Performance AuditorDate:June 2013Re:Improving Graduation Rates - Performance AuditAttached is my audit report on Improving Graduation Rates at the Portland Public Schooldistrict. I performed this audit in response to the 2012-13 Performance Audit Planapproved by the School Board.I would like to thank the District management and staff for their assistance andcooperation in conducting this audit.I look forward to meeting with you at upcoming Board meetings to more fully discuss thereport’s findings and recommendations. Thank you for your ongoing support ofperformance auditing.cc:Carole SmithJollee Patterson
ContentsSUMMARY . 1INTRODUCTION . 3National and State focus on improving graduation rates and reducing dropoutsResearch findings: Why students drop out and fail to graduatePPS High School System Design: Comprehensive approach to improvementAudit objectives, scope, and methodsAUDIT RESULTS. 13Other large Oregon school districts outperform PortlandCase studies: Learning from other districtsPPS support services and interventions mirror many other districtsWhat works: Exemplary programs and practicesNeed for additional informationRECOMMENDATIONS . 43MANAGEMENT RESPONSE TO THE AUDIT . 45APPENDICESA. Literature and research on improving graduation rates .A-1B. Explanation of the High School Cohort Graduation and Dropout Rates .B-1
SUMMARYAcentral focus of national and state school improvement efforts is the drive to increasehigh school graduation rates and to reduce dropouts. Research shows that highschool dropouts are much more likely to be unemployed, living in poverty, andreceiving public assistance. Failing to complete high school not only imperils the future ofindividuals but also impacts the community through the loss of productive workers and highercosts for health and social services.Over the past five years, the Portland Public School district has pursued a number ofstrategies to improve student outcomes and bring more equity and stability to Portland’s highschools. These efforts culminated in the School Board approval of a comprehensive reformprocess called the High School System Design (HSSD) in October 2010. A December 2012status report on the implementation of the HSSD shows that the district may be seeing resultsfrom the reform effort. Overall graduation rates have improved from 53 percent to 63 percentand the graduation gap between white and Hispanic student dropped from 30 points to 19points. In addition, while there has been little progress in reducing the percent of at-riskstudents entering 9th grade, 62 percent of 10th graders are now on track to graduate comparedto 51 percent in 2008-09.To further accelerate improvement, the Superintendent established a High School ActionTeam in early 2013 to propose additional changes in educational practice. This report providesadditional information to assist decision makers in improving graduation rates and reducingdropouts. It compares PPS to other school districts in order to identify promising practices thatmight be useful to PPS in their quest to improve graduation rates and reduce the achievementgap.The major findings of the audit are as follows: PPS is improving but lags behind other large Oregon districts in on-time graduationand dropout levels. Although PPS increased graduation rates by 10 points andlowered dropout rates by 4 points over the past four years, PPS ranks last ingraduation rates and 7th in dropout rates when compared to the ten largest Oregonschool districts.Improving Graduation Rates 1 June 2013
Several large Oregon districts with similar demographics and special populations areable to achieve better performance than PPS. Hillsboro School District and SalemKeizer School District perform significantly better with special population groups withsimilar levels of disadvantaged and underserved ethnic populations. BeavertonSchool District has also performed better than PPS in increasing grad rates forstudents with limited English proficiency. School districts in Oregon and other states have implemented new practices thathave contributed to significant improvements in graduation rates. Common practicesinclude use of early warning systems to identify high risk students, special teams thatprovide support to at-risk students and to dropouts, and strong management andaccountability models to ensure better alignment and more consistentimplementation of interventions. Portland appears to pursue many of the same strategies that other districts use toimprove graduation rates and reduce dropouts. PPS has developed information onacademic priority students, implemented 9th grade academies, and provided varioussupport services to help students regain credits and improve assessment scores. Inaddition, PPS provides a wide array of alternative school options. Some exemplary practices found to have a significant impact on graduation anddropout rates may also hold promise for Portland. For example, districts haveimproved graduation rates through expanded use of mentors and after-schoolprograms, stronger attendance monitoring and follow-up systems, and more focus onmiddle-school students.To ensure recent gains in graduation rates at PPS are maintained and improved, thedistrict should continue existing reform efforts and consider the feasibility of other promisingpractices identified in this report. In addition, the district could benefit from understanding howwell existing practices work, what practices students say works best for them, and howconsistently established practices are implemented throughout the district.Improving Graduation Rates 2 June 2013
INTRODUCTIONImproving graduation rates and reducing dropouts are major goals at Portland PublicSchools and in school districts around the nation. Portland and other districts arepursuing a variety of approaches to help students prepare for high school, career, andfuture schooling. This report compares PPS to nine other large districts in Oregon and offerscase studies on districts that are achieving higher graduation rates and fewer dropouts. Inaddition, the report discusses exemplary practices from around the country that have had apositive impact on students staying in school and graduating. The case studies and exemplarypractices are intended to help the district make decisions as it implements high schoolimprovements and strives to meet PPS Milestones and the State of Oregon 40-40-20 goalswhich call for 100 percent high school completion by 2025.National and State focus on improving graduation rates and reducingdropoutsBoth the federal and state government are pursuing initiatives to increase high schoolgraduation rates and to reduce dropouts. Through the US Department of Education,the federal government is funding interventions in low performing high schools aroundthe country designed to improve achievement and transform school culture. The governmentis investing in innovative dropout recovery and prevention strategies to better engage youth intheir learning and to help them catch-up academically. In addition, a college pathwaysprogram provides support to states to help increase access to college-level, dual credit, andother accelerated coursed in high-schools with high-need populations. Speaking at aGradNation event in 2010 President Obama said:“It’s time for all of us to come together – parents and students, principals andteachers, business leaders and elected officials – to end America’s dropout crisis.”Federal regulations in 2008 required states to begin collecting data on high schoolgraduation rates in a common and standardized manner that would allow meaningfulcomparisons among schools and districts around the country. The new measure – an adjustedfour-year cohort graduation rate – provides more uniformity and transparency in reporting highschool graduation rates, increases accountability, and helps districts develop strategies toreduce dropouts and increase graduation rates. In 2012, the federal U.S. Department ofImproving Graduation Rates 3 June 2013
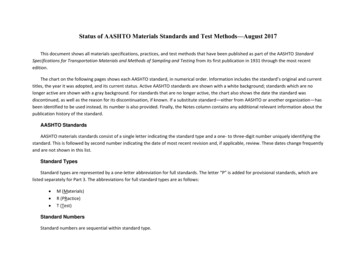
Education released data on state four-year graduation rates for 2010-11 – the first year forwhich all states used and common, rigorous new measure. Figure 1 below present theprovisional data on state graduation rates. As shown, the state of Oregon had a four-year2011-12 cohort graduation rate of 68 percent, lower than most other states in the nation. SeeAppendix A for an explanation of the high school cohort graduation rate indicator.In 2011, the Oregon State Legislature in response to adverse trends in high schoolgraduation rates and educational degree attainment, passed legislation to dramaticallyincrease school completion rates and to establish a unified educational system for students inpre-school through graduate school that would dramatically improve educational outcomes inOregon. The plan, termed the 40-40-20 Plan, calls by 2025 for 40 percent of adult Oregonianto complete a bachelor’s degree or higher, 40 percent earning a associates degree orpostsecondary credential, and the remaining 20 percent or fewer to earn a high schooldiploma or its equivalent. In order to achieve these goals the state is investing in education invarious ways to improve early reading, provide more professional development to teachersand administrators, connect more students to work through more focus on math, technology,and science, and increase supports to help students earn a diploma and have access to postsecondary employment.In order to measure how well Oregon is doing in graduating students, the state tracks fourand five year high school graduation rates and four and five year completer rates. Graduationrates measure the number of students who receive a high school diploma within four or fiveyears, the completer rate counts students who also receive a GED (General EquivalencyDiploma also known as a General Education Diploma), a Modified Diploma, or Adult HighSchool diploma.In addition, in response to receiving a waiver from some of the requirements of the federalNo Child Left Behind legislation, the State of Oregon has established a new accountabilitysystem for Oregon school districts. One feature of this accountability model is achievementcompacts between the state and school districts. The achievement compacts are agreementsbetween the state and school districts that defines key measures of success and sets targetsfor achievement – graduation rate is one of the key measures of success established by theachievement compacts. The Portland Public Schools established achievement compactmeasures in 2012 with a graduation rate goal of 68 percent by 2014-15 and 100% by 2025.Improving Graduation Rates 4 June 2013
Figure 1Adjusted Cohort Graduation Rates: All States by Student DemographicCategories, School Year 2010-11Improving Graduation Rates 5 June 2013
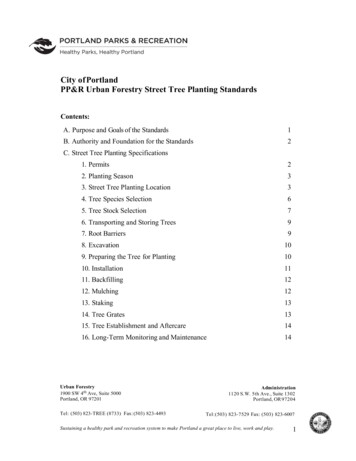
Research findings: Why students drop out and fail to graduateAvariety of factors influence the decision to drop out. A comprehensive meta-evaluationof the literature by the National Dropout Prevention Center at Clemson Universityidentified those factors that significantly increase the likelihood of students droppingout of school. While no single factor can accurately predict who will drop out, the accuracy ofpredictions increases when multiple risk factors are considered. In addition, the studyindicated that dropping out is a process that compounds over time and the process ofdisengagement may begin before a child enters school. The study found 21 factors associatedwith individual students and their families that had a statistically significant impact on studentsleaving school early. The table below lists those significant factors.As shown, some factors are more significant in middle school while other factors aresignificant in high school. For some risk factors, the study found significance in all three gradelevels. Specifically, the risk of dropping out was most significant for all three grade levels forthe following factors: School performance — low achievement, over-age for grade School engagement — poor attendance Family background — low socio-economic backgroundAs shown in the table other significant factors included early adult responsibilities, high riskpeer groups or social behavior, low expectations, student misbehavior, high family mobility, noextracurricular participation, and low family contact with schools.In addition, research from the Consortium on Chicago School Research, the Center for theSocial Organization of Schools at John Hopkins University, and the Philadelphia EducationFund identified three key factors that are highly predictive of students dropping out of school.These factors termed “the ABC’s” are as follows: Attendance – Missing 20 days or being absent 10 percent of the time Behavior – Two or more mild or more serious behavior infractions Course performance – An inability to read at grade level by the end of third grade;failure in English or math in sixth through ninth grade; a GPA of less than 2.0; twoor more course failures in ninth grade; and failure to earn on-time promotion totenth grade.Improving Graduation Rates 6 June 2013
Figure 2Significant risk factors by school level according to a study by the NationalDropout Prevention CenterINDIVIDUAL BACKGROUND CHARACTERISTICSELEMENTARYDisability or emotional disturbanceMIDDLEHIGH Early adult responsibilitiesHigh work hoursParenthood Social attitudes, values, behaviorHigh risk peer group High risk social behavior Highly socially active outside school School performanceLow achievement Retention/overage for grade Low educational expectations Lack of effort Low commitment No extracurricular participation School engagementPoor attendanceSchool behaviorMisbehavior Early aggression Family background characteristicsLow socioeconomic statusHigh family mobility Low educational level of parents Not living with both natural parents Family disruption Family engagement/commitment to educationSibling dropped out Low contact with school Lack of conversations about school risk factors significant in one studySource: risk factor significant in two or more studies2007 National Dropout Prevention Center at Clemson University and Communities in School, Inc.Improving Graduation Rates 7 June 2013
Another report issued in 2006 by Civic Enterprises in association with Peter D. HartResearch Associates and the Bill and Melinda Gates Foundation asked for the perceptions ofstudents who had dropped out of school. The study conducted four focus groups of 467students who had dropped out of public high school. These students were ethnically andracially diverse, 16 to 24 years old, and from 25 different locations with high dropout rates,including large cities, suburbs, and small towns. The following are the five major reasonsstudents said they dropped out and the percentage of students that identified the factor:1. Classes were not interesting — 47%2. Missed too many days and could not catch up — 43%3. Spent time with people who were not interested in school — 42%4. Had too much freedom and not enough rules in my life — 38%5. Was failing in school — 35%In addition, a high percentage of students indicated they left school because some real lifeevents got in the way of school — 32 percent left to get a job, 26 percent became a parent, and22 percent had to help their family.Most of the dropouts in the focus group (51%) believed that they were responsible fordropping out of school, followed by 26 percent that said they and the school were equallyresponsible and 22 percent that said the school was responsible. The focus group dropoutsalso believed that several things could improve the chances of staying in school:1. Opportunities for real world learning to make the classroom more relevant(internships, service learning, etc.) — 81%2. Better teachers who keep classes interesting — 81%3. Smaller classes with more individual instruction — 75%4. Better communication between parents and school, get parents more involved — 71%5. Parents make sure kids go to school every day — 71%6. Increase supervision in school: ensure students attend classes — 70%Improving Graduation Rates 8 June 2013
PPS High School System Design: Comprehensive approach toimprovementSince 2008, the Portland Public School district has been working to improve graduationrates and to bring greater equity to Portland’s high school system. A major catalyst inthis effort was the 2007 study by the Portland School Foundation (now called AllHands Raised) that found that only 54 percent of students that entered high school in 9th gradegraduated on time. In response to this study and other information on racial and economicinequities in the Portland high school system, the Portland School Board in 2010 resolved todevelop a new framework for high schools that would bring better and more equitable resultsto all students. The Board directed the Superintendent to develop a plan to accomplish betteroutcomes by expanding access to rigorous courses, programs, and options, and by providingmore personal supports to students to help them succeed.In response to this direction, the Superintendent proposed a “High School Action Plan” thatproposed significant changes to the way that high school education was organized, structured,and delivered. The Board passed several resolutions in 2010 approving the recommendationsof the Superintendent to reform the high school system in Portland Public Schools. The HighSchool System Design (HSSD) approved by the board is a comprehensive approach thatinvolves developing a core academic program, establishing neighborhood and focus highschools in specific areas with new boundaries, closing some small schools, and creating newprograms and special supports for students. The Board also established a set of performancetargets for the 2014-15 school year when HSSD changes will be completely implemented foran entire cohort of high school students graduating in 2015. The HSSD performanceindicators are listed below.Improving Graduation Rates 9 June 2013
Figure 3High School System Design performance indicatorsINDICATORBASELINE (2008-09)TARGET (2014-15)Graduation rates53% (4-year cohort)10 point increase (63%)Reduce largest gap in grad rates30 points between white andHispanicReduce by 10 points10 graders on track to graduate51% on track10 point increase (61%)College readiness25% of students ready forcollege10 point increase (35%)High school readiness30% of 9 graders are at riskReduce percent by 10 pointsSystem-wide capture rate81% of students attend publicschool85% attend public schoolCore academics at all schoolsNo school offering core100% core program in placeSupports for struggling students4 of 10 schools not offeringAll schools offer supportsStudents taking AP/IB classes58% of juniors/seniors takingAP/IBIncrease by 10%Decrease enrollment disparity1,200 student enrollmentdisparityReduce disparity by 375Focus schools in demandn.a.Enrollment targets forBenson and JeffersonEffective implementation of focusschools and programsOnly two schools have programs(no middle college program)All schools have programs(middle college in Jefferson)Financial effectiveness13.24 FTE supplement smallerschoolsFTE allotments neutralththA status reported on the implementation of the High School System Design waspresented to the Board in December of 2012. The report found that after one year ofimplementation the district was on track to meet — or was already meeting — 9 of 12performance indicators established by the Board. Most importantly, high school graduationrate had increased by 9 points, from 53 percent in 2009 to 62 percent in 2011. In addition, 90percent of the core academic programs were in place in all comprehensive high schools, theenrollment disparity between comprehensive high schools was 40 percent less, and PortlandPublic Schools continues to attract a high percentage of school age students. The report alsoImproving Graduation Rates 10 June 2013
noted that while the HSSD structural changes had increased equitable access to high schoolsand rigorous programs, more needed to be done to accelerate graduation rate gains and toclose the achievement gap.Improving Graduation Rates 11 June 2013
Audit objectives, scope, and methodsThe objective of this audit was to compare Portland Public Schools to other schooldistricts in Oregon and in other states to identify promising practices that couldcontribute to helping PPS increase graduation rates and reduce dropouts. In addition,I identified exemplary programs in various programs around the country that have haddemonstrable impact on student graduation success that might offer opportunities forreplication in Portland.To address these objectives, I interviewed PPS officials and managers, and collected datafrom the nine other large high school districts in Oregon — Beaverton, Bend-LaPine, Eugene,Gresham-Barlow, Hillsboro, Medford, North Clackamas, Salem-Keizer, and Tigard-Tualatin. Inaddition, I interviewed several officials from Hillsboro, Salem-Keizer, Beaverton, Long BeachUnified High School district in California and Seattle Public Schools. I also revieweddocuments and reports from these districts and obtained information from district websites. Ialso conducted an extensive search for studies and academic evaluations on the topic ofgraduation rates and dropouts. I also obtained data on graduation rates and dropouts from theOregon Department of Education for the years 2009 through 2012. I also obtained reports andstudies produced by PPS Research and Evaluation and the office of the Chief AcademicOfficer.This audit was performed in accordance with the 2012-13 Audit Plan approved by the PPSSchool Board. I performed the fieldwork from January 2013 through April 2013, and conductedreport writing in May and June of 2013. I conducted this audit in accordance with generallyaccepted government auditing standards. Those standards require that I plan and perform theaudit to obtain sufficient and appropriate evidence to provide reasonable basis for finding andconclusions based on the audit objectives. I believe the evidence I obtained provides areasonable basis for my findings and conclusions. I have implemented an internal qualitycontrol process to ensure standards are met but I have not undergone an external qualityreview as required by standards.Improving Graduation Rates 12 June 2013
AUDIT RESULTSThe Portland Public School district has improved graduation rates and reduceddropouts over the past four years. However, the district continues to lag behind otherlarge districts in Oregon. Several Oregon districts with similar student demographicsto Portland have seen better overall graduation rate performance particularly with studentgroups that have traditionally had lower graduation rates. These districts pursue a number ofstrategies to help students remain in school, some of which are also in place in Portland. Inaddition, school districts in other states pursue various practices that may hold promise ifimplemented in Portland. Finally, PPS could benefit from additional information on how wellexisting practices are implemented and producing desired results. Information from PPSstudents on what works best for them could also contribute to better decisions on whichinterventions to pursue.Improving Graduation Rates 13 June 2013
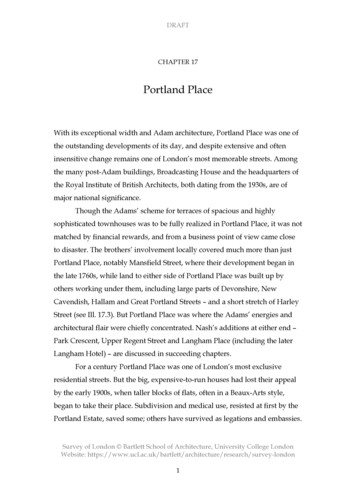
Other large Oregon school districts outperform PortlandBased on the most recent graduation statistics released by the Oregon Department ofEducation in January 2013, Portland Public Schools has the lowest 2011-12 cohortgraduation rate of the ten largest districts in Oregon. As shown in the table below,2,145 students from the 2008-09 ninth grade cohort of 3,400 received a regular diploma in 2012,a graduation rate of 63 percent. This compares to a high of 81 percent at Tigard-Tualatin SchoolDistrict and a low of 64 percent at Medford School District. The statewide average was 68percent. The same cohort’s four-year completion rate (includes adult HS diploma, modifieddiploma, and GED) was the third lowest of the ten largest districts and the dropout or nonenroller rate for this cohort was 15 percent, about average compared to other districts.Figure 4Four-year cohort graduation rates, 2011-12:Ten Oregon school districtsAdj. cohort('08-09 erton SD2,9792,30877%81%9%Bend-LaPine SD1,4301,03272%80%12%Eugene SD1,43895166%72%15%Gresham-Barlow SD1,01771570%73%17%Hillsboro SD1,5971,20575%84%9%Medford SD1,02865764%71%17%North Clackamas SD1,5021,07872%77%12%PORTLAND SD3,4002,14563%73%15%Salem-Keizer SD3,1122,14769%75%16%Tigard-Tualatin SD1,02983681%85%10%School DistrictState of llerrateOregon Department of Education, 2011-12 Cohort Graduation RatesPortland also does not compare favorably to the other large districts when comparing thegraduation rates of four special groups: students from underserved ethnic groups,economically disadvantaged students, students with disabilities, or students learning English.As shown in the table below, Portland graduated 52 percent of students from underservedethnic groups, the lowest graduation rate for this group of students of the ten large districts. Inaddition, Portland graduated 56 percent of the economically disadvantaged students in the2011-12 cohort, again the lowest percentage compared to the other large districts. Portland’sImproving Graduation Rates 14 June 2013
graduation rates for students with disabilities and English language learners in the 2011-12was 31 percent and 47 percent respectively, lower than most other large districts.Portland’s performance may be partly due to the high percentage of students in the2011-12 cohort from these special groups that traditionally have had lower graduationperformance. For example, 33 percent of Portland’s four-year graduation cohort were fromunderserved ethnic groups, higher than the statewide average of 23 percent. In addition, 52percent of the cohort was identified as economically disadvantaged, compared to a statewideaverage of 51 percent. The 2011-12 Portland cohort also had a higher than average numberof special education students but a lower percent of English language learners. However, asshown in the table, other schools with the same or higher percent of students from thesegroups, such as the Hillsboro School District and the Salem-Keizer School District, both hadbetter graduation rates for these groups than Portland. Hillsboro graduated 67 percent andSalem-Keizer graduated 62 percent of the underserved ethnic group compared to Portland’srate of 52 percent. Hillsboro graduated 70 percent and Salem-Keizer graduated 62 percent oftheir economically disadvantaged students in the 2011-12 cohort compared to Portland’s rateof 56 percent.Figure 52011-12 Graduation rate comparison for four special groups:Ten Oregon school districtsSchool DistrictState of OregonUNDERSERVEDETHNIC GROUP*ECONOMICALLYDISADVANTAGED% ofstudents23%% ISABILITIES% ofstudents14%grad.rate38%LEP**% ofstudents9%grad.rate49%Beaverton SD23%58%39%63%13%48%12%52%Bend-LaPine SD14%53%50%65%13%45%4%35%Eugene SD16%57%41%55%15%39%3%44%Gresham-Barlow SD22%54%43%63%11%33%9%36%Hillsboro SD33%67%53%70%17%33%10%51%Medford SD25%56%52%59%9%23%7%46%North Clackamas SD16%63%43%67%12%36%12%63%PORTLAND SD33%52%52%56%15%31%9%48%Salem-Keizer SD36%62%60%62%13%39%12%48%Tigard-Tualatin SD20%67%32%69%10%48%7%55%* Hispanic, Native American, Pacific Islander, Black** Limited English proficiencySource:Oregon Dept. of EducationImproving Graduation Rates 15 June 2013
Despite Portland’s relatively poor performance compared to the other large Oregondistricts, PPS has seen significant improvement over the past four years in graduation anddropout rates. As shown in the table below, over the four year period from 2008-09 to2011-12, Portland’s four-year cohort graduation rate increased 10 percentage points, from 53percent in 2008-09 to 63 percent in 2011-12. Some of this improvement is due to correctionsin the data submitted to ODE by Portland to reflect more accurate information on the numberof students in the cohorts arriving and leaving the Portland district. The second highestpercentage point increase ( 6.2%) was achieved by the Salem-Keizer followed by 4.7 in NorthClackamas and 4.3 in Medford. The Eugene School District was the only large district with asignificant decline in graduation rates, dropping 12.8 points.Figure 6Graduation rates: 4-year trend in ten Oregon school districtsSchool 11-12State of Oregon66.2%66.4%67.7%68.4%2.2%Beaverton SD74.2%75.8%76.8%77.5%3.3%Bend-LaPine SD68.6%72.8%68.2%72.2%3.6%Eugene SD78.9%70.6%71.2%66.1%(12.8%)Gresham-Barlow SD69.0%64.1%70.5%70.3%1.3%Hillsboro SD75.6%76.5%78.3%75.4%(0.2%)Medford SD59.6%61.6%64.1%63.9%4.3%North Clackamas SD67.0%65.4%65.9%71.8%4.8%PORTLAND SD53.3%53.6%62.1%*63.1%9.8%Salem-Keizer SD62.8%65.7
PPS is improving but lags behind other large Oregon districts in on-time graduation and dropout levels. Although PPS increased graduation rates by 10 points and lowered dropout rates by 4 points over the past four years, PPS ranks last in graduation rates and 7th in dropout rates when compared to the ten largest Oregon school districts. A