Transcription
ANNUAL REPORTNCEA, UNIVERSITYENTRANCE AND NZSCHOLARSHIP DATAAND STATISTICSMAY 2020
NZQA’s externalexaminations143,509 from 500studentsschools1,139,770external entries(NCEA and NZ Scholarship)129examinationsessionsheld at418centres1,639markers6,026examination centremanagers and supervisors35digitalexaminations in14 subjects
ContentsIntroduction. 3New Zealand Scholarship. 51Purpose of this Report. 5Scholarship Monetary Awards.51Attainment statistics are reportedfor three types of student cohorts.6Scholarship Statistics.52NCEA and University Entrance attainment.9Introduction.9Premier Awards andOutstanding Scholar Awards.56Enrolment-based Cohort Statistics.9Results by Standard Type. 59Statistics by Gender.11Statistics by Ethnicity.13Statistics by School Decile Band.16Tracked Year 11 Cohort Statistics.19Statistics by Gender.20Statistics by Ethnicity.23Literacy and Numeracy. 27Literacy requirements.27Numeracy requirements.27Scholarships Awarded in 2019 by Subject.53NCEA Administrative processes and data.73The Role of NZQA in theExamination Process.73External Assessment.73Reviews and Reconsiderations.73External Moderation ofInternal Assessment.75Breaches of Examination Rules.77Alignment of Standards.27Special Assessment Conditions (SAC).79Literacy and Numeracy for NCEA Level 1.28Appendices. 81Literacy and Numeracy forUniversity Entrance.29Appendix 1. Cohorts.81Appendix 2. Glossary.81NCEA Certificate Endorsement.31Statistics by Gender.33Statistics by Ethnicity.36Statistics by School Decile Band.40Course Endorsement. 45Merit and Excellence Endorsements.46Statistics by Gender.47Statistics by Ethnicity.48Statistics by School Decile Band.49NZQA CONTENTS01
02NZQA PURPOSE OF THIS REPORT
The Annual Report on NCEA and New ZealandScholarship Data and Statistics (2019) summarisesthe results of New Zealand’s senior secondarystudents achieving the National Certificateof Educational Achievement (NCEA) andNew Zealand Scholarship in 2019.The statistics in this Annual Report were producedfrom data that was finalised on 2 April 2020.Graphs of the statistics include information fromprevious years to show trends, generally coveringthe ten years 2010 to 2019.Kristine KilkellyDeputy Chief ExecutiveAssessment DivisionNew Zealand Qualifications AuthorityElectronic copies of this report and most of thedata used in this report can be found on theNZQA website:www.nzqa.govt.nz/statisticsThe New Zealand Qualifications Authorityis pleased to present the statistics containedin this report.Dr Grant KlinkumChief ExecutiveNew Zealand Qualifications AuthorityNZQA INTRODUCTION03
04NZQA PURPOSE OF THIS REPORT
This report provides information about theattainment of secondary-school qualificationsadministered by the New Zealand QualificationsAuthority (NZQA). Its primary focus is the mainNew Zealand secondary school qualifications, theNational Certificate of Educational Achievement(NCEA) at Levels 1, 2, and 3. It also reports on theattainment of Literacy and Numeracy, CertificateEndorsement, Course Endorsement, UniversityEntrance, and New Zealand Scholarship.11The report also provides information and statisticsrelated to the processes used to administer NCEA.These include: Reviews and reconsiderations of examinationresults External moderation of internal assessments Breaches of examination rules, and Special Assessment Conditions (SAC).Some students pursue non-NCEA qualifications (e.g. Cambridge Assessment International Education or International Baccalaureate).These non-NCEA qualifications are not included in this report.NZQA PURPOSE OF THIS REPORT05
Attainment statistics are reported for three types of student cohortsAttainment statistics are used for multiplepurposes. These include monitoring of standards,of student attainment, and of the quality ofassessment(s). This diversity of purpose requiresdifferent types of statistics. There are three typesof percentage statistics presented in this report.Each type is distinguished by the underlyingdenominator used to compute the percentages.The denominators used are based on cohorts.The three types of cohorts are: Enrolment-based cohort Tracked Year 11 cohort All NZQA secondary students’ cohort.Each cohort is explained in this section. Furtherinformation about cohorts is found in Appendix 1.06NZQA PURPOSE OF THIS REPORTEnrolment-based cohortThe Enrolment-based cohort consists ofNew Zealand domestic students in Years 11 to13 (aged less than 19 years on 1 January) with aMinistry of Education recorded enrolment of oneday or more in the academic year concerned.In 2019, there were 162,387 students in theenrolment-based cohort. In addition, there were23,007 international students and 3,616 adultstudents enrolled in Years 11 to 13 who are notincluded in the enrolment-based cohort.Each year there are students at secondary schoolwho undertake courses which are not assessedusing standards administered by NZQA suchas Accelerated Christian Education (ACE),Cambridge Assessment International Education,or International Baccalaureate. These studentsare included in the Enrolment-based cohort,but their attainment of these alternative awardsis not included.
Tracked Year 11 cohortSummaryThe Tracked Year 11 cohort is formed from theEnrolment-based Student cohort. More formally,it is Year 11 students from the Enrolment-basedStudent cohort. Students in a Tracked Year 11cohort are monitored from the beginning of theirYear 11 year for three years of schooling forattainment of NCEA qualifications. For example,the 2017 Tracked Year 11 cohort is made up ofthe Year 11 students from the Enrolment-basedStudent cohort of 2017. This cohort’s attainmentrates of NCEA qualifications are reported as atthe end of 2019. If a student leaves secondaryschooling before the end of three years, they arestill in the tracked cohort; however, any tertiaryattainment is not included. If a student is a Year 11in multiple years, their progress is tracked from thefirst year they are in Year 11.The Enrolled Student cohort consists ofNew Zealand Year 11-13 domestic students witha Ministry of Education recorded enrolment ofone day or more. The Tracked Year 11 cohortconsists of Year 11 students from the EnrolledStudent cohort, and tracks their NCEA attainmentsfrom Year 11 for up to three years of secondaryschooling. The ‘All NZQA secondary students’cohort includes all secondary students reportedto NZQA.‘All NZQA secondary students’ cohortThe ‘All NZQA secondary students’ cohortincludes every student result reported to NZQA,including New Zealand international fee-payingstudents, students from the Cook Islands and Niue,adult students, and students outside years 11-13.The following sections use this cohort: New Zealand Scholarship Results by Standard Type NCEA Administrative processes and data.NZQA PURPOSE OF THIS REPORT07
Attainment8NZQA NCEA AND UNIVERSITY ENTRANCE ATTAINMENT
IntroductionThis section reports NCEA qualification andUniversity Entrance attainment statistics. It utilisestwo types of attainment statistics: Enrolment-based cohort statistics Tracked Year 11 cohort statistics.The Enrolment-based cohort statistics showattainment as a percentage of the number ofstudents reported to the Ministry of Educationas being enrolled at a New Zealand secondaryschool. The Tracked Year 11 cohort statisticsquantify attainment over the three years of seniorsecondary schooling.Enrolment-based Cohort StatisticsThe statistics are presented as a percentage of thenumber of students who attain NCEA qualificationsout of the total number of students enrolled at aNew Zealand secondary school.A brief description of the data used in producingthe statistics in this section follows.Number of students who achieve NCEAqualifications or University EntranceThe number of students who attain NCEAqualifications is defined as the number of studentswho attain NCEA Levels 1, 2, or 3, in Year 11,Year 12, and Year 13, respectively. That is, thenumber of students who attain: NCEA Level 1 by the end of Year 11 NCEA Level 2 by the end of Year 12 NCEA Level 3 by the end of Year 13.For the University Entrance award it is the numberof students in Year 13 awarded University Entranceby the end of Year 13.A cumulative attainment percentage is used.This definition includes students in that year whoachieved the qualification concerned in an earlieryear. For example, a student who is in Year 10 in2018 and achieved level 1 in that year and is inYear 11 in 2019 would be included as a Year 11having achieved level 1 in 2019.Total number of students from theEnrolment-based cohortThe total number of students in the Enrolmentbased cohort refers to the total number ofNew Zealand domestic students in Years 11 to 13(aged less than 19 years on 1 January).Statistics related to University EntranceNew University Entrance requirements cameinto effect from 1 March 2014. The impact of thechange was a reduction in the 2014 UniversityEntrance attainment rates from those in 2013.The reduction was an expected outcome fromthe change in University Entrance requirements.The University Entrance attainment rates in 2019show an increase from their 2014 values.NZQA NCEA AND UNIVERSITY ENTRANCE ATTAINMENT09
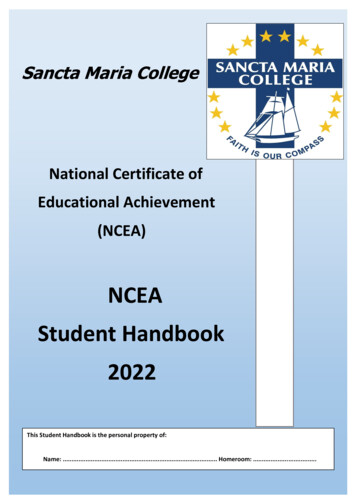
Figures 1-13 show Enrolment-based attainment rates, between genders, ethnicities, and school decile bands for the threelevels of NCEA qualification and University Entrance.100%Enrolment-based Year 11 Students Attaining NCEA Level 1,Year 12 Students Attaining NCEA Level 2, Year 13 StudentsAttaining NCEA Level 3 and University Entrance90%Percentage of 201420152016201720182019NCEA (Level 6%NCEA (Level 5%NCEA (Level 3%University .9%49.3%Figure 1. Enrolment-based attainment rates of Year 11 to 13 students attaining NCEA Levels 1-3 and University Entrance.10NZQA NCEA AND UNIVERSITY ENTRANCE ATTAINMENT
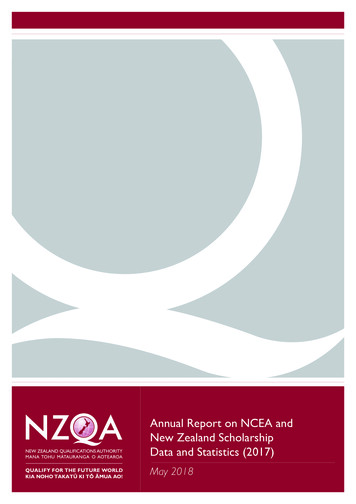
Statistics by GenderFigures 2-5 show Enrolment-based attainment rates of male and female students. Students with “unknown gender”have been omitted from these tables.100%Enrolment-based Year 11 Students attainment of NCEA Level 1 by gender90%Percentage of 4.7%77.0%78.8%79.1%79.2%76.8%74.9%Figure 2. Enrolment-based attainment rates of Year 11 students attaining NCEA Level 1 by gender.100%Enrolment-based Year 12 Students attainment of NCEA Level 2 by gender90%Percentage of 5.2%79.1%80.1%81.8%81.5%81.0%80.2%Figure 3. Enrolment-based attainment rates of Year 12 students attaining NCEA Level 2 by gender.NZQA NCEA AND UNIVERSITY ENTRANCE ATTAINMENT11
100%Enrolment-based Year 13 Students attainment of NCEA Level 3by gender90%Percentage of 2.6%66.1%68.5%69.2%70.5%70.7%71.9%Figure 4. Enrolment-based attainment rates of Year 13 students attaining NCEA Level 3 by gender.100%Enrolment-based Year 13 Students attainment of University Entranceby gender90%Percentage of 4.9%42.1%55.2%42.4%54.8%42.2%55.8%Figure 5. Enrolment-based attainment rates of Year 13 students attaining University Entrance by gender.12NZQA NCEA AND UNIVERSITY ENTRANCE ATTAINMENT
Statistics by EthnicityFigures 6-9 show Enrolment-based attainment rates for Asian, European, Māori, and Pacific students.Students from the Middle Eastern/Latin American/African (MELAA) grouping are omitted from the graphs.For data used in this report with the MELAA ethnic group included please refer to the NZQA ased Year 11 Students attainment of NCEA Level 1by Ethnicity90%Percentage of 4%80.8%63.2%80.5%62.9%78.0%58.4%76.0%57.7%Pacific 8%61.8%Figure 6. Enrolment-based attainment rates of Year 11 students attaining NCEA Level 1 by ethnicity.NZQA NCEA AND UNIVERSITY ENTRANCE ATTAINMENT13
100%Enrolment-based Year 12 Students attainment of NCEA Level 2by Ethnicity90%Percentage of 7%73.9%81.5%68.6%72.1%81.1%68.9%71.3%MaoriPacific PeoplesFigure 7. Enrolment-based attainment rates of Year 12 students attaining NCEA Level 2 by ethnicity.100%Enrolment-based Year 13 Students attainment of NCEA Level 3by Ethnicity90%Percentage of 4%39.3%40.8%44.3%47.7%50.2%52.6%52.9%55.1%Pacific 9%60.3%Figure 8. Enrolment-based attainment rates of Year 13 students attaining NCEA Level 3 by ethnicity.14NZQA NCEA AND UNIVERSITY ENTRANCE ATTAINMENT
100%Enrolment-based Year 13 Students attainment of University Entranceby Ethnicity90%Percentage of 5%28.7%30.6%25.3%27.8%28.1%29.3%29.3%29.9%Pacific 6%30.3%Figure 9. Enrolment-based attainment rates of Year 13 students attaining University Entrance by ethnicity.NZQA NCEA AND UNIVERSITY ENTRANCE ATTAINMENT15
Statistics by School Decile BandFigures 10-13 show Enrolment-based attainment rates between School Decile Bands 1-3, 4-7, and 8-10.There are a few schools with no specified decile, and their data have been omitted from these statistics.It is important to note that a school’s decile rating gives an indication of the average socio-economic level of studentsat the school, but it does not necessarily reflect the circumstances of particular students.100%Enrolment-based Year 11 Students Attaining NCEA Level 1by Decile Band90%Percentage of 201420152016201720182019Decile .6%Decile .7%Decile 8.8%Figure 10. Enrolment-based attainment rates of Year 11 students attaining NCEA Level 1 by school decile band.16NZQA NCEA AND UNIVERSITY ENTRANCE ATTAINMENT
100%Enrolment-based Year 12 Students Attaining NCEA Level 2by Decile Band90%Percentage of 201420152016201720182019Decile .7%Decile .2%Decile 8-10Figure 11. Enrolment-based attainment rates of Year 12 students attaining NCEA Level 2 by school decile band.100%Enrolment-based Year 13 Students Attaining NCEA Level 3by Decile Band90%Percentage of 201420152016201720182019Decile .4%Decile .5%Decile 6.9%Figure 12. Enrolment-based attainment rates of Year 13 students attaining NCEA Level 3 by school decile band.NZQA NCEA AND UNIVERSITY ENTRANCE ATTAINMENT17
100%Enrolment-based Year 13 Students Attaining University Entranceby Decile Band90%Percentage of 201420152016201720182019Decile .8%Decile .6%Decile 5.4%Figure 13. Enrolment-based attainment rates of Year 13 students attaining University Entrance by school decile band.18NZQA NCEA AND UNIVERSITY ENTRANCE ATTAINMENT
Tracked Year 11 Cohort StatisticsThe Tracked Year 11 cohort statistics quantify attainment over the three years of senior secondary schooling.For example, the Tracked 2017 Year 11 cohort is formed from the students in the 2017 Enrolled Students cohortwho are Year 11 students. Students who leave school before the end of 2019 remain a part of the cohort, and theirattainments up to their departure from schools are still included. The tracked cohort statistics are also presented bygender and ethnicity.Some students pursue non-NCEA qualifications (e.g. Accelerated Christian Education, Cambridge AssessmentInternational Education, or International Baccalaureate). These attainments are not included in the tracked cohort figures.Figure 14 shows the attainment rates of NCEA Level 1, NCEA Level 2, NCEA Level 3, and University Entrance for theTracked Year 11 cohort for the years 2008 to 2017.100%Tracked Year 11 Cohort attainment at the end of three years90%Percentage of 18201620192017NCEA (Level 6%NCEA (Level 1%NCEA (Level 6%University .8%37.9%Figure 14. Attainment rates of tracked Year 11 cohort 2008 to 2017 at the end of three years.NZQA NCEA AND UNIVERSITY ENTRANCE ATTAINMENT19
Statistics by GenderFigures 15-18 show the male and female attainment rates of NCEA Level 1, NCEA Level 2, NCEA Level 3, andUniversity Entrance for the Tracked Year 11 cohort, for the years 2008 to 2017. Students with “unknown gender”have been omitted from this table.100%Tracked Year 11 Cohort attainment of NCEA Level 1 at the endof three years by Gender90%Percentage of 6.8%88.0%88.8%88.6%88.3%Figure 15. NCEA Level 1 attainment rates by gender for the tracked Year 11 cohort 2008 to 2017 at the end of three years.20NZQA NCEA AND UNIVERSITY ENTRANCE ATTAINMENT
100%Tracked Year 11 Cohort attainment of NCEA Level 2 at the endof three years by Gender90%Percentage of 9.6%80.8%82.0%81.3%80.8%Figure 16. NCEA Level 2 attainment rates by gender for the tracked Year 11 cohort 2008 to 2017 at the end of three years.100%Tracked Year 11 Cohort attainment of NCEA Level 3 at the endof three years by Gender90%Percentage of 7.0%58.5%59.1%58.2%58.8%Figure 17. NCEA Level 3 attainment rates by gender for the tracked Year 11 cohort 2008 to 2017 at the end of three years.NZQA NCEA AND UNIVERSITY ENTRANCE ATTAINMENT21
100%Tracked Year 11 Cohort attainment of University Entranceat the end of three years by Gender90%Percentage of 5.6%46.6%46.5%45.3%45.8%Figure 18. University Entrance attainment rates by gender for the tracked Year 11 cohort 2008 to 2017 at the end of three years.22NZQA NCEA AND UNIVERSITY ENTRANCE ATTAINMENT
Statistics by EthnicityFigures 19-22 show attainment rates by ethnicity for NCEA Level 1, NCEA Level 2, NCEA Level 3, and UniversityEntrance using the Tracked Year 11 cohort for the years 2008 to 2017. The ethnicity stated in 2008 to 2017 whenthe student became a member of the cohort is maintained throughout, even though the student may subsequently altertheir ethnicity. Students from Middle Eastern/Latin American/African (MELAA) grouping are omitted from the graphs.100%Tracked Year 11 Cohort attainment of NCEA Level 1 at the endof three years by Ethnicity90%Percentage of 1%89.4%77.6%89.0%77.7%89.1%76.9%Pacific 5%83.5%Figure 19. NCEA Level 1 attainment rates by ethnicity for the tracked Year 11 cohort 2008 to 2017 at the end of three years.NZQA NCEA AND UNIVERSITY ENTRANCE ATTAINMENT23
100%Tracked Year 11 Cohort attainment of NCEA Level 2 at the endof three years by Ethnicity90%Percentage of 2%82.0%67.7%81.3%66.7%80.9%65.0%Pacific 0%74.7%Figure 20. NCEA Level 2 attainment rates by ethnicity for the tracked Year 11 cohort 2008 to 2017 at the end of three years.100%Tracked Year 11 Cohort attainment of NCEA Level 3 at the endof three years by Ethnicity90%Percentage of 6%54.9%35.0%54.1%34.2%54.7%35.1%Pacific 9%46.2%Figure 21. NCEA Level 3 attainment rates by ethnicity for the tracked Year 11 cohort 2008 to 2017 at the end of three years.24NZQA NCEA AND UNIVERSITY ENTRANCE ATTAINMENT
100%Tracked Year 11 Cohort attainment of University Entrance at theend of three years by Ethnicity90%Percentage of 9%43.7%19.5%42.5%18.9%42.6%18.9%Pacific 4%23.5%Figure 22. University Entrance attainment rates by ethnicity for the tracked Year 11 cohort 2008 to 2017 at the end of three years.NZQA NCEA AND UNIVERSITY ENTRANCE ATTAINMENT25
Literacy andNumeracy26NZQA LITERACY AND NUMERACY
In addition to the attainment of literacy andnumeracy requirements of NCEA Level 1,attainment for the literacy and numeracyrequirements of University Entrance arealso reported.The literacy and numeracy statistics of NCEALevel 1 are based on the Year 11 Enrolmentbased cohort.The literacy and numeracy statistics for UniversityEntrance are based on the Year 13 Enrolmentbased cohort.Literacy requirementsFor NCEA Level 1, the requirement for Literacyis a minimum of 10 credits. This requirement caneither be met by: Achieving all three literacy unit standards; or by Achieving 10 or more credits from theapproved list of assessment standards andthe three English for Academic Purposesunit standards.Numeracy requirementsFor both NCEA Level 1 and University Entrance,the requirement is a minimum of 10 credits. Thisrequirement can either be met by: Achieving all three literacy unit standards; or by Achieving 10 or more credits from theapproved list of Achievement Standards.Alignment of StandardsChanges to standards as a result of the Alignmentof Standards with the New Zealand CurriculumProject (from 2011 to 2013) had an impact onliteracy and numeracy attainment. These changesaltered both the standards and the range ofsubjects from which credits could be derivedtowards the literacy and numeracy requirements.For further information on literacy and numeracyrequirements, please refer to the NZQA website:www.nzqa.govt.nz/literacy-requirementsFor University Entrance, the requirement is aminimum of 10 credits at Level 2 or above,made up of: At least 5 credits from approved readingstandards At least 5 credits from approved writingstandards.NZQA LITERACY AND NUMERACY27
Literacy and Numeracy for NCEA Level 1Table 1 shows the percentage of Year 11 students attaining NCEA Level 1 Literacy and Numeracy by the endof each %201985.5%83.4%Table 1. Overall cumulative percentage of Year 11 students attaining NCEA Level 1 Literacy and Numeracy.28NZQA LITERACY AND NUMERACY
Literacy and Numeracy for University EntranceTable 2 shows the percentages of Year 13 students achieving the literacy and numeracy requirements forthe University Entrance award. For University Entrance, the numeracy percentages are not comparable to thenumeracy percentages for NCEA Level 1 reported earlier (refer to Table 1), as the cohorts used are different,i.e. these University Entrance statistics use the Year 13 Enrolment-based Student cohort, whereas the Level 1numeracy statistics used a Year 11 Enrolment-based Student .8%201970.4%94.0%Table 2. Overall cumulative percentage of Year 13 students attaining University Entrance Literacy and Numeracy.NZQA LITERACY AND NUMERACY29
30NZQA NCEA CERTIFICATE ENDORSEMENT
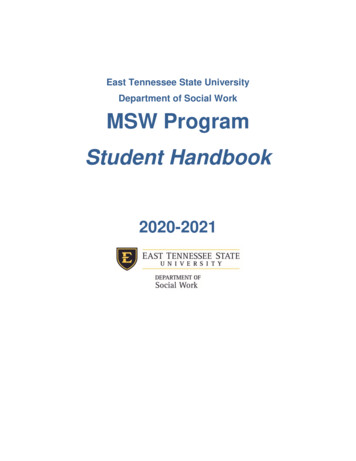
Certificate Endorsement with Merit or Excellencefor NCEA Levels 1, 2 and 3 was introducedin 2007 to motivate students toward higherattainment. To be awarded an Excellenceendorsement, students must achieve 50 or morecredits at Excellence. To be awarded a Meritendorsement, students must achieve 50 or morecredits with Merit or above.50%The attainment rate of certificate endorsementis the percentage of students who achieved anNCEA certificate with an endorsement in the sameyear.2 The denominator for these percentagesis the number of students who achieved thequalification.Figures 23-25 show the percentages of studentswho achieved NCEA Levels 1, 2, or 3 with Meritor Excellence endorsement.Merit and Excellence Endorsements NCEA Level 145%Percentage of 01420152016201720182019Merit %34.3%33.9%Excellence 20.5%19.9%Figure 23. NCEA Level 1 Endorsements achieved by Year 11 students with NCEA Level 1.2Only endorsements gained in the same year as the qualification are included in this report. The number of credits required to gain an endorsementmay be accumulated over a number of years. This makes it possible for candidates to add an endorsement to an NCEA Certificate that was achievedin a prior year(s).NZQA NCEA CERTIFICATE ENDORSEMENT31
50%Merit and Excellence Endorsements NCEA Level 245%Percentage of Students40%35%30%25%20%15%10%5%0%Merit EndorsementExcellence igure 24. NCEA Level 2 Endorsements achieved by Year 12 students with NC
The Annual Report on NCEA and New Zealand Scholarship Data and Statistics (2019) summarises the results of New Zealand's senior secondary students achieving the National Certificate of Educational Achievement (NCEA) and New Zealand Scholarship in 2019. The statistics in this Annual Report were produced from data that was finalised on 2 April .