Transcription
Assiut Scientific Nursing mpactfactor.comDOI: 10.21608/ASNJ.2021.79902.1192Effect of implementing nursing care interventions to minimize infection among patientsundergoing Intracranial Pressure monitoringAsmaa Abd Elhafez Abd El-ghani1, Mogedda Mohamed Mehany2, Mohamed Abd El- Basset Ali3&Mona Abd Elaziem Ahmed41.Special Nursing in Assiut University Hospital, Assuit, Egypt.Assistant prof in Critical Care and emergency Nursing Department, Faculty of Nursing, Assuit University, Egypt.3.Assistant prof. Neurosurgical Department, Faculty of Medicine, Assuit University, Egypt.4.Lecturer in Critical Care and Emergency Nursing Department, Faculty of Nursing, Assuit University, Egypt.2.AbstractIntroduction: Elevated intracranial pressure (ICP) can occur as a complication of neurosurgical emergenciesincluding traumatic brain injury. Aim of this study: To evaluate the effect of implementing nursing careinterventions to minimize infection among patients undergoing intracranial pressure monitoring. Design: Quasiexperimental research design was utilized in the study. Setting: This study was conducted at traumatic intensive careunit at Assiut university hospital. Patients: A convenient sample of 60 adult patients assigned into two equal groupstudy and control group. Result: The results was successed in reducing of infection, there was a statisticalsignificance difference between study and control group, Regarding to hyperthermia there were (0.0%) of patients inthe study group compared to (26.7%) in control group the third day. Conclusion: Implementing nursing interventionsuccessed in minimize infection among patients undergoing intracranial pressure monitoring. Recommendation:Apply nursing intervention to minimize infection among patients with Intracranial monitoring in traumatic ICU unit.Keywords: Nursing care, Minimize Infection & Intracranial pressure.Introduction:The pressure which created inside the skull is calledintracranial pressure (ICP), the pressure of braintissue and cerebrospinal fluid (CSF). The total of thevolumes of brain and intracranial blood remainsconstant when the skull is intact because the brain isincompressible. The normal range of intracranialpressure 5 to 15 mmHg, ICP 15 mmHg isconsidered high, and it's a significant cause ofsecondary injury, which can lead to irreversible braindamage and death. Traumatic Brain Injury,intracerebral hemorrhage, subarachnoid hemorrhage ,hydrocephalus, malignant infarction, cerebraledema, CNS infections, hepatic encephalopathy areamong the situations for which ICP monitoring isindicated inany of these circumstances, ICPMonitoring in conjunction with other indicators canhelp to improve the management of elevated ICP.(Creech & Johnson, 2017)An ICP of 5 to 15 mmHg is considered normal. Thereis no predetermined point at which intracranialhypertension treatment should begin, however valuesmore than 20mmHg are routinely treated with thegoal of maintaining an acceptable cerebral perfusionpressure. In neurosurgical practice, increasedintracranial pressure (ICP) is a prevalent condition. Itmay develop as a result of cerebral mass lesions,Circulation problems in the cerebrospinal fluid (CSF),as well as more widespread intracranial pathologies.It can be either acute or chronic in nature. IntracranialVol , (9) No, (25), Supplement June, 2021, pp (166-176)pressure that rises rapidly or for a long time poses amajor hazard to life. ICP elevations are dangerousbecause they can reduce brain perfusion and bloodflow. The brain takes 50 to 55 milliliters of blood per100 g of brain tissue to function properly (Morton etal., 2017).It's important to figure out symptoms and signs if thesymptoms a patient is experiencing can beattributable to something else, such a stroke, whichraised ICP. Headache, Vomiting, Restlessness andIrritability, Elevated blood pressure, Decreasedmental capacities, Confusion about time, location,and people as the pressure worsens , Double vision,Pupils that don’t react to light changes, sness, coma are all signs of increased ICP(Carey, 2018).Intracranial pressure (ICP) monitoring has beenemployed in the fields of neurosurgery and neurologyfor decades. There are several techniques: bothinvasive and noninvasive, such as ventriculostomyand micro transducers. Ventriculostomy is the goldstandard in terms of accurate pressure monitoring,however tiny transducers are generally just as good.Both invasive approaches have a small risk ofproblems like bleeding and infection. Non-invasivetechniques do not have the same risk of complicationsas invasive methods, but they do not measure ICPcorrectly enough to be utilized as a routine alternativeto invasive assessment. (Holloway et al., 2016).166
Assiut Scientific Nursing JournalIntracranial pressure monitoring measured by catheteris inserted into the brain parenchyma through a burrhole in this intra-parenchymal approach, which has alower complication rate, infection rate, and no risk ofcatheter blockage or leakage. Because of the probe'smodest diameter, there is less risk of neurologicalharm. Furthermore, transducer has a lower impact onmeasurement mistakes. When compared to patientstreated without an ICP monitor, using an ICP monitorin the case of traumatic brain injury is associated withsignificantly lower mortality. Methods of ICPmonitoring may also be linked to a number ofproblems. Infection risk, bleeding, blockage,placement difficulty, and malposition are some ofthem. (Smith et al., 2015).A consequence of intracranial pressure monitoringdevices is infection. Antimicrobial prophylaxisagainst intracranial pressure monitor (ICPM)-relatedinfection has never been adequately characterized interms of timing, duration, and role. In patients withICPMs, risk variables were investigated, as well asthe selection, duration, and timing of antibioticprophylaxis. Infection is the most commonconsequence with ICP monitors, with reports rangingfrom 0% to 40% and an average of 10%. Antibioticsgiven to patients prior to or during ICPMimplantation had no effect on CSF infection rates.Patients with an ICPM duration of more than 5 dayswere shown to be at higher risk for infection at ourfacility, use of ventricular catheter, CSF leak,concurrentsystemic infection, or serial ICPM.(Kanter et al., 2015).Patients who require ICP monitoring should be caredfor by trained critical care neuroscience nursescompetent in neurologic assessment and managementof the monitoring device. Patient assessment shouldinclude hourly monitoring for signs and symptomsassociated with changing ICP, or more frequently asthe clinical situation warrants. Notify the physicianimmediately if ICP exceeds established parameters. Ifno parameter is specified, notify the physician if ICPis 20 mmHg. (Thompson, 2018).Nursing interventions to reducing infection riskfactors by using prophylactic antibiotics, Recognizehow nursing care affects intracranial pressure,Determine each patient's ICP reference ranges basedon physician directions, underlying pathophysiologyand treatment plan, Keep an eye on pulmonaryhygiene and the impact of therapies like suctioningand patient posture, Create a daily interdisciplinarycare plan with individualized daily goals, Asdetermined by the patient's condition, begin nursingconsultations for skin management and hygiene,Nursing care should be scheduled at regular intervalsto allow patients with high ICP to stabilized.(Thompson., 2018).Vol , (9) No, (25), Supplement June, 2021, pp (166-176)Abd El-ghani et al.,Significant of the study:Despite increased awareness of hospital-acquiredinfection, and efforts to reduce its occurrence, theincidence continues to increase. It has been estimatedthat between 4% and 10% of hospitalized patientswill become infected, particularly after entering theoperation room or intensive care unit, )Between 2011& 2012), an estimated 53,700 of these Hospital –acquired infection were surgical site infections arenow considered to be the most common and costly ,adding approximately 7 to 11 days to the operative morbidity and mortality( Milleret al.,2015).During period from 2018-2019 60 Patients admittedto traumatic intensive care unit at Assiut universityhospital with intracranial pressure monitoring byusing Micro transducer catheter. (Hospital record oftraumatic intensive care unit, 2019).Aim of the study:The aim of study was to evaluate effect ofimplementing nursing care interventions to minimizeinfection among patients who undergoing intracranialpressure monitoring.Hypothesis: Patients who will received the interventions is willhave fewer infection occurrence compared tocontrol group. Patients who will receive the interventions is willhave fewer complications occurrence compared tocontrol group. Length of hospital stay will be shorter among thestudy groups compared to the control groups.Patients and MethodsDesign:A quasi-experimental research design was used in thepresent study (study and control group).Setting:The study was conducted at traumatic intensive careunit at Assiut university hospital.Patients:A convenient sample of adult patients from both sexwho were 60 patients were assigned into two equalgroup each group consist of 30 patients.Study group: was received nursing intervention inaddition to routine hospital care.Control group was received routine hospital care.Inclusion criteria: Patients admission in ICU, Age 18 years, GCS 8, both sexes (male and female),neurosurgical patients who need immediatepostoperative ICP monitoring.Exclusion criteria: patients admitted for surgery assurgical extradural hematoma and diabetic patients,penetrating brain injury, nonalberta resident andpatients who died in the emergency department.167
Assiut Scientific Nursing JournalTools: Three tool were utilized in the study todeveloped by the researcher after review of literatureto assess the patient conditions to form base line data.Tool one: Hemodynamic assessment tool: This tooldivided into fifth parts:Part (1): Patient demographic it include (patientcode, age, sex, causes of injury, mortality rate).Part (2): Assessment of patient s clinical data whichincluded past medical history, medical diagnosis,length of ICU stay, date of admission.Part (3): Hemodynamic assessment tool, whichinclude heart rates, respiratory rate, body temperature,oxygen saturation.Part (4): Level of consciousness by using Glass comascale that was adopted from (Petridou &Antonopoulos, 2017) it is used to give a reliable,objective way of recording the conscious level of aperson for initial as well as subsequent assessment .itclassified as : Mild, GCS 13 Moderate, GCS 9-12 Sever, with GCS 8Part (5): laboratory investigation as Complete bloodcount, WBC, Hemoglobin, Blood sugar and CSFculture.Tool two: Infection manifestation tool This toolwas divided into two parts:Part (I): Intracranial pressure (ICP) monitoring:This tool was developed by the researcher afterreview of literatures, to assess ICP by using Microtransducer catheter:Which consist of a miniature solid-state pressuretransducer, mounted on a titanium case, at the end ofa 100 cm flexible nylon tube. The transducer tipcontains a silicon microchip with diffuse piezoelectricstrain gauges. The micro sensor monitors ICP at thesource intra-parenchymal, intra-ventricular orsubdural, and the information is relayedelectronically, rather than through a hydrostaticsystem or fibreoptics.The Codman micro sensor is accurate, and stable,with a daily drift of 0.13–0.11 mm Hg per day. It isflexible, and can be tunneled beneath the scalp,preventing it from being easily broken. Its small size(a nominal outer diameter of 0.7 mm for the nylonvent tube and 1.2 mm for the transducer case). (Honget al., 2016)LevelsNormalMildSeverVery SeverICP mmHg5-1516-2021-30 31Vol , (9) No, (25), Supplement June, 2021, pp (166-176)Abd El-ghani et al.,Part (II): Signs and symptom occurrence ofinfection:This tool was developed by the researcher afterreview of literatures, Smith et al., (2019) to assessoccurrence of infection consisted of fever ,local signsinclude hotness and redness around catheter,complete blood count, leucocytes count , occurrenceof CSF infection include meningitis and encephalitis .Tool Three: outcomes assessment tool: This tooldeveloped to assess effect of implementing of nursingintervention of infection on patients outcomes includeless of infection and other complication.MethodTechnique for data collection: The study wasconducted throughout three main phases:Preparatory phase:This phase was involve:1.Official and non-official permission to carry outthe study was taken from the responsibleauthorities general, anesthesia and traumaintensive care unit at Assiut University afterexplanation the aim of study.2.Development of the tool after reviewing therelated literature.3.Content validity of the tool and all necessarymodification was established by panel of 6 expertwho reviewed the instrument for icability and easiness for administermodification will be required.4.The reliability of the adapted tools had been doneafter reviewing literature using Cranach’scoefficient alpha test as the following5.Tool one: Part 1, Part 2, Part 3, Part 5 ( 0.850 )6.Tool two :( 0.870)7.Tool three : (0.790)8.A pilot study was carried out (10% of the sample)a number of 6 patients to test the clarity, validityand applicability of the tools.Ethical consideration:1.Research proposal was approved from Ethicalcommittee in the faculty of nursingadministration assuit university hospital.2.There is no risk for study subject duringapplication of the research.3.The study was followed common ethicalprinciples in clinical research.4.The anonymity and confidentiality of response,voluntary participation and right to refuse toparticipate or withdrawal from the study withoutany rational at any time.5.Informed consent was tokened from personparticipating study after explaining the nature andpurpose of the study.168
Assiut Scientific Nursing Journal6.Patient was assured that the data of this researchwill not be refused without second permission.Implementation phase:Data collection started from March 2018 until March2019.for both group. Patientdemographicandclinicaldata,hemodynamics, Glasgow coma scale and,laboratory investigation were assessed by usingtool 1from the patient record and conceders as abase line data. Assessment of intracranial monitoring by usingMicro transducer catheter. Assessment of signs and symptoms of infectiontool 2 part II.For control group:The control group was received the routine hospitalnursing care.For study group:This group was received nursing intervention tominimize infection in patients who undergoingintracranial pressure monitoring which include:Implementing of nursing intervention to minimizeinfection among the patients who undergoingintracranial pressure monitoring:Immediate interventions should include securing theairway, maintaining adequate oxygenation andventilation, and providing circulatory support asneeded. Interventions to lower or stabilize ICP includeelevating the head of the bed to thirty degrees, keepingthe neck in a neutral position, maintaining a normalbody temperature, and preventing volume overload.The patient must be stabilized before transport toradiology for brain imaging. A computed tomography(CT) scan is the most efficient test for confirming thediagnosis of increased ICP and determining its cause.In many cases, invasive ICP monitoring is required toguide medical and nursing interventions include:assess for patient history of any allergy ,Assess vitalsigns and assessment of general condition of thepatient, complete neurologic assessments, includingthe Glasgow Coma Scale (GCS), use aseptictechnique when handling any part of the intracranialmonitoring device or changing a dressing appliedafter surgery by physician ,keep wound insertion ofthe catheter clean and dry to prevent any infectionaround it, Check the drainage for cloudiness andblood, watch for sign of infection as fever, chills,neck rigidity ,Assess of any local signs of infectionaround wound site of ICP placement. such as lossof function of catheter or device in the affectedarea or palpable heat, monitor laboratory findingsas white blood cells count an increasing WBC countindicates the body efforts to combat pathogens. Rateare normal (4.500 – 11.000), Monitoring ofpulmonary hygiene by suctioning every two hours,Maintain head of the bed elevation based on patient ,Vol , (9) No, (25), Supplement June, 2021, pp (166-176)Abd El-ghani et al.,s underlying disease process to help control ICP,Maintain adequate oxygenation by observingoxygen saturation , Maintain skin care changeposition every hourly to prevent bedsores,Recordingthe reading ofICP measurementroutinely every two hours .Evaluation phase:Each patients from both group was evaluated fourtime ,first time concerning as base line data and forthree days , by using this tools to explore the effectof implementing of nursing intervention to minimizeinfection, prevent complication and period of lengthof stay is shorter among patients who undergoingintracranial pressure monitoring on patientsoutcomes.Statistical analysis:The statistical analysis was carried out using SPSSversion 23. The data collected were tabulated andanalyzed by using frequency distribution, thepercentage for qualitative variables. The chi-squaretest and independent samples t-test are used todetermine significance for comparing two groups .169
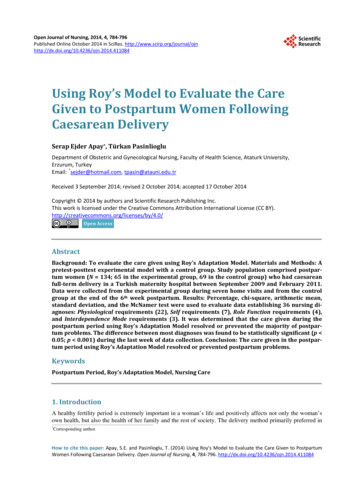
Assiut Scientific Nursing JournalAbd El-ghani et al.,Results:Table (1): Distribution of the study and the control groups related to Socio demographic andclinical data of patients with ICP:Study(n 30)No%Age by years 30 years1033.330-40 years1446.7 40 years620.0Mean SD30.13 15.07SexMale2066.7Female1033.3Causes of InjuryFall down stair26.7Fall from a high26.7Firearm26.7Motor car accident2480.0Mortality RateAlive2686.7Death413.3Chi-square test,*Significant difference at p. value 0.05,**Significant difference at p. value 0.01.Control (n 30)No%148846.726.726.731.95 23P. .556161453.346.70.010*Fig (1): Age group in the study and the control groups related to socio demo graphic data of patientswith ICP:Vol , (9) No, (25), Supplement June, 2021, pp (166-176)170
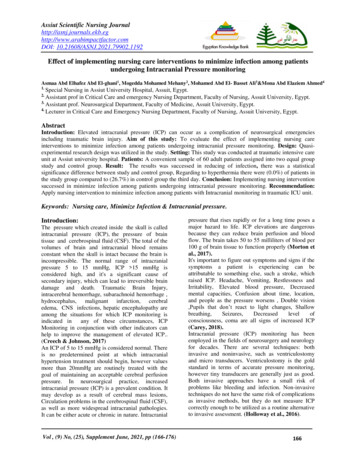
Assiut Scientific Nursing JournalAbd El-ghani et al.,86.753.3Fig (2): Comparison between the study and the control groups related to mortality rate atdischarge from ICUTable (2): Hemodynamic assessment of the study and the control groups:Body temperature1st day2nd day3rd dayHeart rate1st day2nd day3rd daySystolic blood pressure1st day2nd day3rd dayDiastolic blood pressure1st day2nd day3rd dayRespiratory rate1st day2nd day3rd dayOxygen saturation1st day2nd day3rd day- Independent t-test*Significant difference at p. value 0.05,**Significant difference at p. value 0.01.Study(n 30)Mean SDControl (n 30)Mean SDP. value37.46 0.3437.39 0.2137.35 0.1537.5 0.4437.34 0.2737.49 0.310.6720.4660.029*128.38 15.98126.62 12.41124.07 12.4115.56 13.64113.8 11.43117.42 11.040.001** 0.001**0.032*118.78 9.79112.38 8.69115.78 7.48119.96 12.94117.18 12.97120.44 14.380.6920.0980.12080.07 6.9276.16 7.4978.4 6.4582.45 7.5881.56 7.181.33 7.610.2090.006**0.11329.62 3.7530.16 2.830.53 3.0427 4.6126.89 4.4528.29 3.290.019*0.001**0.008**98.17 0.8197.67 1.3398.3 0.8798 2.5996.33 7.898.53 1.360.7800.4540.501Vol , (9) No, (25), Supplement June, 2021, pp (166-176)171
Assiut Scientific Nursing JournalAbd El-ghani et al.,Table (3): Laboratory investigation of the study and the control groups:WBC1st day2nd day3rd dayRBC1st day2nd day3rd dayHemoglobinAt admission3rd dayBlood sugar1st day2nd day3rd day- Independent t-testStudy(n 30)Mean SDControl(n 30)Mean SDP. value7.47 1.597.44 1.587.18 1.739.51 0.619.73 0.979.45 0.980.004**0.003**0.001**4.4 0.514.05 0.884.38 0.574.78 2.674.78 2.674.78 2.680.6620.4220.64911.99 1.5611.76 2.0710.62 1.7910.64 1.820.003**0.032*7.57 5.657.27 2.636.12 3.26*Significant difference at p. value 0.05,11.05 1.10.25011 1.150.017*11 1.150.012***Significant difference at p. value 0.01Table (4): Comparison between the study and the control groups related to Intracranial Pressure ICPStudy(n 30)Mean SDControl(n 30)Mean SDP. valueICP Monitoring1st day22.7 2.9723.87 3.1nd2 day21.33 4.0522.93 2.563rd day19.67 4.5922.31 3.64th day18.7 1.8821.31 3.285th day17.75 2.2920.85 4.93- Independent t-test *Significant difference at p. value 0.05**.*Normal range of intracranial pressure monitoring in adults 10-15 mm Hg in adult patients.0.1430.0730.024**0.004**0.024*Table (5): Comparison between the Study and the control groups related to Glasgow come ScaleStudy(n 30)Mean SDGlasgow come Scale1st day5.00 3.84nd2 day5.20 3.753rd day5.53 3.73- Independent t-test * Significant difference at p. value 0.05**.Control(n 30)Mean SDP. value2.83 3.222.80 2.983.33 4.030.015*0.006**0.008**Table (6): Comparison between the study and the control groups related to length of stay of patientsin ICU.StudyNoControl%Length of ICU stayLess than 10 days2686.7From 10-20 days413.3More than 20 days00.06.13 4.81(3-20)Mean SD(range)Chi-square test,*Significant difference at p. value 0.05,Vol , (9) No, (25), Supplement June, 2021, pp (166-176)No%P .value826.7620.0 0.001**1653.329.46 20.69(3-70) 0.001****Significant difference at p. value 0.01172
Assiut Scientific Nursing JournalAbd El-ghani et al.,Fig (3): Comparison between the study and the control groups related to length of stay ofpatients in ICU.Table (7): Percent of distribution of the study and the control groups related to signs of infection:Study(n 30)No%Hyperthermia1st day2nd day3rd day4th dayHotness1st day2nd day3rd day4th dayRedness1st day2nd day3rd day4th daySecretion1st day2nd day3rd day4th dayTenderness1st day2nd day3rd day4th day- Chi-square test,Control(n 30)No%P. 01.0000.150-26.726.726.726.7*Significant difference at p. value 0.05,Vol , (9) No, (25), Supplement June, 2021, pp Significant difference at p. value 0.01173
Assiut Scientific Nursing JournalTable (1): Shows the mean of age in study andcontrolgroup(30.13 15.07and31.95 23)respectively. Show a highly percent of male patientsin study and control group were (66.7%) versus(80%) respectively, It show that there was nosignificant difference between two groups (p value 0.05), it show a highly percent of motor car accidentin control and study group were (86.7% and 80.0%)respectively. According to mortality rate it show therea statistical significant difference between the studyand control group were (86.7%) of study group aliveand (53.3%) of control group versus (13.3%) of studygroup death and (46.7%) of control grouprespectively.Fig (1): Shows a higher percent of study group(46.7%) of age from 30- 40 years and (46.7%) ofcontrol group from 18-30 years.Fig (2): Shows mortality rate were alive (86.7%) ofstudy group and (53.3%) of control group were death.According to mortality rate of death (46.7%) ofcontrol and (13.3%) of study group.Table (2): Shows hemodynamic status ( routine vitalsigns ) of study and control groups, According tobody temperature there were statistical significantdifference between study and control groups in the(3rd day ) and ( p value 0.029*). No significantdifference were found in the (1st and 2ndday) and (pvalue 0.05). According to pulse, it noticed that werestatistical significant difference between two groupsin three days (p value 0.05). According to systolicblood pressure , there were no statistical significantdifference between study and control group in thethree days(p value 0.05).According to diastolicblood pressure , there were statistical significantdifference between study and control group in the(2ndday ) ,(p value 0.006*) .According to respiratoryrate there were statistical significant differencebetween study and control group in three days ( pvalue 0.05). According to oxygen saturation, itnoticed that there on statistical difference betweenstudy and control group in three days (p value 0.05).Table (3): Shows WBC, there were a statisticalsignificant difference between study and controlgroup in three days (p value 0.05), According toRBC, there were no statistical significant difference(p value 0.05), According to Hemoglobin, therewere significant difference between study and controlgroup (p value 0.05). According to blood sugar,there were significant difference between study andcontrol group in the (2nd day and 3rd day) (p value0.017* and 0.012*) versus 1stday there were nostatistical significant difference (p value 0.05).Table (4): Shows ICP monitoring of study andcontrol group, that there were a statistical significantdifference between study and control group in the lastthree days (p 0.01) respectively .versus in first twoVol , (9) No, (25), Supplement June, 2021, pp (166-176)Abd El-ghani et al.,days there were no statistical significant differencebetween both group.Table (5): Shows Glasgow Coma Scale, were astatistical significant difference in three days andpatient not oriented (p value 0.05)Table (6): Shows mean of length of ICU stay inhospital (6.13 4.81 and 29.46 20.69) of study andcontrol group.Fig (3): Shows (86.7%) of study group from (lessthan 10 days) still in hospital versus (53.3%) ofcontrol group still (more than 20 days).Table (7): Shows hyperthermia , there were astatistical significant difference between two groupsin the last three days ( p value 0.05) , versus firstday there no a statistical significant differencebetween study and control group .related to redness,there were a statistical significant in the study andcontrol group in the (1stday and 2ndday) ( p value0.002** and 0.038*) versus in the (3 rdday and 4thday)( p value 0.05). Regarding hotness, secretion andtenderness, there was no a statistical significantdifference between the two groups ( p value 0.05 ).Discussion:Increased intracranial pressure (ICP) can be anindication of a brain tumors, an infection, or even asubarachnoid hemorrhage caused by a fall The brain,intravascular blood, and cerebrospinal fluid fill theskull (CSF). These components adjust to each otherthrough an auto-regulation process, resulting in aconstant ICP. When any of these quantities cease tobe regulated, pressure inside the skull increases,resulting in an increase in ICP. A temporary braindamage, long-term coma , or even death might occurif therapy is delayed or if intracranial pressure is notreduced. (Pinto, Tadi & Adeyinka 2019).Effect of nursing intervention on reducing infection inpatients undergoing intracranial pressure monitoring,including checking drainage for cloudiness and blood,watching for signs of infection such as fever, chills,and neck rigidity, and assessing any local signs ofinfection around the wound site of ICP placement.Such is a loss of function, Assess vital signs, securethe airway, ensure appropriate oxygenation andventilation, and provide circulatory support asneeded. Elevating the head of the bed to thirtydegrees, keeping the neck in a neutral position,maintaining a normal body temperature, and avoidingvolume overload are all ways to lower or stabilizeICP (Robin Haskell, 2020).The study aimed to minimize infection among thepatients who undergoing to intracranial pressuremonitoring.174
Assiut Scientific Nursing JournalThis discussion will cover the main result findingas follow:In terms of length of stay, the majority of the studygroup spent fewer than 10 days in the ICU, whereashalf of the control group spent more than 20 days.This is consistent with the findings of (Aiolfi, et al.,2017), who found that daily intervention improvedpatient health and reduced hospital stay.According to mortality rate ,The present study showsthat more than half of the patients from study groupwere alive versus nearly half patients of the controlgroup were death, This agree with ( Aiolfi et al.,2017) who reported that ICP monitoring utilizationwas associated with lower mortality rate and usingICP monitoring was linked to a decreased death rate.In terms of intracranial pressure monitoring, theresults of this observational study revealed that therewas a statistically significant difference in intracranialpressure monitoring between the study and controlgroups in the last three days of the study period. Thiscontrasts with (Aiolfi et al., 2017) who found thatvariability in ICP monitoring rates contributed onlymodestly to variability in ICP monitoring rates.(Mayhall et al., 2017) discovered a higher risk ofinfection in patients who had an ICP catheter in placefor more than 5 days or more of monitoring, and anincreased risk of infection occurred in our patients.(Lyons et al., 2016) discovered that the type ofintracranial pressure monitoring used had asignificant relationship with the development ofinfection. CNS infection with elevated cell counts incerebrospinal fluid can also induce greaterintracranial pressure, in addition to insertion of thecatheter having a higher incidence of infection due todeep brain penetration.In terms of signs of infection, there was a statisticalsignificance difference between the study and controlgroups in terms of signs of infection (hyperthermia)in moreover; there was a statistical significancedifference between the study and control groups interms of signs of infection, but the patients' conditionimproved, so this may be in the study group. This isin agreement with (Young et al., 2018). who reportedthat ICP monitoring placement site is a safe procedurewith a low-risk profile, ( Garner , et al., 2018 ) whoreport that CSF infection must have
Apply nursing intervention to minimize infection among patients with Intracranial monitoring in traumatic ICU unit. Keywords: Nursing care, Minimize Infection & Intracranial pressure. Introduction: The pressure which created inside the skull is called intracranial pressure (ICP), the pressure of brain tissue and cerebrospinal fluid (CSF).