Transcription
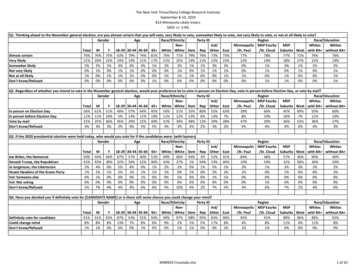
The New York Times/Siena College Research InstituteSeptember 8-10, 2020814 Minnesota Likely VotersMOE /- 3.9%Q1. Thinking ahead to the November general election, are you almost certain that you will vote, very likely to vote, somewhat likely to vote, not very likely to vote, or not at all likely to vote?GenderAgeRace/EthnicityParty IDRegionRace/EducationNonInd/Minneapolis MSP ExurbsMSPWhitesWhitesTotal MF 18-29 30-44 45-64 65 White White Dem Rep Other East/St. Paul/St. Cloud Suburbs West with BA without BA Almost certain76% 76% 75% 63% 79% 74% 81% 76%71% 79% 76% 73% 73%77%78%77%71%76%76%Very likely21% 20% 22% 33% 19% 21% 17% 21%25% 19% 21% 23% 23%22%19%18%27%22%19%Somewhat likely2%2%1%3%0%4%1%2%2%1%1%3%3%0%1%3%1%2%2%Not very likely0%1%0%1%1%0%0%0%1%0%1%1%1%0%1%0%1%0%1%Not at all likely1%0%1%1%1%0%0%1%1%1%0%0%1%1%0%1%0%0%1%Don't Q2. Regardless of whether you intend to vote in the November general election, would your preference be to vote in person on Election Day, vote in person before Election Day, or vote by mail?GenderAgeRace/EthnicityParty IDRegionRace/EducationNonInd/Minneapolis MSP ExurbsMSPWhitesWhitesTotal MF 18-29 30-44 45-64 65 White White Dem Rep Other East/St. Paul/St. Cloud Suburbs West with BA without BA In person on Election Day56% 61% 51% 49% 57% 64% 45% 56%51% 35% 80% 55% 63%39%66%45%69%50%60%In person before Election Day11% 11% 10% 5% 14% 11% 10% 11%12% 13% 6%13%7%8%10%16%7%11%10%Vote by mail31% 25% 36% 45% 29% 22% 40% 31%34% 48% 12% 29% 28%47%20%36%23%36%27%Don't Q3. If the 2020 presidential election were held today, who would you vote for if the candidates were: (with leaners)GenderAgeRace/EthnicityParty IDNonInd/Total MF 18-29 30-44 45-64 65 White White Dem Rep Other EastJoe Biden, the Democrat50% 44% 56% 67% 57% 40% 52% 49%60% 94% 3%52% 41%Donald Trump, the Republican41% 43% 38% 22% 34% 52% 40% 43%27%1% 94% 33% 49%Jo Jorgenson, the Libertarian2%4%0%5%4%0%1%2%2%0%1%5%1%Howie Hawkins of the Green Party1%1%1%2%1%1%1%1%0%1%0%2%2%Vol: Someone else0%1%0%0%0%1%0%0%1%0%0%1%1%Vol: Not voting0%0%0%0%0%0%0%0%0%0%0%0%0%Don't EducationMinneapolis MSP ExurbsMSPWhitesWhites/St. Paul/St. Cloud Suburbs West with BA without BA 0%1%0%0%2%0%0%0%0%0%0%0%1%0%0%0%0%3%6%7%2%4%6%Q4. Have you decided you ll definitely vote for [CANDIDATE NAME] or is there still some chance you could change your mind?GenderAgeRace/EthnicityParty IDNonInd/Total MF 18-29 30-44 45-64 65 White White Dem Rep Other EastDefinitely vote for candidate91% 91% 92% 87% 93% 91% 94% 90%97% 98% 95% 83% 90%Could change mind8%8%8% 13% 7%8%6%9%2%1%5%17%8%Don't ducationMinneapolis MSP ExurbsMSPWhitesWhites/St. Paul/St. Cloud Suburbs West with BA without BA 95%91%89%96%89%92%4%8%11%4%11%8%1%1%0%0%0%0%MN0920 Crosstabs.xlsx1 of 10
The New York Times/Siena College Research InstituteSeptember 8-10, 2020814 Minnesota Likely VotersMOE /- 3.9%Q5. If the 2020 U.S. Senate election were held today, who would you vote for if the candidates were:GenderAgeRace/EthnicityParty IDNonInd/Total MF 18-29 30-44 45-64 65 White White Dem Rep OtherTina Smith, the Democrat49% 46% 52% 54% 55% 41% 52% 47%59% 94% 4%47%Jason Lewis, the Republican40% 44% 36% 19% 38% 49% 38% 42%26%1% 90% 35%Vol: Someone else0%0%0%0%0%0%0%0%0%0%0%0%Vol: Not voting0%0%1%0%1%0%0%0%0%0%1%0%Don't know/Refused11% 11% 11% 27% 6% 10% 9%10%15%5%5%18%Q6. Do you approve or disapprove of the way Donald Trump is handling his job as president? Is that strongly or somewhat?GenderAgeRace/EthnicityParty IDNonInd/Total MF 18-29 30-44 45-64 65 White White Dem Rep OtherStrongly approve32% 35% 30% 20% 27% 40% 32% 33%27%4% 76% 23%Somewhat approve13% 13% 12% 12% 12% 15% 12% 13%9%1% 19% 16%Somewhat disapprove6%5%7% 15% 5%5%4%6%5%5%3%10%Strongly disapprove46% 42% 50% 51% 54% 38% 50% 45%55% 89% 1%45%Don't 13%RegionRace/EducationMinneapolis MSP ExurbsMSPWhitesWhites/St. Paul/St. Cloud Suburbs West with BA without BA e/EducationMinneapolis MSP ExurbsMSPWhitesWhites/St. Paul/St. Cloud Suburbs West with BA without BA %53%31%55%37%4%2%3%0%2%3%[Q7-Q11 ROTATED] Q7. I m going to read a few names of people or organizations in public life and I d like you to tell me whether you have a very favorable, somewhat favorable, somewhat unfavorable, orvery unfavorable impression of each?- Donald TrumpGenderAgeRace/EthnicityParty IDRegionRace/EducationNonInd/Minneapolis MSP ExurbsMSPWhitesWhites/St. Paul/St. Cloud Suburbs West with BA without BA Total MF 18-29 30-44 45-64 65 White White Dem Rep Other EastVery favorable31% 34% 28% 14% 26% 40% 30% 31%26%2% 74% 23% 36%10%39%22%48%23%38%Somewhat favorable14% 15% 13% 15% 14% 14% 14% 16%8%2% 22% 17% 20%4%16%12%17%12%18%Somewhat unfavorable6%7%5% 15% 5%5%4%6%11%6%3%9%3%3%5%10%6%7%4%Very unfavorable47% 42% 53% 55% 54% 39% 51% 47%52% 90% 1%48% 39%82%38%54%29%57%39%Don't Q8. I m going to read a few names of people or organizations in public life and I d like you to tell me whether you have a very favorable, somewhat favorable, somewhat unfavorable, or very unfavorableimpression of each?- Joe BidenGenderAgeRace/EthnicityParty IDRegionRace/EducationNonInd/Minneapolis MSP ExurbsMSPWhitesWhitesTotal MF 18-29 30-44 45-64 65 White White Dem Rep Other East/St. Paul/St. Cloud Suburbs West with BA without BA Very favorable30% 24% 35% 10% 30% 29% 41% 27%42% 67% 1%20% 25%37%24%36%23%31%25%Somewhat favorable22% 21% 23% 48% 28% 13% 16% 23%20% 27% 4%32% 19%38%19%24%15%30%17%Somewhat unfavorable13% 16% 10% 24% 10% 14% 8%13%11%4% 16% 18% 14%14%11%11%17%12%15%Very unfavorable33% 36% 30% 16% 30% 40% 33% 34%21%2% 74% 28% 38%9%44%27%41%26%41%Don't MN0920 Crosstabs.xlsx2 of 10
The New York Times/Siena College Research InstituteSeptember 8-10, 2020814 Minnesota Likely VotersMOE /- 3.9%Q9. I m going to read a few names of people or organizations in public life and I d like you to tell me whether you have a very favorable, somewhat favorable, somewhat unfavorable, or very unfavorableimpression of each?- Tina SmithGenderAgeRace/EthnicityParty IDRegionRace/EducationNonInd/Minneapolis MSP ExurbsMSPWhitesWhitesTotal MF 18-29 30-44 45-64 65 White White Dem Rep Other East/St. Paul/St. Cloud Suburbs West with BA without BA Very favorable21% 17% 25% 12% 20% 20% 30% 20%25% 47% 2%13% 18%35%17%23%14%24%18%Somewhat favorable27% 28% 27% 35% 31% 24% 25% 29%20% 35% 10% 35% 29%34%24%27%25%34%24%Somewhat unfavorable13% 18% 9%7% 14% 15% 11% 14%11%2% 25% 14% 13%6%17%12%16%14%13%Very unfavorable16% 17% 15% 3% 13% 22% 17% 17%9%1% 36% 15% 18%3%19%15%21%11%21%Don't know/Refused23% 20% 24% 42% 21% 18% 17% 21%34% 14% 27% 24% 21%22%23%22%25%17%24%Q10. I m going to read a few names of people or organizations in public life and I d like you to tell me whether you have a very favorable, somewhat favorable, somewhat unfavorable, or very unfavorableimpression of each?- Jason LewisGenderAgeRace/EthnicityParty IDRegionRace/EducationNonInd/Minneapolis MSP ExurbsMSPWhitesWhitesTotal MF 18-29 30-44 45-64 65 White White Dem Rep Other East/St. Paul/St. Cloud Suburbs West with BA without BA Very favorable18% 21% 16% 6% 12% 25% 21% 19%14%3% 42% 13% 20%2%27%15%23%15%22%Somewhat favorable22% 26% 19% 18% 28% 23% 16% 22%25%9% 35% 24% 22%7%25%26%23%19%24%Somewhat unfavorable12% 11% 13% 19% 10% 13% 9%13%5%17% 1%17% 11%14%12%12%13%17%10%Very unfavorable16% 15% 17% 9% 17% 14% 22% 17%11% 33% 1%12% 12%33%13%18%6%22%13%Don't know/Refused32% 28% 35% 48% 32% 25% 32% 29%45% 37% 21% 34% 35%44%23%29%35%27%30%Q11. I m going to read a few names of people or organizations in public life and I d like you to tell me whether you have a very favorable, somewhat favorable, somewhat unfavorable, or very unfavorableimpression of each?- The Black Lives Matter MovementGenderAgeRace/EthnicityParty IDRegionRace/EducationNonInd/Minneapolis MSP ExurbsMSPWhitesWhitesTotal MF 18-29 30-44 45-64 65 White White Dem Rep Other East/St. Paul/St. Cloud Suburbs West with BA without BA Very favorable30% 24% 36% 56% 37% 21% 22% 26%54% 59% 2%25% 29%61%18%32%16%33%21%Somewhat favorable23% 21% 24% 24% 20% 20% 29% 24%12% 29% 11% 27% 20%18%23%27%21%27%23%Somewhat unfavorable9% 11% 6%5%8% 10% 10% 10%2%2% 11% 13%8%4%10%9%10%10%9%Very unfavorable31% 36% 27% 11% 29% 41% 31% 33%24%4% 69% 28% 34%12%41%25%44%24%40%Don't [Q12-Q18 ROTATED] Q12. Regardless of how you might vote, tell me whether you trust Joe Biden or Donald Trump to do a better job on each of the following issues - The coronavirusGenderAgeRace/EthnicityParty IDRegionRace/EducationNonInd/Minneapolis MSP ExurbsMSPWhitesWhitesTotal MF 18-29 30-44 45-64 65 White White Dem Rep Other East/St. Paul/St. Cloud Suburbs West with BA without BA Joe Biden53% 49% 57% 67% 58% 45% 54% 51%65% 94% 4%57% 43%82%42%62%37%64%41%Donald Trump42% 45% 39% 26% 37% 52% 41% 45%26%3% 92% 36% 50%11%53%33%59%33%53%Don't MN0920 Crosstabs.xlsx3 of 10
The New York Times/Siena College Research InstituteSeptember 8-10, 2020814 Minnesota Likely VotersMOE /- 3.9%Q13. Regardless of how you might vote, tell me whether you trust Joe Biden or Donald Trump to do a better job on each of the following issues - The economyGenderAgeRace/EthnicityParty IDRegionRace/EducationNonInd/Minneapolis MSP ExurbsMSPWhitesWhitesTotal MF 18-29 30-44 45-64 65 White White Dem Rep Other East/St. Paul/St. Cloud Suburbs West with BA without BA Joe Biden46% 42% 51% 51% 54% 39% 50% 46%53% 87% 1%47% 40%74%39%52%31%57%37%Donald Trump49% 54% 44% 35% 43% 59% 46% 51%37%7% 98% 46% 56%13%58%44%66%40%59%Don't know/Refused5%4%5% 14% 3%2%5%4%10%6%0%7%4%13%3%4%3%4%4%Q14. Regardless of how you might vote, tell me whether you trust Joe Biden or Donald Trump to do a better job on each of the following issues - Handling the protestsGenderAgeRace/EthnicityParty IDRegionRace/EducationNonInd/Minneapolis MSP ExurbsMSPWhitesWhitesTotal MF 18-29 30-44 45-64 65 White White Dem Rep Other East/St. Paul/St. Cloud Suburbs West with BA without BA Joe Biden52% 48% 57% 65% 58% 45% 52% 50%64% 95% 5%54% 41%85%39%63%37%63%41%Donald Trump43% 47% 39% 27% 38% 52% 42% 45%30%2% 93% 39% 52%11%54%34%60%34%54%Don't Q15. Regardless of how you might vote, tell me whether you trust Joe Biden or Donald Trump to do a better job on each of the following issues - Race relationsGenderAgeRace/EthnicityParty IDRegionRace/EducationNonInd/Minneapolis MSP ExurbsMSPWhitesWhites/St. Paul/St. Cloud Suburbs West with BA without BA Total MF 18-29 30-44 45-64 65 White White Dem Rep Other EastJoe Biden56% 54% 59% 71% 63% 47% 56% 54%67% 97% 8%58% 50%85%44%64%40%66%46%Donald Trump38% 39% 36% 18% 31% 48% 39% 39%28%2% 89% 29% 44%11%49%28%56%31%46%Don't know/Refused6%7%5% 11% 6%5%5%6%6%1%3%12%6%4%7%8%4%3%9%Q16. Regardless of how you might vote, tell me whether you trust Joe Biden or Donald Trump to do a better job on each of the following issues - Violent crimeGenderAgeRace/EthnicityParty IDRegionRace/EducationNonInd/Minneapolis MSP ExurbsMSPWhitesWhitesTotal MF 18-29 30-44 45-64 65 White White Dem Rep Other East/St. Paul/St. Cloud Suburbs West with BA without BA Joe Biden50% 45% 56% 62% 60% 39% 50% 48%63% 94% 2%50% 43%79%41%56%34%59%39%Donald Trump45% 50% 41% 29% 38% 57% 44% 48%30%3% 97% 42% 53%12%56%38%63%38%56%Don't Q17. Regardless of how you might vote, tell me whether you trust Joe Biden or Donald Trump to do a better job on each of the following issues - Unifying AmericaGenderAgeRace/EthnicityParty IDRegionRace/EducationNonInd/Minneapolis MSP ExurbsMSPWhitesWhitesTotal MF 18-29 30-44 45-64 65 White White Dem Rep Other East/St. Paul/St. Cloud Suburbs West with BA without BA Joe Biden55% 51% 59% 65% 61% 48% 55% 54%63% 96% 9%56% 49%83%44%62%39%65%45%Donald Trump38% 40% 36% 22% 33% 46% 39% 39%29%2% 88% 29% 45%9%47%30%54%30%47%Don't know/Refused7%9%5% 13% 6%6%6%7%8%2%4%14%6%8%9%7%6%5%9%MN0920 Crosstabs.xlsx4 of 10
The New York Times/Siena College Research InstituteSeptember 8-10, 2020814 Minnesota Likely VotersMOE /- 3.9%Q18. Regardless of how you might vote, tell me whether you trust Joe Biden or Donald Trump to do a better job on each of the following issues - Maintaining law and orderGenderAgeRace/EthnicityParty IDRegionRace/EducationNonInd/Minneapolis MSP ExurbsMSPWhitesWhitesTotal MF 18-29 30-44 45-64 65 White White Dem Rep Other East/St. Paul/St. Cloud Suburbs West with BA without BA Joe Biden50% 43% 56% 59% 58% 40% 51% 48%59% 92% 2%52% 39%80%41%58%34%59%39%Donald Trump46% 52% 40% 33% 40% 56% 44% 48%34%6% 97% 42% 57%11%55%38%66%38%56%Don't Q19. What is the more important issue to you in the presidential race: [CHOICES ROTATED]GenderAgeAddressing the coronavirus pandemicAddressing law and orderDon't know/RefusedTotal M47% 45%48% 51%5%4%Race/EthnicityParty IDNonInd/F 18-29 30-44 45-64 65 White White Dem Rep Other East50% 62% 50% 40% 49% 47%49% 79% 10% 52% 37%45% 37% 45% 56% 44% 49%42% 18% 89% 43% apolis MSP ExurbsMSPWhitesWhites/St. Paul/St. Cloud Suburbs West with BA without BA 0. Do you think that your state is moving too quickly or too slowly to ease social distancing restrictions and reopen, or is it about right?GenderAgeRace/EthnicityParty IDRegionRace/EducationNonInd/Minneapolis MSP ExurbsMSPWhitesWhites/St. Paul/St. Cloud Suburbs West with BA without BA Total MF 18-29 30-44 45-64 65 White White Dem Rep Other EastToo quickly14% 12% 16% 31% 17% 8%8%12%22% 24% 6%11% 10%26%6%18%9%16%9%Too slowly30% 32% 28% 20% 30% 39% 23% 30%28%6% 60% 28% 35%15%40%24%38%23%35%About right53% 53% 54% 48% 51% 51% 63% 55%48% 68% 31% 59% 53%58%52%54%50%58%52%Don't Q21. What do you think is a bigger problem in America today? [CHOICES ROTATED]GenderAgeRiots in American citiesRacism in the criminal justice systemDon't know/RefusedTotal M42% 47%51% 47%7%6%Race/EthnicityParty IDNonInd/F 18-29 30-44 45-64 65 White White Dem Rep Other38% 17% 34% 52% 50% 44%31% 12% 77% 42%55% 78% 62% 42% 40% 50%61% 84% 13% 53%7%5%4%6% 10%6%9%4%9%6%MN0920 neapolis MSP ExurbsMSPWhitesWhites/St. Paul/St. Cloud Suburbs West with BA without BA 13%49%33%62%35%50%82%46%60%33%62%41%5%5%6%5%3%9%5 of 10
The New York Times/Siena College Research InstituteSeptember 8-10, 2020814 Minnesota Likely VotersMOE /- 3.9%Q22. And what comes closer to your view: [CHOICES ROTATED]GenderTotal MThe federal government’s priority should beto limit the spread of the coronavirus, even 51% 45%if it hurts the economyThe federal government’s priority should beto restart the economy, even if it increases 41% 47%the risk to public healthDon't know/Refused8%8%FAge18-29 30-44 45-64 65 Race/EthnicityParty IDNonInd/White White Dem Rep Other EastRegionRace/EducationMinneapolis MSP ExurbsMSPWhitesWhites/St. Paul/St. Cloud Suburbs West with BA without BA 7%9%3%7%7%13%7%12%7%9%8%11%9%10%8%4%4%9%Q23. (If city or urban) Do you support or oppose Zoning laws that prohibit the construction of duplexes, triplexes and apartments in neighborhoods with single-family homes?GenderAgeRace/EthnicityParty IDRegionNonInd/Minneapolis MSP ExurbsMSPTotal MF 18-29 30-44 45-64 65 White White Dem Rep Other East/St. Paul/St. Cloud SuburbsSupport34% 32% 36% 28% 35% 35% 34% 34%35% 34% 26% 37% 43%33%38%31%Oppose50% 55% 46% 46% 52% 53% 49% 49%50% 53% 55% 47% 48%56%44%51%Don't know/Refused16% 14% 18% 26% 13% 13% 17% 17%14% 13% 19% 17%9%11%18%18%Q24. (If city or urban) Do you support or oppose Government vouchers for lower-income families to live in more affluent communities?GenderAgeRace/EthnicityParty IDNonInd/Total MF 18-29 30-44 45-64 65 White White Dem Rep Other EastSupport62% 59% 64% 81% 76% 51% 48% 59%71% 84% 35% 53% 58%Oppose25% 29% 21% 9% 15% 37% 33% 27%18%9% 49% 30% 36%Don't know/Refused13% 12% 14% 11% 9% 13% 19% 14%11%7% 17% 17%7%West48%15%37%Race/EducationWhitesWhiteswith BA without BA 34%33%46%53%20%14%RegionRace/EducationMinneapolis MSP ExurbsMSPWhitesWhites/St. Paul/St. Cloud Suburbs West with BA without BA %15%(If city or urban) For each of the following, tell me whether you would be very concerned if it happened in your neighborhood, somewhat concerned, not very concerned, or not at all concerned if it happenedin your neighborhood? [Q25-Q27 ROTATED]Q25. New apartment constructionGenderAgeRace/EthnicityParty IDRegionRace/EducationNonInd/Minneapolis MSP ExurbsMSPWhitesWhitesTotal MF 18-29 30-44 45-64 65 White White Dem Rep Other East/St. Paul/St. Cloud Suburbs West with BA without BA Very concerned12% 10% 14% 7%9% 13% 20% 12%16%7% 19% 13% 18%9%7%14%24%9%15%Somewhat concerned20% 20% 19% 19% 14% 21% 25% 21%17% 19% 25% 18% 21%22%23%18%0%21%19%Not very concerned29% 26% 32% 32% 24% 35% 26% 32%16% 29% 30% 30% 35%27%39%24%72%31%34%Not at all concerned38% 44% 32% 43% 52% 30% 26% 35%48% 44% 25% 38% 24%40%29%43%0%38%31%Don't MN0920 Crosstabs.xlsx6 of 10
The New York Times/Siena College Research InstituteSeptember 8-10, 2020814 Minnesota Likely VotersMOE /- 3.9%Q26. A new subsidized housing developmentGenderVery concernedSomewhat concernedNot very concernedNot at all concernedDon't know/RefusedTotal12%26%28%31%3%M11%26%28%34%1%F 18-29 30-4412% 5%6%25% 20% 20%29% 44% 25%28% 30% 48%5%1%0%Q27. New residents with government housing vouchersGenderVery concernedSomewhat concernedNot very concernedNot at all concernedDon't 5-6413%33%29%24%2%65 21%29%25%19%7%Race/EthnicityNonWhite White12%11%28%19%31%19%27%46%3%4%65 19%28%28%23%2%Race/EthnicityNonWhite White11%12%21%15%33%20%31%48%3%5%AgeF 18-29 30-4411% 5%8%22% 12% 9%33% 39% 30%32% 43% 50%3%1%3%45-6412%29%28%28%4%Party apolis MSP ExurbsMSPWhitesWhites/St. Paul/St. Cloud Suburbs West with BA without BA gionRace/EducationMinneapolis MSP ExurbsMSPWhitesWhites/St. Paul/St. Cloud Suburbs West with BA without BA 4%53%21%34%4%39%24%4%2%4%0%2%3%Party 32%35%4%Q28. (If city or urban) Thinking about the kinds of homes in your neighborhood, would you say they re only single family homes, Mostly single family homes, Or mostly multi-family homes?GenderAgeRace/EthnicityParty IDRegionRace/EducationNonInd/Minneapolis MSP ExurbsMSPWhitesWhites/St. Paul/St. Cloud Suburbs West with BA without BA Total MF 18-29 30-44 45-64 65 White White Dem Rep Other EastSingle family homes23% 22% 25% 14% 21% 26% 29% 25%21% 17% 31% 23% 31%15%33%23%19%22%27%Mostly single family homes57% 58% 56% 58% 63% 57% 52% 59%49% 62% 54% 58% 58%58%58%56%77%60%59%Mostly multi-family homes15% 17% 13% 22% 13% 12% 15% 12%26% 18% 11% 14%7%25%6%15%0%14%11%Don't Q29. (If city or urban and female) Do you consider yourself a housewife, or do you not consider yourself a housewife?GenderAgeRace/EthnicityParty IDNonInd/Total MF 18-29 30-44 45-64 65 White White Dem Rep Other EastYes21% 0% 21% 2% 11% 23% 41% 23%11% 16% 30% 23% 52%No76% 0% 76% 95% 85% 77% 55% 74%85% 83% 60% 76% 48%Don't know/Refused3%0%3%3%4%0%4%3%5%1% 10%1%0%MN0920 Crosstabs.xlsxRegionMinneapolis MSP ExurbsMSP/St. Paul/St. Cloud Whiteswith BA without BA 13%32%83%67%4%1%7 of 10
The New York Times/Siena College Research InstituteSeptember 8-10, 2020814 Minnesota Likely VotersMOE /- 3.9%Q30. How would you describe the problem of crime in the United States today? Is it a major problem, minor problem, or not really a problem?GenderAgeRace/EthnicityParty IDRegionRace/EducationNonInd/Minneapolis MSP ExurbsMSPWhitesWhitesTotal MF 18-29 30-44 45-64 65 White White Dem Rep Other East/St. Paul/St. Cloud Suburbs West with BA without BA Major problem61% 57% 64% 48% 46% 68% 72% 62%53% 49% 78% 56% 65%36%64%63%63%49%72%Minor problem32% 35% 29% 43% 44% 27% 22% 32%32% 40% 19% 36% 26%49%33%28%32%43%24%Not really a t Q31. How would you describe the problem of crime in your area? Is it a major problem, minor problem, or not really a problem?GenderAgeRace/EthnicityParty IDNonInd/Total MF 18-29 30-44 45-64 65 White White Dem Rep Other EastMajor problem13% 15% 10% 13% 12% 13% 12% 11%21% 11% 14% 13%9%Minor problem42% 39% 45% 39% 44% 43% 41% 44%36% 46% 40% 40% 45%Not really a problem45% 45% 44% 48% 43% 44% 45% 45%43% 43% 45% 47% 45%Don't ducationMinneapolis MSP ExurbsMSPWhitesWhites/St. Paul/St. Cloud Suburbs West with BA without BA 44%1%0%1%0%0%1%Q32. How would you describe the problem of lawlessness and unrest in the United States today? Is it a major problem, minor problem, or not really a problem?GenderAgeRace/EthnicityParty IDRegionRace/EducationNonInd/Minneapolis MSP ExurbsMSPWhitesWhitesTotal MF 18-29 30-44 45-64 65 White White Dem Rep Other East/St. Paul/St. Cloud Suburbs West with BA without BA Major problem61% 59% 62% 47% 49% 71% 66% 61%59% 45% 82% 57% 66%33%68%60%68%53%68%Minor problem27% 28% 27% 40% 31% 21% 27% 28%28% 37% 13% 32% 24%38%27%27%24%32%24%Not really a problem10% 12% 8% 13% 19% 6%4%9%11% 16% 3%10%5%27%6%10%8%13%6%Don't Q33. How would you describe the problem of lawlessness and unrest in your area? Is it a major problem, minor problem, or not really a problem?GenderAgeRace/EthnicityParty IDRegionRace/EducationNonInd/Minneapolis MSP ExurbsMSPWhitesWhites/St. Paul/St. Cloud Suburbs West with BA without BA Total MF 18-29 30-44 45-64 65 White White Dem Rep Other EastMajor problem14% 16% 12% 13% 13% 15% 11% 12%23% 13% 18% 10%6%17%16%18%9%10%13%Minor problem30% 29% 32% 27% 29% 30% 34% 31%33% 33% 29% 31% 30%41%26%26%36%28%33%Not really a problem55% 55% 54% 58% 56% 54% 53% 57%42% 54% 52% 57% 61%41%58%55%53%61%53%Don't MN0920 Crosstabs.xlsx8 of 10
The New York Times/Siena College Research InstituteSeptember 8-10, 2020814 Minnesota Likely VotersMOE /- 3.9%Q34. Of the following three options that have been proposed for police funding, which do you most support: [CHOICES ROTATED]GenderAgeRace/EthnicityParty IDNonInd/Total MF 18-29 30-44 45-64 65 White White Dem Rep OtherDefund the police20% 17% 22% 51% 30% 10% 5%17%33% 36% 2%20%Maintain police funding at current levels41% 42% 41% 32% 36% 42% 51% 42%37% 45% 38% 41%Increase police funding37% 38% 35% 16% 33% 44% 39% 39%27% 16% 59% 38%Don't %RegionRace/EducationMinneapolis MSP ExurbsMSPWhitesWhites/St. Paul/St. Cloud Suburbs West with BA without BA inneapolis MSP ExurbsMSPWhitesWhites/St. Paul/St. Cloud Suburbs West with BA without BA %15%Ind/Rep Other East6%56% 48%89% 37% 47%5%7%5%RegionRace/EducationMinneapolis MSP ExurbsMSPWhitesWhites/St. Paul/St. Cloud Suburbs West with BA without BA 5. Do you think Joe Biden supports defunding the police, or do you think Joe Biden opposes defunding the police?GenderAgeRace/EthnicityParty IDNonInd/Total MF 18-29 30-44 45-64 65 White White Dem Rep OtherJoe Biden supports defunding the police44% 46% 43% 41% 47% 48% 38% 44%48% 24% 68% 44%Joe Biden opposes defunding the police40% 41% 40% 35% 41% 39% 46% 41%37% 63% 16% 42%Don't know/Refused16% 13% 17% 24% 13% 13% 16% 16%14% 14% 16% 15%Q36. Do you think President Trump has encouraged violence in America, or discouraged violence in America?GenderAgeRace/EthnicityNonTotal MF 18-29 30-44 45-64 65 White WhiteEncouraged violence in America54% 49% 59% 73% 61% 45% 52% 52%67%Discouraged violence in America41% 45% 38% 25% 35% 50% 43% 44%27%Don't know/Refused5%6%3%2%4%6%5%4%6%Party IDDem95%4%1%Q37. Do you think that Joe Biden has done enough to condemn violent rioting, or do you think Joe Biden hasn t done enough to condemn violent rioting?GenderAgeRace/EthnicityParty IDRegionRace/EducationNonInd/Minneapolis MSP ExurbsMSPWhitesWhitesTotal MF 18-29 30-44 45-64 65 White White Dem Rep Other East/St. Paul/St. Cloud Suburbs West with BA without BA Done enough to condemn violent rioting35% 31% 38% 45% 39% 26% 37% 33%42% 62% 5%35% 32%67%25%35%25%41%26%Hasn't done enough to condemn violent54% 60% 49% 41% 52% 64% 51% 57%45% 28% 87% 52% 55%25%61%55%68%47%64%riotingDon't know/Refused11% 9% 13% 14% 9%9% 13% 11%13% 11% 8%12% 13%8%14%11%8%12%10%MN0920 Crosstabs.xlsx9 of 10
The New York Times/Siena College Research InstituteSeptember 8-10, 2020814 Minnesota Likely VotersMOE /- 3.9%Nature of the SampleMinnesota Likely VotersGenderMaleFemaleAge18 to 2930 to 4445 to 6465 and olderRace/EthnicityWhiteNon-WhiteParty egionEastMinneapolis /St. PaulMSP Exurbs /St. CloudMSP SuburbsWestRace & EducationWhites with Bachelor's degree or higherWhites with less than Bachelor's degreeEducationHigh school or lessSome CollegeBachelor's degreeGraduate degree2016 VoteHillary ClintonDonald TrumpOtherDidn't 6%36%46%23%32%29%15%38%41%7%10%MN0920 Crosstabs.xlsx10 of 10
The New York Times/Siena College Research InstituteSeptember 8-11, 2020445 New Hampshire Likely VotersMOE /-5.5%Q1. Thinking ahead to the November general election, are you almost certain that you will vote, very likely to vote, somewhatlikely to vote, not very likely to vote, or not at all likely to vote?GenderAgeParty IDRace/EducationInd/ WhitesWhitesTotal MF 18-44 45-64 65 Dem Rep Other with BA without BA Almost certain74% 73% 77% 66% 83% 73% 81% 74% 72%79%72%Very likely22% 24% 21% 29% 15% 23% 19% 24% 22%21%23%Somewhat likely2%2%2%3%1% 2% 0% 1%3%0%3%Not very likely0%1%0%1%0% 0% 0% 0%1%0%1%Not at all likely0%1%0%0%0% 1% 0% 0%1%0%1%Don't know/Refused1%0%0%0%0% 1% 0% 1%0%0%0%Q2. Regardless of whether you intend to vote in the November general election, would your preference be to vote in person onElection Day, vote in person before Election Day, or vote by mail?GenderAgeParty IDRace/EducationInd/ WhitesWhitesTotal MF 18-44 45-64 65 Dem Rep Other with BA without BA In person on Election Day69% 74% 65% 71% 75% 56% 55% 85% 69%63%77%In person before Election Day5%4%5%4%7% 4% 4% 5%5%5%2%Vote by mail22% 18% 27% 23% 15% 37% 40% 8% 22%30%17%Don't know/Refused4%3%3%3%3% 4% 1% 3%4%2%4%Q3. If the 2020 presidential election were held today, who would you vote for if the candidates were: (with leaners)GenderAgeParty IDRace/EducationInd/ WhitesWhitesTotal MF 18-44 45-64 65 Dem Rep Other with BA without BA Joe Biden, the Democrat45% 36% 54% 47% 41% 48% 94% 12% 41%65%35%Donald Trump, the Republican42% 51% 35% 37% 51% 41% 3% 84% 41%29%49%Jo Jorgenson, the Libertarian4%6%2%8%3% 1% 0% 0%7%1%7%Vol: Someone else1%1%1%1%0% 3% 0% 0%2%1%1%Vol: Not voting1%0%1%1%1% 0% 0% 0%0%1%0%Don't know/Refused7%6%7%6%4% 8% 3% 4%9%3%9%NH0920 Crosstabs.xlsx1 of 5
The New York Times/Siena College Research InstituteSeptember 8-11, 2020445 New Hampshire Likely VotersMOE /-5.5%Q4. Have you decided you ll definitely vote for [CANDIDATE NAME] or is there still some chance you could change your mind?GenderAgeParty IDRace/EducationInd/ WhitesWhitesTotal MF 18-44 45-64 65 Dem Rep Other with BA without BA Definitely vote for candidate91% 88% 94% 91% 91% 93% 99% 96% 85%94%90%Could change mind8% 12% 5%8%9% 7% 1% 4% 13%6%9%Don't know/Refused1%0%1%1%0% 0% 0% 0%1%0%1%Q5. Do you approve or disapprove of the way Donald Trump is handling his job as president? Is that strongly or somewhat?GenderAgeParty IDRace/EducationInd/ WhitesWhitesTotal MF 18-44 45-64 65 Dem Rep Other with BA without BA Strongly approve35% 42% 28% 30% 42% 33% 6% 77% 30%23%43%Somewhat approve10% 13% 7% 13% 9% 7% 0% 9% 13%7%8%Somewhat disapprove7%6%9%7%8% 6% 4% 4% 11%6%9%Strongly disapprove46% 36% 55% 47% 40% 51% 89% 9% 45%63%38%Don't know/Refused3%3%1%2%1% 2% 1% 1%2%1%2%[Q6-Q8 ROTATED] Q6. I m going to read a few names of people or organizations in public life and I d like you to tell me whetheryou have a very favorable, somewhat favorable, somewhat unfavorable, or very unfavorable impression of each? - Donald TrumpGenderAgeParty IDRace/EducationInd/ WhitesWhitesTotal MF 18-44 45-64 65 Dem Rep Other with BA without BA Very favorable35% 43% 29% 32% 42% 34% 5% 79% 30%22%43%Somewhat favorable10% 13% 7% 12% 9% 9% 1% 8% 14%8%10%Somewhat unfavorable7%8%6%9%6% 4% 4% 2% 10%4%8%Very unfavorable46% 35% 57% 47% 42% 51% 89% 9% 46%65%38%Don't know/Refused2%1%1%0%1% 3% 2% 2%0%0%1%NH0920 Crosstabs.xlsx2 of 5
The New York Times/Siena College Research InstituteSeptember 8-11, 2020445 New Hampshire Likely VotersMOE /-5.5%Q7. I m going to read a few names of people or organizations in public life and I d like you to tel
The New York Times/Siena College Research Institute September 8-10, 2020 814 Minnesota Likely Voters MOE /- 3.9% Total M F 18-29 30-44 45-64 65 White Non-White Dem Rep Ind/ Other East . If the 2020 presidential election were held today, who would you vote for if the candidates were: (with leaners)