Transcription
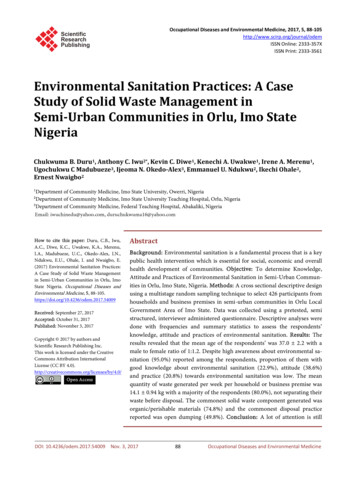
Occupational Diseases and Environmental Medicine, 2017, 5, 88-105http://www.scirp.org/journal/odemISSN Online: 2333-357XISSN Print: 2333-3561Environmental Sanitation Practices: A CaseStudy of Solid Waste Management inSemi-Urban Communities in Orlu, Imo StateNigeriaChukwuma B. Duru1, Anthony C. Iwu2*, Kevin C. Diwe1, Kenechi A. Uwakwe1, Irene A. Merenu1,Ugochukwu C Madubueze3, Ijeoma N. Okedo-Alex3, Emmanuel U. Ndukwu2, Ikechi Ohale2,Ernest Nwaigbo2Department of Community Medicine, Imo State University, Owerri, NigeriaDepartment of Community Medicine, Imo State University Teaching Hospital, Orlu, Nigeria3Department of Community Medicine, Federal Teaching Hospital, Abakaliki, Nigeria12How to cite this paper: Duru, C.B., Iwu,A.C., Diwe, K.C., Uwakwe, K.A., Merenu,I.A., Madubueze, U.C., Okedo-Alex, I.N.,Ndukwu, E.U., Ohale, I. and Nwaigbo, E.(2017) Environmental Sanitation Practices:A Case Study of Solid Waste Managementin Semi-Urban Communities in Orlu, ImoState Nigeria. Occupational Diseases andEnvironmental Medicine, 5, ived: September 27, 2017Accepted: October 31, 2017Published: November 3, 2017Copyright 2017 by authors andScientific Research Publishing Inc.This work is licensed under the CreativeCommons Attribution InternationalLicense (CC BY en AccessAbstractBackground: Environmental sanitation is a fundamental process that is a keypublic health intervention which is essential for social, economic and overallhealth development of communities. Objective: To determine Knowledge,Attitude and Practices of Environmental Sanitation in Semi-Urban Communities in Orlu, Imo State, Nigeria. Methods: A cross sectional descriptive designusing a multistage random sampling technique to select 426 participants fromhouseholds and business premises in semi-urban communities in Orlu LocalGovernment Area of Imo State. Data was collected using a pretested, semistructured, interviewer administered questionnaire. Descriptive analyses weredone with frequencies and summary statistics to assess the respondents’knowledge, attitude and practices of environmental sanitation. Results: Theresults revealed that the mean age of the respondents’ was 37.0 2.2 with amale to female ratio of 1:1.2. Despite high awareness about environmental sanitation (95.0%) reported among the respondents, proportion of them withgood knowledge about environmental sanitation (22.9%), attitude (38.6%)and practice (20.8%) towards environmental sanitation was low. The meanquantity of waste generated per week per household or business premise was14.1 0.94 kg with a majority of the respondents (80.0%), not separating theirwaste before disposal. The commonest solid waste component generated wasorganic/perishable materials (74.8%) and the commonest disposal practicereported was open dumping (49.8%). Conclusion: A lot of attention is stillDOI: 10.4236/odem.2017.54009 Nov. 3, 201788Occupational Diseases and Environmental Medicine
C. B. Duru et al.required in the development of basic sanitation infrastructure and also, in thepromotion of strategies or interventions that influence behavioural changetowards environmental sanitation especially in developing countries like Nigeria.KeywordsKnowledge, Attitude, Practice, Environmental Sanitation,Sold Waste Management, Nigeria1. IntroductionEnvironmental sanitation is a set of actions or a fundamental process of collecting and safely disposing all kinds of waste within the environment with the intention of protecting and promoting the individual health and quality of life ofcommunities. Environmental sanitation generally includes the provision of facilities and services for the safe disposal of waste, the maintenance of hygienic conditions and the prevention of diseases [1]. So it is a key public health intervention that is essential for social and economic development especially in developing countries. This leads to the improvement of health, well-being and economicproductivity and benefits the individual, household and community through theprovision and practice of adequate sanitation, good hygiene and the use of safewater [2] [3].In 2012, a study conducted by World Health Organization reported that, therewas a return of 5.5 USD with respect to lower health costs, more productivityand fewer premature deaths for every 1 USD invested in sanitation [4]. Though,since 1990, there has been an improvement in sanitation with the proportion ofpeople having access increasing from 54% to 68%, the Millennium DevelopmentGoal target by 2015 was not achieved, as up to 700 million people remaining toattain the target, were still without adequate sanitation [4].About 10% of the global burden of disease and one third of all annual deathsin low- and middle-income countries resulting from inadequate water, sanitation, and hygiene is believed to be due to poor sanitation [3] [4]. Furthermore, acorrelation has also been observed between poverty, child infancy and diseasesthat are associated with poor sanitation; hence, especially in developing countries with inadequate sanitation which poses a significant public health risk,children in particular are most vulnerable to ill health [5]. Therefore, interventions targeted at sanitation improvements can significantly enhance health andwellbeing of the population by preventing, reducing the severity and impact ofdiseases associated with poor sanitation [6].A key culprit of poor sanitation is diarrhoeal disease which is a significantgroup of feco-oral diseases that has substantial impact on the mortality patternsin children especially under the age of 3 years. Consequently, a study in Brazilalso concluded that, introducing interventions geared towards improving sanitaDOI: 10.4236/odem.2017.5400989Occupational Diseases and Environmental Medicine
C. B. Duru et al.tion and household living conditions will significantly decrease the incidence ofdiarrhoeal diseases and its’ impact on health especially in children [7]. Poor sanitation has also been linked to acute respiratory infections [8], malnutrition [9]and in particular, neglected tropical diseases such as trachoma, soil-transmittedhelminthiases and schistosomiasis; as many of these diseases can be transmittedfeco-orally [3] [10].In developing countries, majority of people in the rural communities lack sanitation and even with urbanization, the provision of improved sanitation remains a continuous challenge due to the inability to cope with the associated increase in population as communities move from rural, semi urban to urban development [3]. Also according to Daramola [11], the population growth in Nigerian cities is not accompanied by a corresponding increase in the provision ofenvironmental sanitation facilities. So in addressing these challenges of sanitation in the semi urban and urban communities, the provision of sanitation infrastructure serves only as a means to an end, as the attitude and behaviour ofthe individuals, households and community as a whole, determines the end [12].Now, the trend in the promotion of sanitation is progressively moving fromthe emphasis on centrally planned sanitation infrastructure to a demand led approach that empowers people to change behaviour and improve their own sanitation [3]. In this regard, simple health interventions such as hygiene and sanitation promotion in the prevention of diarrhoea have been central to the demandled approaches such as sanitation marketing, community led total sanitation andcommunity health clubs; which begins with, and it is based on influencingpeoples’ attitude, what they know, do and want [13]. These interventions havealso been successful and cost effective globally with respect to the cost of averting occurrences of morbidity and mortality [14].Hence, the foundation for a successful demand led approach will be achievedmainly through strategies that improve knowledge, attitude and motivate thepractice of safe sanitation by the individual; which is an important and effectiveapproach in attaining better and sustainable sanitation within the householdsand communities. So this study sets out to determine the knowledge, attitudeand practices of environmental sanitation in semi-urban communities with aview to designing specific strategies that targets behavioural change by improving their knowledge and attitude towards sanitation.2. Methodology2.1. Study AreaThe study was conducted within semi-urban communities in Orlu Local Government Area (LGA) which is one of the twenty seven LGAs of Imo State in theSouth Eastern zone of Nigeria. Orlu LGA which is made up of 10 autonomouscommunities, is predominantly a semi-urban area covering 133 sq km with anestimated population of 142,792 and a population density of about 1074 personsper square kilometre according to the 2006 national census [15].DOI: 10.4236/odem.2017.5400990Occupational Diseases and Environmental Medicine
C. B. Duru et al.2.2. Study Population/Study Design/Selection CriteriaThe study population comprised households and business premises within thesemi-urban communities in Orlu LGA. The study was a descriptive cross sectional type. The criteria for selection was any individual aged 20 years and abovefrom a household or business premise within the selected communities and hadlived in the study area for at least one year. The selected individual was subsequently enrolled after informed consents were given. Any individual selected,that was unable to participate due to health issues was excluded.2.3. Sample Size EstimationThe minimum sample size was calculated using the Cochrane formula [16]n Z2 pqd2When n minimum sample size, Z Standard normal deviate corresponding to5% significance level, p proportion of the target population that had a moderate to good standard of practice relating to environmental sanitation (49%)[17], q 1 p (1 0.49 0.51), d tolerable error of margin set at 0.05, Z 1.96.Applying the formula above, and adjusting for incomplete and non-response rate, asample size of 426 participants were studied.2.4. Sampling TechniqueThe sampling technique used to select the participants for this study was themultistage random sampling technique. The first stage involved the selection ofthe communities that were studied. This was done using simple random sampling by balloting of which 3 semi-urban communities were selected from a listof 6 semi-urban autonomous communities that are part of the 10 communities(rural and semi-urban) that make up Orlu LGA. The second stage involved using simple random sampling by balloting to select two enumeration areas fromeach of the 3 selected semi-urban autonomous communities based on the Nigerian 2006 census enumeration area delineation. The third stage involved the selection of one participant from the individual household or business premisewithin the selected enumeration areas in the respective communities.In each enumeration area within a particular community, a prominent location was identified and moving in a particular direction, each consecutivehousehold or business premise was enrolled until 71 households and or businesspremises were selected. A total of 426 households and business premises wereselected from the six enumeration areas within the respective communities. Ifthere were more than one individual aged 20 years and above present in anyhousehold or business premise, balloting was done to select and enrol one eligible individual after an informed consent. Any household or business premisewithout an eligible individual present after two repeat visits or had only oneadult individual present, who had not lived in the area for at least one year wasDOI: 10.4236/odem.2017.5400991Occupational Diseases and Environmental Medicine
C. B. Duru et al.skipped.2.5. Data Collection and AnalysisData was collected within a two month period from February to March 2016 using a pretested, semi structured, interviewer administered questionnaire. Thequestionnaire was developed by the researchers and pretested in another community in the LGA not selected for the study. The content validity was established qualitatively assessing each question against the intended construct. Thequestionnaire comprised 4 sections; section one: the socio-demographic andhousehold characteristics; section two: the awareness and knowledge of environmental sanitation; section three: attitude towards environmental sanitationand section four: environmental sanitation practices and self-assessment ofcommunity sanitation.The level of knowledge and practice of environmental sanitation was determined by scoring the questions that assessed knowledge or practice. For a singleresponse question, an appropriate answer was scored 2; an inappropriate answerwas scored 0. For a multiple response question, up to 2 appropriate answers wasscored 1; from 3 to 5 appropriate answers was scored 3 and greater than 5 appropriate answers was scored 5. In assessing the level of attitude towards environmental sanitation, a Likert scale was used. For a positive question, a responsefrom strongly agree to strongly disagree, a score from 5 to 1 was allocated accordingly and for a negative question, a response of “strongly disagree” to “stronglyagree”, a score from 5 to 1 was allocated accordingly. The aggregate scores foreach respondent according to the level of knowledge, attitude and practice ofenvironmental sanitation were translated to a percentage and assessed against ascale of less than 60% for poor, 60% - 80% for moderate and greater than 80%for good. For the self-assessment of community sanitation, each respondent wasasked to rate the level of environmental sanitation in their respective communities as good, moderate or poor.Data was cleaned and validated manually, then using Software Package forSocial Sciences (IBM-SPSS) version 22, descriptive statistics (frequency tablesand summary indices) were generated to assess the respondents’ knowledge, attitude and practices of environmental sanitation.2.6. Ethical ConsiderationsEthical approval was obtained from the Ethics Committee of Imo State University Teaching Hospital Orlu. Informed consents were obtained from the participants. All authors hereby declare that the study was performed in accordancewith the ethical standards laid down in the 1964 Declaration of Helsinki.3. ResultsFour hundred and twenty six copies of the questionnaire were administered but420 copies were completely and correctly filled with a response rate of 98.6%.DOI: 10.4236/odem.2017.5400992Occupational Diseases and Environmental Medicine
C. B. Duru et al.3.1. Socio-Demographic and Household Characteristics ofRespondents in Semi-Urban Communities in Orlu LGAThe mean age of the respondents was 37.0 2.2 years with most of them beingof Igbo extraction (93.6%). Majority of the respondents were females (55.2%),married or separated (58.8%), having either no education or a primary level ofeducation (51.9%) and half of the respondents were of the Christian catholicfaith (50.0%). Majority of the respondents were living in either a one, two orthree bedroom flat (60.0%) with 6 or more household occupants (59.5%) andhaving a borehole as their main source of water supply (55.7%). A sizable proportion of the households (35.5%) practice open defecation (Table 1).3.2. Awareness and Knowledge of Environmental Sanitationamong Respondents in Semi-Urban Communities in Orlu LGAMost of respondents were aware about environmental sanitation (95.0%) andmajority of them, got their information about sanitation from the mass mediasuch as the television (59.1%) and the radio (56.6%); and next, from communitymeetings (41.4%). While a majority of the respondents (73.7%) indicated thatthe objective of environmental sanitation was to promote health, close to 10%indicated that it was to avoid contact with people. Also, while a majority of therespondents indicated that waste disposal (83.7%) and hand washing (74.2%)constitutes appropriate environmental sanitation, less than half indicated thatsewage disposal (46.4%) and the provision of safe water (35.8%) constitutes appropriate environmental sanitation. Similarly, while a majority of respondentsregarded open dumping as an appropriate waste disposal method (68.9%), onlyless than half regarded sanitary land fill (41.3%) and incineration (37.4%) as appropriate methods. Though, infection was reported as a result of inappropriatesanitation practices by a majority of the respondents (72.7%), providing a placefor criminal hideouts was also reported by as high as 21% of the respondents(Table 2).Generally, a majority of the respondents (60.0%) had an overall moderate level of knowledge about environmental sanitation with only less than one quarter(22.9%) having an overall good level of knowledge (Figure 1).3.3. Attitude towards Environmental Sanitation amongRespondents in Semi-Urban Communities in Orlu LGAA majority of the respondents either agreed or strongly agreed that surfaces andfloors should be washed with clean water regularly (77.6%), that it is necessary todig pit toilets at a distance away from wells (69.0%), that factories should be located outside the populated communities (65.0%), that solid waste should bedisposed daily (61.2%), that all communities should have a day for generalclean-up (85.0%) and that community sanitation should be taught in schools(80.2%). As high as 17% - 30% of the respondents were either undecided, agreedor strongly agreed that solid waste could be thrown into the stream (21.4%), thatDOI: 10.4236/odem.2017.5400993Occupational Diseases and Environmental Medicine
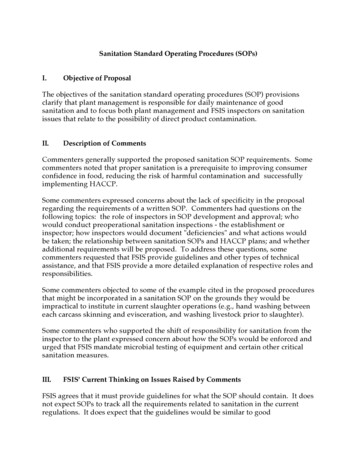
C. B. Duru et al.Table 1. Socio-demographic and household characteristics of respondents in semi-urbancommunities in Orlu.VariableCategoryFrequency (%)n 420Age (years)Mean age (37.0 2.2)20 - 3031 - 40 40105 (25.0)126 (30.0)189 (45.0)GenderFemaleMale232 (55.2)188 (44.8)TribeIgboNon-Igbo393 (93.6)27 (6.4)ReligionCatholicPentecostalOrthodoxOthers210 (50.0)147 (35.0)57 (13.5)6 (1.5)Marital statusMarriedSingleSeparated209 (49.8)173 (41.2)38 (9.0)Educational levelTertiarySecondaryPrimaryNone159 (37.9)43 (10.2)201 (47.9)17 (4.0)Type of HouseDuplexBungalow3 bed room flat2 bed room flat1 bed room flat61 (14.5)107 (25.5)103 (24.5)84 (20.0)65 (15.5)Household size1-56 - 10 10BoreholeStream and riversTanker supplyPublic supplyRain water170 (40.5)145 (34.5)105 (25.0)234 (55.7)105 (25.0)41 (9.8)22 (5.2)18 (4.3)Water closetOpen defecationPit toilet252 (60.0)149 (35.5)19 (4.5)Main source of waterToilet facilitiesurination and defecation could be done near wells (17.1%), that sewage could bedischarged into the stream (30.0%) and that solid waste could be spread aroundthe compound to decay naturally (30.0%). A majority of the respondents wereundecided, disagreed or strongly disagreed that all waste bins should have covers(55.0%). Also a majority of the respondents were undecided, agreed or stronglyagreed that open waste bins could be kept in the kitchen (60.0%) and that it isunnecessary to separate waste before disposal (80.0%) (Table 3).DOI: 10.4236/odem.2017.5400994Occupational Diseases and Environmental Medicine
C. B. Duru et al.Table 2. Awareness and knowledge of environmental sanitation among respondents insemi-urban communities in Orlu.VariableCategoryFrequency (%)Have you heard about environmental YessanitationNo(n 420)399 (95.0)21 (5.0)*Sources of information(n 399)TelevisionRadioCommunity meetingsHealth sPoster/sign boardsinternetSanitation agencies236 (59.1)226 (56.6)165 (41.4)129 (32.3)109 (27.3)101 (25.3)91 (22.8)77 (19.3)62 (15.5)43 (10.8)20 (5.0)*What is the objective ofEnvironmental Sanitation?(n 399)Promoting healthPreventing diseasesPersonal cleanlinessAvoid contact with people294 (73.7)189 (47.4)46 (11.5)38 (9.5)*What constitutes appropriateEnvironmental Sanitation?(n 399)Waste disposalHand washingSafe guarding foodSewage disposalProvision of safe waterProvision of good housing334 (83.7)296 (74.2)256 (64.2)185 (46.4)143 (35.8)25 (6.3)*Types of appropriate waste disposal Open dumpingmethods known (n 334)Sanitary land fillIncineration/burningRecyclingHog feedingComposting230 (68.9)138 (41.3)125 (37.4)99 (29.6)68 (20.4)62 (18.6)*Consequences of inappropriatesanitation practices(n 399)290 (72.7)277 (69.4)269 (67.4)254 (63.7)229 (57.4)228 (57.1)83 (20.8)Causes infectionUnhealthy living conditionsBlocks drainagesPollutes water bodiesProvides breeding sitesCauses injuriesProvides criminal hideoutsGenerally, a majority of the respondents (55.4%) had an overall moderate level of positive attitude towards environmental sanitation with only above onethird having an overall good level of positive attitude (38.6%) (Figure 2).3.4. Environmental Sanitation Practices among Respondents inSemi-Urban Communities in Orlu LGAAbout three quarters of the respondents mainly generate, organic and perishablesolid waste (74.8%) and a majority of the respondents generate 5 - 20 kg of solidDOI: 10.4236/odem.2017.5400995Occupational Diseases and Environmental Medicine
C. B. Duru et al.Level of KnowledgeNumber of 17.1%Poor0Figure 1. Overall level of knowledge of Sanitation among respondents in semi-urbanCommunities in Orlu.Level of positive attitudeNumber of %Poor0Figure 2. Overall level of positive attitude towards Sanitation among respondents insemi-urban communities in Orlu.waste per household or business premise per week (71.4%) with an averagewaste generated per person per week of 2.69 kg. Even though a majority of therespondents store their waste using covered bins (55.0%), as high as 22% - 30%of the respondents still store their waste either by dumping openly (30.2%) or byusing uncovered bins (27.6%) or baskets (22.6%) with close to half of the respondents disposing their waste 2 - 3 times per week (48.1%). A majority of therespondents use wheel barrows and head pans (73.8%) to transport their wasteto the dump site and do not pay any form of dues for waste disposal (80.2%). Amajority of the respondents either reported that the community did not have adesignated central area for waste disposal or did not know of its existence in thecommunity (65.3%) and commonest form of waste disposal practiced by household was open dumping, (49.8%). A majority of the respondents reported nothaving public toilets in their communities (59.8%) but close to half of the respondents reported having a health committee (50.7%). A majority of the respondents reported either not being visited by sanitary inspectors or not knowingDOI: 10.4236/odem.2017.5400996Occupational Diseases and Environmental Medicine
C. B. Duru et al.Table 3. Attitude towards environmental sanitation among respondents in Semi-urbancommunities in Orlu.CategoryFrequency (%)(n 420)Surfaces and floors should be washed withclean water regularly?Strongly AgreeAgreeUndecidedDisagreeStrongly disagree210 (50.0)116 (27.6)79 (18.8)10 (2.4)5 (1.2)Solid waste could be thrown into the streamStrongly AgreeAgreeUndecidedDisagreeStrongly disagree6 (1.4)62 (14.8)22 (5.2)160 (38.1)170 (40.5)Urination and defecation could be done near wellsStrongly AgreeAgreeUndecidedDisagreeStrongly disagree5 (1.2)8 (1.9)59 (14.0)188 (44.8)160 (38.1)Sewage could be discharged into the streamStrongly AgreeAgreeUndecidedDisagreeStrongly disagree3 (0.7)60 (14.3)63 (15.0)105 (25.0)189 (45.0)It is necessary to dig pit toilets at a distance awayfrom wellsStrongly AgreeAgreeUndecidedDisagreeStrongly disagree126 (30.0)164 (39.0)25 (6.0)63 (15.0)42 (10.0)Factories should be located outside thepopulated communitiesStrongly AgreeAgreeUndecidedDisagreeStrongly disagree83 (19.8)190 (45.2)61 (14.5)62 (14.8)24 (5.7)Solid waste should be disposed dailyStrongly AgreeAgreeUndecidedDisagreeStrongly disagree40 (9.5)217 (51.7)150 (35.7)4 (1.0)9 (2.1)Solid waste could be spread around thecompound to decay naturallyStrongly AgreeAgreeUndecidedDisagreeStrongly disagree0 (0.0)21 (5.0)105 (25.0)63 (15.0)231 (55.0)All waste bins should have coversStrongly AgreeAgreeUndecidedDisagreeStrongly disagree129 (30.7)60 (14.3)162 (38.6)48 (11.4)21 (5.0)VariableDOI: 10.4236/odem.2017.5400997Occupational Diseases and Environmental Medicine
C. B. Duru et al.ContinuedAll communities should have a day forgeneral clean upStrongly AgreeAgreeUndecidedDisagreeStrongly disagree189 (45.0)168 (40.0)26 (6.2)21 (5.0)16 (3.8)Open waste bins could be kept in the kitchenStrongly AgreeAgreeUndecidedDisagreeStrongly disagree42 (10.0)105 (25.0)105 (25.0)84 (20.0)84 (20.0)It is not necessary to separate waste before disposalStrongly AgreeAgreeUndecidedDisagreeStrongly disagree42 (10.0)42 (10.0)252 (60.0)40 (9.5)44 (10.5)Community sanitation should be taught in schoolStrongly AgreeAgreeUndecidedDisagreeStrongly disagree126 (30.0)211 (50.2)81 (19.3)2 (0.5)0 (0.0)at all, if they visited their communities (80.4%). Of those that reported being visited by sanitary inspectors, a majority reported that the frequency of visits wereeither monthly or yearly (78.0%). Similarly, a majority of the respondents reported that their communities observe a monthly environmental sanitation day(70.2%) but close to half of the respondents (49.5%) either reported that, it wasof no benefit or did not know if observing the environmental sanitation day benefited the community. Close to 45% of the respondents reported having communal bush clearing and gutter cleaning activities, of which, a majority (78.1%)reported having the communal activities every month (Table 4). Furthermore,though a majority of the respondents (52.9%) had an overall poor level of environmental sanitation practice, most of the respondents (87.2%) rated their levelof community sanitation as moderate to good (Figure 3 and Figure 4).4. DiscussionThis study assessed the knowledge, attitude and practice of environmental sanitation in semi-urban communities in a developing country. Though it was revealed that most of the respondents were aware of environmental sanitationmainly through the mass media which was similarly reported by Adogu et al.,from a previous study [18], only about 23%, 39% and 21% of the respondentshad a good level of environmental sanitation knowledge attitude and practicerespectively.In spite of the fact that, most of the respondents’ self-assessment of their levelof community sanitation was graded as moderate to good, their actual level ofpractice for a majority of the respondents was poor to moderate. As a result,DOI: 10.4236/odem.2017.5400998Occupational Diseases and Environmental Medicine
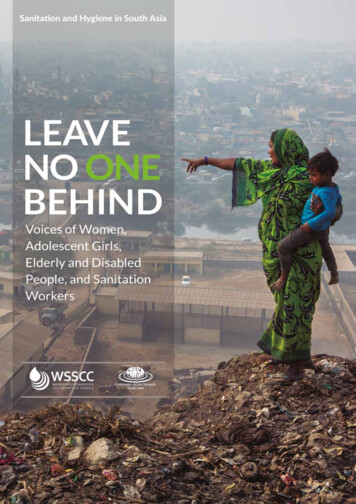
C. B. Duru et al.Table 4. Environmental sanitation practices among respondents in semi-urban communities in Orlu.VariableCategory*Major types of solid waste generated (n polythene bagsClothing/leatherStationeryElectronic wasteConstruction materials314 (74.8)232 (55.2)165 (39.3)106 (25.2)64 (15.2)43 (10.2)25 (6.0)Estimated quantity of solid waste generated per household or businesspremise per week (n 420)Mean waste generated 14.1 0.94 kg.Average waste generated per person/week 2.69 kg1 - 2 buckets (5 - 10 kg)3 - 4 buckets (11 - 20 kg)5 - 10 buckets (21 - 40 kg)Can’t estimate173 (41.2)127 (30.2)59 (14.0)61 (14.5)*How is waste stored? (n 420)Use of cover binsBags/sacs/nylon bagsOpen dumpingUse of uncovered binsUse of baskets231 (55.0)169 (40.2)127 (30.2)116 (27.6)95 (22.6)How frequently do you dispose waste? (n 420)2 - 3 times per weekOnce per weekDaily202 (48.1)116 (27.6)102 (24.3)How do you transport waste to dump site?(n 420)Wheel barrowsHead pansPrivate closed carriersDragging on the floor166 (39.5)144 (34.3)69 (16.4)41 (9.8)Do you pay any dues for waste disposal? (n 420)YesNo83 (19.8)337 (80.2)Does your community have a designated central area for waste disposal?(n 420)YesNoDon’t know146 (34.8)207 (49.3)67 (16.0)What is the major waste disposal method practiced? (n 420)Open dumpingBurningCompostingRecyclingHog feedingSanitary land fillNot sure209 (49.8)61 (14.5)55 (13.1)23 (5.5)19 (4.5)5 (1.2)48 (11.4)Are there public toilets in the community? (n 420)YesNo169 (40.2)251 (59.8)Does the community have a health committee? (n 420)YesNoDon’t know213 (50.7)106 (25.2)101 (24.0)Do sanitary inspectors visit your community?(n 420)YesNoDon’t know82 (19.5)287 (68.3)51 (12.1)DOI: 10.4236/odem.2017.5400999Frequency (%)Occupational Diseases and Environmental Medicine
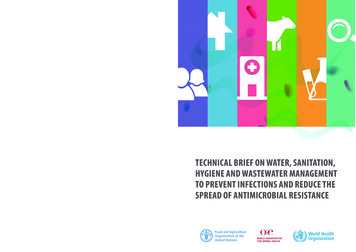
C. B. Duru et al.ContinuedIf yes, how frequently? (n 82)YearlyMonthlyWeekly33 (40.2)31 (37.8)18 (22.0)Does your community observe a monthly environmental sanitation day?(n 420)YesNoDon’t know295 (70.2)43 (10.2)82 (19.5)Has monthly environmental sanitation day benefited the community?(n 295)YesNoDon’t know149 (50.5)83 (28.1)63 (21.4)Are there any communal bush clearing and gutter cleaning activities?(n 420)YesNoDon’t know187 (44.5)107 (25.5)126 (30.0)How frequently is the bush clearing and gutter cleaning activities? (n 187)MonthlyWeeklyYearly146 (78.1)27 (14.4)14 (7.5)Level of Environmental Sanitation PracticeNumber of rate0Figure 3. Overall level of environmental sanitation practice among respondents insemi-urban communities in Orlu.Number of respondents250Self Assessment of Community or0Figure 4. Self-assessment of community sanitation among respondents in Semi-urbancommunities in Orlu.there seems to be a gap between their level of practice of sanitation and the perception of the level of sanitation they practice. In order words, they appear notto appreciate the inadequacy and inappropriateness of the environmental sanitaDOI: 10.4236/odem.2017.54009100Occupational Diseases and Environmental Medicine
C. B. Duru et al.tion they actually practice. This may be attributed to the l
Knowledge, Attitude, Practice, Environmental Sanitation, Sold Waste Management, Nigeria 1. Introduction Environmental sanitation is a set of actions or a fundamental process of t- collec ing and safely disposing all kinds of waste within the environment with the in-tention of protecting and promoting the individual health and quality of life of