Transcription
United States Department of JusticeHate Crime SummitHate Crimes Rise in Major American Localities in2016By Prof. Brian H LevinAnalytic Charting By Prof. Kevin GrishamCenter for the Study of Hate and ExtremismDepartment of Criminal JusticeCalifornia State University, San BernardinoWashington, DC June 29, 2017
Definition and Data Collection HistoryA hate crime is a criminal offense motivated in whole orin part by the actual or perceived group status of another,such as race and ethnicity, religion, disability, sexualorientation, gender and gender identity. The FBI tracksover 30 different types of bias motivations within thebroad categories they track. In 2015 the agency addednew subgroups; anti-Sikh and anti-Hindu under religions,and anti-Arab in the race/ethnicity category. The HateCrime Statistics Act was passed on April 23, 1990 and thefirst natonal study featured limited 1992 data.
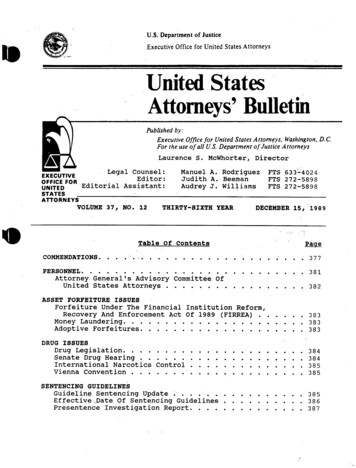
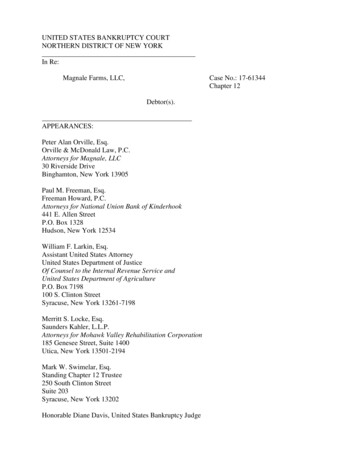
Percentage of the Overall Hate Crime Occurences in the U.S.by Offenders' Reported Motivations(1991-2015)70Percentage of the Overall Hate Crime Occurences6050403020100YearsReligiousRaceSource: FBI/ Kevin GrishamSexual OrientationNational Origin/EthnicityDisability
Official Overall Hate Crime Data & PopulationEstimatesCriminal hate crime incidents reported to police increased6.8% in the United States in 2015 according to officialFBI data released in November 2016.There were 5,850 total (and 5,818 single bias) incidents in2015, compared to 5,479 total reported in 2014. Incontrast, in September 2016, the FBI figures for violentcrime overall showed an increase of over 3.9%.Police Reports Undercount Hate Crime Relative to Victimization SurveysBJS Victimization Survey Estim. FBI2004.281,6707,649BJS Survey Estim.2008 266,640FBI7,783
46,6286,2226,573FBI: incidents reported to police; BJS: household surveysThe Bureau of Justice Statistics hate crime data are derived from national telephone surveys, while the FBIdata, like this report, relies on official reports from law enforcement annually. *BJS had an anomaly in2011.U.S. Demographics-Religion: Pew Research CenterChristian70.6%: Evangelical Protestant 25.4% ; Catholic 20.1%Non-Christian5.9%: Jewish 1.9%; Muslim 1%; Buddhist 0.9%Unaffiliated22.8%: Agnostic 4%; Atheist 3%Our Center’s latest 2016 compilation of official policedata from a sample of 25 large cities and counties acrossthe nation, including 9 of the 10 most populous cities hasrevealed an increase in hate crimes overall of another 6%in those jurisdictions surveyed. Of the 25 localitiessurveyed, 14 hit or tied multi-year highs. Of those citiesand counties reporting increases and multi-year highs,four of them were among the five largest cities, whereincreases were far higher than the overall average.
JurisdictionPopulation(2015)/RankTotals for all localities& NYS201620152173 8.81%19971930Cities/counties onlyU.S. 321,418, 820FBI Hate Crime U.S.2047 6.06%TBA11/17New York City, NY8,550,405 (1)380 24%2014201320122011201058505479 6.7% 16%374 55%242-31%350 27%NY STATE TOTAL607Los Angeles(City), CA 2303,971,883 (2) 15%505200 32%558*152 33%617*114-8%734*124-27%556*170 23%699*138Orange County, CA3,172,532 (5/County)Chicago, IL2,720,546 (3)50 13.6%71 20%44 10%59-8%40-18%64 8.5%49-19.2%59-13%61-22%68 33%78 39%*51 11%56Houston, TX2,296,224 (4)Philadelphia, PA1,567,442 (5)Phoenix, AZ1,563,025 (6)8-68%21 50%173-28%25 56%14 8%239 31%13NC16 33%81*-33%13-24%12-8%121*1.6%17 31%13* 63%123*-9%13Suffolk County, NY1,498,816 (24/County)San Antonio, TX1,469,845 (7)San Diego, CA1,394, 928 (8)42-39%1069-20%1316 23%13-19%183* 126%87NC14*87-22%11*111 192%17*4835-2.8%36-2.7%37*-14%43* 27%34*-19%38-21%2*-60%42*-14%*468*135*5*49*
Nassau County, NY1,344,436 (27/County)Montgomery, County,MD1,030,447 (41/County)San Jose, CA1,026,908 (10)Austin, TX912,791 (11)59-5%94 42%62-18%66 65%76 17%40 43%65-34%28 17%98 81.5%2454-55%#12019 217%17 21%11-27%4*15*15*-53%6* 20%32* 33%5*24*San Francisco, CA864,816 (13)Columbus, OH850,106 (15)Seattle, WA684,451 (18)Denver, CO682, 545 (19)Washington, DC672,228 (22)Boston, MA667,137 (23)Fresno, CA520,052 (34)Sacramento, CA490,712 (35)Long Beach, CA474,140 (37)35 25%213 9.8%89 6%316-45%14 250%28 27%194 30%84 65%24*22-8%149* 10%51 55%22*24-31%*136 209%33 6.5%42*35-24%*4410%31*46-27*40-13%#*634830*43107 62%275-8.6%1266-7%301 1%1171 1%298-6.3%*1270-14%318 5.3%*1081-12%302-17%*892 61%365 147%*257*68*7*16*16*17*258-33%*12 20%*5 25%*4-33%*6-40%*10Bakersfield, CA373,640 (52)89*10 100%*6*3*4*5*4Cincinnati, OH298,550 (66)54 38.5%39-28%13* 18%*11 22%*9-10%*10*FBIData#Frmtchng.54* 315%OrN/AGreen typeface indicates at or above multi-year high4*#5**46#*148*6
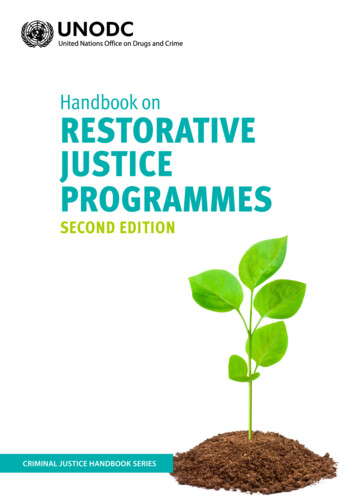
In 2016 hate crime in Chicago rose 20%, 24% in NewYork City, 15% in Los Angles, and 50% in Philadelphia.The largest increase, 62%, was right here, in WashingtonDC., while Seattle with an only 6% increase, andColumbus, Ohio, with a 9.8% rise were the onlyjurisdictions where percentage increases fell belowdouble digits. Boston; Suffolk County, NY; and Houston,however, had significant overall drops, although Bostonexperienced an increase in anti-Muslim hate crime.In our sample of California’s largest cities, hate crimesincreased 14%. Even with these increases, it should benoted that the nation is well below the century highs of2001 when 9/11 occurred, although some of this declinemay be attributed not only to a decrease in actual cases,but also be due in part to a disturbing breakdown inreporting in various key jurisdictions.While precipitous election time hate crime spikes wereclearly present in many places, there were a few in theMidwest where no increases were apparent. Unlike othersurveys, however, this is the only one relying on uniformofficial crime data over time, as opposed to non-criminalevents, for full year 2016.Partial 2017 data is available for only a handful ofjurisdictions and reproduced below. No national trend can
be discerned because of the small number of jurisdictions.Hate Crimes: 2017City2017 YTD2016 YTDDateThroughNew York211/ 40%151June 26Seattle38/ 41%27April 30Washington, 51/ 21%DC42May 31Chicago5February 313/ 160%A substantial portion of anti-Semitic incidents nationallyin 2017 came from an Israeli offender, who may be whatresearchers call a “conflicted” mentally ill offender whois believed responsible for most of the over 160 bombthreat targeting Jewish institutions in the first quarter of2017.Any Increase for 2016 Would Be Multi-Year HighThe 2016 increase of 6% that we found in our samplemay very well fluctuate as more data comes in from otherjurisdictions, but if it does hold for the rest of the nation,2016 will be the first time since 2004, when America hashad back to back annual increases in hate crime. The FBI
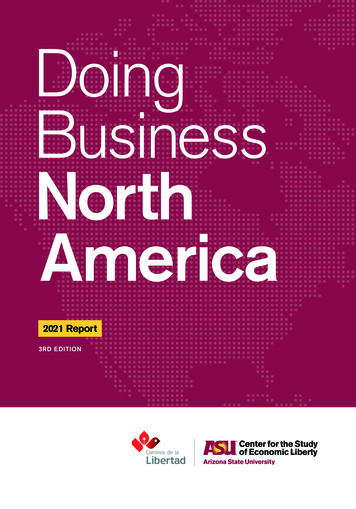
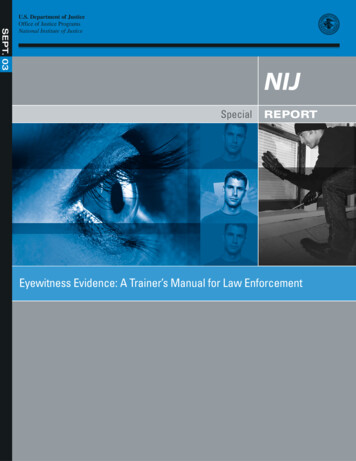
recorded total of 7,462 hate crimes for 2004 issignificantly higher than the 5850 that was reported in2015, following a 6.7% increase from the prior year. A6% national increase over 2015 FBI numbers would totalabout 6,200 hate crimes for 2016 and that number wouldbe the highest since 2011’s 6,222 cases. As stated,however, the 6% increase in our sample will change, andeven possibly moderate by the time the FBI releasesnational hate crime data this November.Number of Hate Crimes By Year: Anti-Jewish and Anti-MuslimNumber of 01320142015Years (1996-2015)Anti-IslamAnti-JewishFBI/Kevin Grisham, CSUSBReligion targeted hate crime, however, increaseddramatically in 2015 to 1,244 incidents according to theFBI, an increase of 22.7% over 2014, where there were1,014 incidents. The proportion of religion-based hatecrime also increased to its highest level since modernreporting commenced in the early 1990s, constituting
21.3% of hate crime in 2015, compared to 18.5% in 2014.The 2015 religion hate crime FBI totals were also thehighest numerically since 2010. Similarly, the Bureau ofJustice Statistics relying on annualized datasets fromresidential phone surveys found an even higherproportion of religiously motivated hate crime: “Thepercentage of hate crimes motivated by religious bias wasnearly three times higher in 2012 (28%) than in 2004(10%), but did not have a statistically significant changefrom 2011 to 2012.”The Bureau of Justice Statistics victimization phonesurvey data on hate crime overall, over the last decade hasfurther showed a wide disparity between their annual hatecrime data, which has been averaging slightly below300,000, and the FBI’s data, which show under 6,000nationwide, indicating some difficulty and obstacles byboth police and citizens in identifying and reporting hatecrimes. The ADL found 87 cities of 100,000 populationor more reported no hate crimes in a recent reportingperiod.State reporting to the FBI is limited by a glaring lack ofparticipation in the voluntary program by various states,including Florida, Pennsylvania, Mississippi, Alabama,Arkansas, and Hawaii among others. Maryland, the firststate to collect data in the 1980s has an excellent programthat reported 203 hate crimes, including 14 anti-Muslimcrimes, in its official report released in September.However, only 41 made it into the FBI 2015 data.
Most Hate Crime Directed At People, Not PropertyThe most frequent hate crime offenses were propertydestruction at 1,698 or 24.7%; followed closely byintimidation, 1,495 or 21.%; and simple assault with1,436 or 20.9%. Aggravated assaults accounted for12.8%of all offenses with 882. One third of hate crimeswere simple or aggravated assaults. In contrast, only 15%of overall crimes in 2015 were violent, showing that hatecrimes are far more violent proportionately. FBI figuresshow 18 hate motivated homicides nationally, includingthe nine people who were murdered in the raciallymotivated mass shooting at Charleston, South Carolina’sMother Emanuel church in June 2015. This is part of adisturbing trend of not only an increase in hate homicidesannually, but also a trend where the targets of multifatality attacks are religious ones.NGO Reports: ADLThe ADL, a Jewish civil rights group, tally of antiSemitic “incidents,” which includes both criminal andnon-criminal events, increased 34% nationally in 2016,from 942 to 1266, though assaults dropped from 56 to 36.Almost 30% of all ADL incidents nationwide, recordedlast year, occurred in the last two months around electiontime. In the first quarter of 2017, anti-Semitic incidents
nationally rose 86% over the same period last year.In our home state of California the ADL reports antiSemitic incidents rose 21% from 175 to 211 in 2016, thehighest total in the nation and a multi-year high. Assaultsin the state rose from one to six. In 2015 anti-Semitic hatecrimes rose 21% in the state according to the AttorneyGeneral, and 9% nationally according to the FBI, to mitic Semiticof U.S.Population of StateIncidents IncidentsJewishin StatePopulationin 2016 in 2015Population(ADL) (ADL)NewYork1,759,570 8.9%25.8%199198California 1,232,690 da651,5103.3%9.5%13791California: Anti-Semitic Incidents: ADL
2017:Vandalism: 21; Harassment: 66; Assault: 0; Total: 872016:Vandalism: 77; Harassment: 128; Assault: 6; Total:2112015:Vandalism: 69; Harassment: 105; Assault: 1; Total:175Southern Poverty Law Center (SPLC)Nationally, the SPLC counted 1372 bias incidents fromElection Day through February 7, 2016 through an intakewebpage of self-reported incidents and news reports, butthere was no breakdown differentiating criminal acts fromslurs and other forms of noncriminal harassment. Ourinternal data indicate that the total number of actualcrimes is a fraction of that total. Similarly, the websiteThinkProgress using a more rigid data collectionmethodology found only 267 hate incidents betweenElection Day and February 9, 2017.In the month of the election, through December 12, 2016;the SPLC counted 1,094 incidents nationally, with 315directed at immigrants, 221 at African-Americans, 112 atMuslims, along with 26 anti-Trump incidents. California,with 125 incidents, led the nation. SPLC also found directreferences to President Trump or the election in over one
third of the national incidents right after the election. Inaddition, while the SPLC found only a 3% rise in hategroups, they found a tripling in anti-Muslim groups.The Council on American Islamic Relations (CAIR)reported 2,213 bias “incidents” in 2016 and a 57%increase and 260 crimes and a 44% increase.The ADL, SPLC, CAIR and other data from humanrelation commissions point to far more non-criminalincidents than actual crimes, and the increases in“incidents” appear to be greater than that of actual“crimes.” While limited vetting of “incident” data can beless reliable, it is can also capture trends, and it is animportant data set in its own right. These data, with theirlimitations, nonetheless gathers within in its sweep noncriminal conflicts that adversely affects the quality of lifeof both communities, institutions, schools and targetedgroups.An Array of CausesPrejudice and individual manifestations of it often involvea range of interdependent variables that make certainconclusions more difficult to draw than others,particularly in trying to connect a rise in hate crime to onecausal factor. The presentation of crime data alone, of thekind presented here, answers some questions, but otherconclusions are more elusive, as these data are notdesigned to be wholly diagnostic or predictive on theirown. Various, often interconnected, factors appear to
influence hate crime as well as non-criminalmanifestations of prejudice including the level, breadthand nature of prejudice against a particular group,demographics, familiarity and contacts between groups,ongoing national and regional conditions relating togroups, catalytic events, retaliation, perceived grievancesand the emergence of leaders and subcultures thatpromote or discourage stereotypes.With respect to anti-Muslim hate crime, the data doesindicate a multi-year increase, even during periods whenreported hate crime overall was declining. Further, 2015was the most precipitous rise since 2001. Since the 1980s,data has confirmed the phenomena of a catalytic triggerevent being accompanied by a temporary spike in hatecrimes. These spikes then recede, although not alwaysevenly or necessarily back to previous levels. Examplesinclude the fatal racial attack in Howard Beach, Queens in1986; the response to the April 1992 acquittals in theRodney King police beating case, and the backlashes after9/11 and following a proposal to build a religious centerin lower Manhattan in 2010.Spikes can vary not only by rate of increase, but also byduration, and location as well. Following the record spikein anti-Muslim hate crime after 9/11, incidents declined,but only to levels that ranged approximately four to fivetimes previous levels, until 2015’s dramatic increase. Thehate crime increases after catalytic events, like 9/11, risesharply, though sometimes with a slight delay as
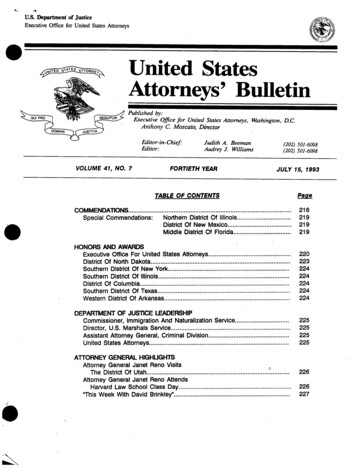
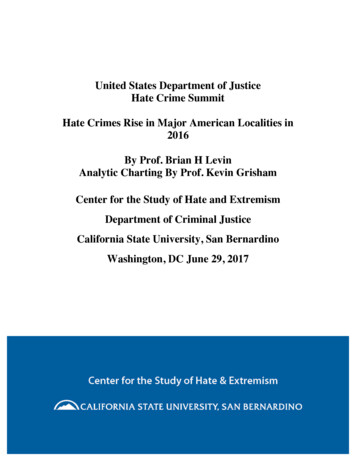
information is disseminated and processed, and then fallmore slowly, exhibiting a saw tooth pattern decline asseen in our charts.Words Matter: A Bully Pulpit Effect?An frequent query that we receive routinely is what effect,if any, do well publicized statements by political leadersin the wake of catalytic events have on the commission ofhate crimes? While we have data on dates, we often donot have exact times of crimes in available reports; nor dowe know if an offender actually heard a provocativestatement, nor conversely do we know who refrains fromviolence after hearing a tolerant message. There was awave of anti-Muslim hate crime following the September11, 2001 terrorist attacks. We, also noted a moderateweekly rise in hate searches on Google like “kill allMuslims” after Mr. Trump’s proposed Muslim ban,which was first explored in the New York Times last year.After President Bush made statements of tolerance at amosque on September 17, 2001, however, anti-Muslimhate crimes dropped dramatically across the country asthe following tables and charts indicate. Conversely,when Candidate Trump first proposed his “Muslim Ban”on December 7, 2015 after the San Bernardino terrorattack, anti-Muslim hate crime rose 87.5%, above alreadyelevated levels.For the six days that followed anti-Muslim hate crimes
totaled 26, dropping down to five on September 18, theday after the President’s tolerance address. Because wedo not know the times of the hate crimes on September 17,2001, one may want to calculate the data by making thedividing line the day before, thus going from September12 through the September 16, for a total of 62, andshifting the 15 over into a new cadre of incidents goinguntil September 21, for a total of 33. If we choose the firstdata set, the decline for the days after President Bush’sspeech the drop is 66.2%, and if we choose the second set,the declines are still steep, at 46.7%.The San Bernardino terrorist attack occurred at about11AM PT, on December 2, but the names of the suspectswere not initially released, and suspicions of a connectionto ISIS were not definitively confirmed in the media untillate that day. For the five days from December 2 throughDecember 6, there were 8 anti-Muslim hate crimes, withnone on December 2. For the five days from December 7through December 11, there were 15 anti-Muslim hatecrimes, with those occurring on December 7 taking placeafter the announcement. These crimes include multipleassaults and two fire-bombings, including one in theovernight hours immediately following Mr. Trump’sannouncement.
Hate Crime After 9/11 and After Pres. Bush’s Tolerance Address 9/17Anti Muslim/Arab Hate Crimes2520151050123456789 10 12 13 14 15 16 17 18 19 20 21 22 23 24 25 26 27 28 29 30Anti Muslim/Arab Hate CrimesDays in September 2001
Source: National Incident-Based Reporting Data for 2001.Retrieved from National Archive of Criminal Justice Data by Dr. James Nolan/West Virginia U.RecommendationsWe believe that data collection is a barometer of response and that in mjurisdictions that response is inadequate or even non-existent. Weencourage the Department of Justice to assist with heightened enforcemenhanced data collection efforts, public private partnerships, routinemeetings at state, federal and local levels; further training of lawenforcement, as well as public statements by high officials that hate criare a priority and run counter to American values.We offer the following additional recommendations to assistour nation’s response:Making reporting by law enforcement mandatory and tied tofunding;Amending federal statutes to include threats and making biasselection be a contributing, rather than an overriding factor;Maintaining and improving coordination by the Department ofJustice with other agencies and NGOs;Provide enhanced training for law enforcement, particularly inlow participation jurisdictions.Thank you and feel free to call upon our Center, if you haveadditional questions.
Appendix: Additional Tables and ChartsFBI: U.S. Hate Crimes Based on Religious Identity ofVictim; ll 0910871081110911091043931927954
8,30868%Center for the Study of Hate and Extremism/California State University, San Bernardino;Brian Levin [Compilation: Author] & Graphs by Kevin Grisham
Occurences of Hate CrimesAn[-Muslim Hate CrimesSix Metropolitan Ci[es in U.S.(2015-2016)4035302520151050New York CityLos AngelesChicagoPhoenixMetropolitan Ci[es in U.S.20152016Professor Brian Levin, DirectorCenter for the Study of Hate & ExtremismCollege of Social and Behavioral SciencesDepartment of Criminal JusticeBostonSan Jose
California State University, San Bernardino5500 University ParkwaySan Bernardino, CA 92407Phone: (909) 537-7711 (Leave message after hours)Email: Blevin8@aol.comKevin E. Grisham, Ph.D., Assistant Director of ResearchCenter for the Study of Hate & ExtremismCollege of Social and Behavioral SciencesDepartment of Geography and Environmental StudiesCalifornia State University, San Bernardino5500 University ParkwaySan Bernardino, CA 92407Phone: (909) 537-5522 (Leave message after hours)Email: kgrisham@csusb.eduMain Office Phone: (909) 537-7503Website: http://hatemonitor.csusb.eduFacebook: Center for the Study of Hate & ExtremismTwitter: @ProfLevin or @ProfGrisham
The Bureau of Justice Statistics hate crime data are derived from national telephone surveys, while the FBI data, like this report, relies on official reports from law enforcement annually. *BJS had an anomaly in 2011. U.S. Demographics -Religion: Pew Research Center Christian 70.6%: Evangelical Protestant 25.4% ; Catholic 20.1%