Transcription
A NEWTELECOMMUNICATIONSWORLDLawrence K. Vanston, Ph.D.
A NEW TELECOMMUNICATIONSWORLDLawrence K. Vanston, Ph.D.Technology Futures, Inc.
The views expressed herein are solely those of the author.Copyright 2007, Technology Futures, Inc.All rights reserved. No part of this report may be reproduced in any form or by any means, otherthan short quotes to be used in reviews, without express permission from Technology Futures, Inc.Printed in the United States of America.Published by Technology Futures, Inc.13740 Research Boulevard, Building CAustin, Texas 78750-1859 U.S.A.(800) 835-3887(512) 258-8898Fax: (512) 258-0087www.tfi.com
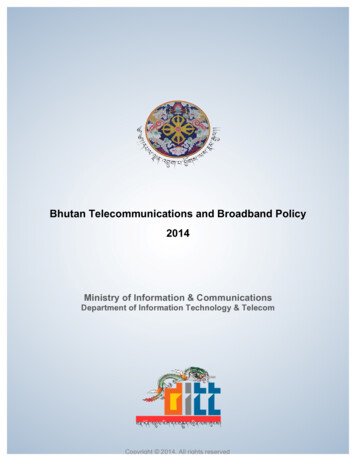
Introduction ANDSUMMARYThe telephone network was built to providenarrowband voice service to essentially every homeand office. This massive, dedicated network requiredhundreds of billions of dollars of investment intelephone plant comprised of metallic and fiber cable,switching equipment, and various types of circuitequipment, not to mention buildings, poles, conduit,trucks, etc. For the local exchange industry thisinvestment amounted to 411 billion at year-end2006.1 Some of the cable investment has been in placefor decades, and some switches and circuit equipmenthave lasted a decade or more. Market share wasalmost 100%. Quality of service was high. Revenuekept growing, investment was continuous, profitswere dependable, lives were long and the propertywas easy to find ideal from a tax revenueperspective. The absorption of voice into integrated Internetapplications, so that voice becomes less of astandalone service.Research and forecasts from recent TFI studies forthe telecommunications industry quantify thesetrends2 and indicate that these changes are happeningvery rapidly as discussed herein.The implications of these developments forproperty valuation are profound and will requireserious adjustments by the property tax community.These implications include: Shorter depreciation lives for existing and newproperty. Sharply diminished value of existing property. Shorter life-cycles for new property, approachingthat of computers in some cases. Potential reclassifications of industry type, e.g.,telecommunications to video.That world is disappearing.The reasons include: The dramatic decline in narrowband access linesdue to competition from cellular, cable telephony,and VoIP (voice over Internet protocol), as well asbroadband replacing dialup Internet access. The resulting imperative by telephone companiesto offer bundled phone, television, and broadbandservice to compete with their rivals from the cabletelevision industry. The demand for new interactive video andtelevision services, and the demand for muchhigher broadband data rates than DSL canprovide. The rapid rollout of new networks such asAT&T’s Project Lightspeed or Verizon’s FiOS,which meet these demands via state-of-the-artfiber optics technology.1FCC, ARMIS report.A New Telecommunications World Entirely new providers of telecommunicationssuch as Google.ConvergenceConvergence is happening in so many ways andso fast that it is hard to keep track of. Figure 1 showsthree important types of convergence impactingtelecommunications companies. First, there is theconvergence of voice, data, and video. As we shallsee, this is more than the “triple-play” of carrying allthree on the same facilities or putting them on thesame bill; ultimately, it involves all three becomingsimply applications on the broadband Internet. Theboundaries between wireless and wireline are alsobeginning to dissolve, not just with the “quadrupleplay” that adds wireless to the bill, but also with using2L. K. Vanston, Broadband Equipment Lives for Local ExchangeCarriers (Austin, TX: Technology Futures, Inc., 2007); L. K.Vanston, The Conversion of Narrowband Access Lines to VHSBroadband Facilities: Analyses & Forecasts (Austin, TX:Technology Futures, Inc., 2007); and L. K. Vanston and R. L.Hodges, Transforming the Local Exchange Network: ThirdEdition (Austin, TX: Technology Futures, Inc., 2006).1
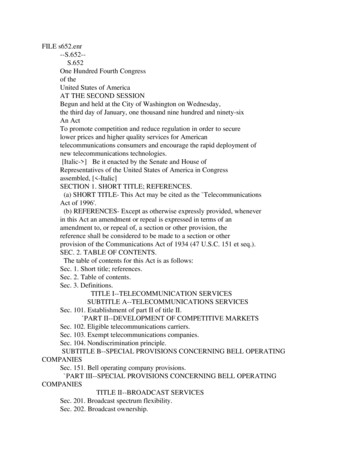
wireless broadband to access the same Internet contentregardless of location or device. Third, computers,handsets, and consumer electronics (TVs, VCRs, CDplayers, etc.) were once distinct devices in their ownright. Now, people watch TV or listen to music ontheir computers or their cell phones, with the Internet,or at least Internet technology, playing the keycommunications role. In summary, the commonconvergence point for voice, data, and video, wireless,or wireline, regardless of device, is the broadbandInternet.The significance of convergence is truly drivenhome when we consider the convergence of content.Consider each item listed in Figure 2 and how far wehave gotten in the transition from traditionalstandalone content to computer/ Internet-basedcontent.Figure 1Telecom ConvergenceBroadbandInternet The substitution of wireline narrowband access(both ILEC and CLEC4) by wireless, broadband,and non-carrier VoIP.Each of these components is discussed below.elinireWFigure 3Narrowband AccessConsumernHaU.S. Industry250ElectronicsPotential NB LinesALL CUSTOMER TYPESNARROWBAND200ts150Displaced byWireless, Broadband,or Non-Carrier VoIPrsILEC RetailAccess LinesWirelineTotal100Figure 2Convergence of Content01995H o w d id y o u d o th e s e 5 y e a r s a g o ? H o w d o y o u * d oth e s e to d a y ? I n 5 y e a r s ? P h o to sM u s icT extM essagesIm a g e sP e r s o n a l V id e oM o v ie sTV V o ic eL o c a tio nG am esN ew sp a p ersM a g a z in e sB ooksJ o u r n a lsB ro c h u re s* o r y o u r k id s o r g r a n d k id s !2 010Year2015Access Competition Summary 2007edsComputeodeViThe figure shows the decline has two maincomponents:Millions of Access LinesDataNationwide, the loss of ILEC narrowband accesslines due to competition from wireless, broadband,cable telephony, and VoIP has been dramatic. Asillustrated in Figure 3, since the peak in 2000, ILECaccess lines (including resale and UNE) have fallenfrom a high of 187 million in 2000 to 161 million atmid-year 2006.3 The total is forecasted to fall furtherto 98 million by 2010 and 45 million by 2015.This isthe ILECs traditional core business landline accesslines. Facilities-based CLECs capturing wireline marketshare from ILECs.sWirelesVoiceTHE DRAMATIC DECLINE INNarrowBand Access Lines2020Source: Technology Futures, Inc.D o c u m e n tsI n f o r m a tio nS e n so rsT r a n s a c tio n s3FCC, Local Telephone Competition: Status as of June 30, 2006.Competitive local exchange carrier. CLECs include fiber opticaccess providers and cable television companies offeringtelephone service.4A New Telecommunications World
Substitution by Wireless, Broadband,and Non-Carrier VoIPThe first component in the decline of ILECnarrowband access lines, substitution by wireless,broadband, and non-carrier VoIP, is isolated in Figure4. (By broadband competition, we mean the decline inwireline access lines caused by broadband usersdropping second lines that were used for dialupInternet access.) The figure plots the percentage ofaccess lines captured by these technologies, bothhistorical and forecast. The forecast is based on astandard S-shaped substitution model of how a newtechnology (in this case, several new technologiestogether) replaces an old technology in the market.Figure 4Residential Narrowband Access Lines Displaced byWireless, Broadband, or Non-Carrier VoIPVoIP is beginning to rival wireless as areplacement technology for traditional wireline accesslines. As noted below, cable television companieshave already embraced VoIP. Apart from the cablecompanies, non-carrier VoIP is also having an impact.For example, Vonage had captured 2.2 millioncustomers as of December 2006,5 and peer-to-peerVoIP services, such as Skype, are growing rapidly.Skype, for example, had 171 million registered usersworldwide as of March 2007.6 Originally viewed as acheap partial substitute for “real” telephone service,VoIP quality is much improved and, ultimately, maysurpass circuit switching’s quality.7 It will also beinfinitely more flexible as voice becomes integratedwith the Internet as we discuss later.Figure 5U. S. Wireless Subscribers100%100%90%80%70%60%50%Access LinesDisplaced byWireless,Broadband, orNon-Carrier 01510%0%1990Historical Data Source: CTIA2020199520002005Year201020152020Source: Technology Futures, Inc.Source: Technology Futures, Inc.The most important replacement technology iswireless, that is, cellular telephony. Cellular continuesits rapid penetration as shown in Figure 5, reaching70% of the population in 2005. Flat-rate cellularpricing plans, large buckets of free minutes, large freecalling areas, and free long distance plans haveencouraged people to rely on their cell phones to theextent that many have abandoned their landlinephones. The historical trend is shown in Figure 6.Recently, the figure has been reported to exceed 10%of the adult population. Younger people are moreinclined to use wireless only as shown in Figure 6. For18 to 25 year olds, the percentage exceeds 20%! Thiswill support a continued long-term wireless-onlytrend.A New Telecommunications WorldHistoricalData20%19852000U.S. CellularSubscribers60%US Wireless 2006Percentage of PopulationRESIDENTIALNARROWBANDResidential Narrowband 2007Pct of Peak Access Lines90%Competition from Cable TVCLECsThe second major component in the decline ofILEC access lines is competition from facilities-basedcompetitors. For the residential market, these aremainly cable television companies such asCablevision, Comcast, and Time Warner. As shown inFigure 7, cable telephony has captured 6% of wirelineaccess lines as of mid-year 2006. For the first few5www.vonage.com.Skype Press Release, Celebrating 500m Downloads, Skype HasOffers, Goodies, Up Its Sleeve (Luxemburg, March 15, 2007).7This is because its bandwidth is virtually unlimited. SuperiorVoIP quality assumes that any residual technical problems withdelay and jitter are overcome or are negligible.63
years, only a few cable television companies offeredvoice telephony. These companies used traditionalcircuit switches. Now, most cable companies areoffering voice telephony, and are mostly using themuch cheaper VoIP technology. Thus, we expect therate of penetration to increase rapidly as shown in thefigure.Figure 6Wireless-Only Market Share25%Broadband INTERNET ACCESSAs of June 2006, 46% of U.S. householdssubscribed to broadband services, up from 36% inJune 2005.8 Cable modems have a 57% market share,compared with the 42% market share of the telephonecompany (mostly DSL). Wireless broadband,including satellite broadband, comprises about 1%.9Broadband penetration in California is significantlyhigher than the national average (over 70% versus46% as of June 2006). Our forecast, shown in Figure8, anticipates continued broadband growth, withbroadband following a classical consumer electronicsadoption pattern, as illustrated in Figure 9, ultimatelyachieving ubiquity similar to telephony, radio, andtelevision. (We assume an ultimate 95% penetration.)This reflects not only the rapid acceptance ofbroadband so far, but the prospect for it to serve as thebasis for landline telephony, entertainment (e.g.,video, music, and games), home offices, and otherInternet applications.Percentage20%Figure 8Broadband Households15%10%100%5%18-2930-4950-64Over 65Age GroupFigure 7Cable Telephony Market ed Final Cable Telephony Market Share 50%200020052010Year40%20152020Source: Technology Futures, Inc.35%30%25%20%15%Cable TelephonyAccess Lines10%5%Residential Narrowband 2007Pct of ResidentialAccess Lines70%10%50%45%80%Broadband Access 2007Percentage of ce: Technology Futures, Inc.8FCC. This excludes mobile wireless broadband, which the FCCnow reports, but it includes a small percentage of fixed wirelessbroadband.9Estimated from FCC, High-Speed Services for Internet Access:Status as of June 30, 2006 (Dec 2006), Table 3. Excludes mobilewireless broadband.A New Telecommunications World
is the early data for the 6 Mb/s and 24 Mb/scategories, based on recent FCC data on broadbandtechnologies excluding cable modems.11Figure 9Adoption of Various Consumer CommunicationsProducts and Services100%70%60%CDRadioTelevision50%OnlineColor TVCellPhone40%30%20%PayCableBroadband10%1920 1930 1940 1950 1960 1970 1980 1990 2000 2010 2020YearSource:Technology Futures, Inc.100%90%80%All BroadbandHouseholds70%100 Mb/s& Above60%50%1.5Mb/s40%Broadband Access 20070%Figure 10U.S. Broadband Households by Nominal Data Rate,(Excludes Cable Modems)Percentage of HouseholdsVCR80%Consumer Adoptions 2007Percentage Penetration90%6 Mb/s30%24 Mb/s20%50 Mb/s10%0%1995200020052010Year201520202025Source: Technology Futures, Inc.Wednesday, May 23, 2007Americans Spend Half of Their Spare Time OnlineSearch engines and social networking sites are gaining in popularity,says the report, influencing an equal number of people as magazines andnewspapers. 48% of younger users say they learn about newentertainment through community, review and video sharing sites andblogs. Only 25% say they learn about new entertainment throughtelevision.Two online media activities - sending email and visiting Web sites forpersonal reasons - are more popular than watching television 056.028.810Performance Increases4 times every 4 years(42% annually)14.49.611.22.4AnalogModems2007Increasing Data Rates10000000.3Most residential broadband customers still usefirst-generation broadband, nominally 1.5 Mb/s,provided on either cable modems or DSL. Somecustomers are now demanding and being offeredpremium data rates, in the range of 5 Mb/s to 10 Mb/svia DSL, cable modems, or fiber. We have also begunthe shift to much higher data rates in the neighborhoodof 24 Mb/s. The next shift to even higher rates of 50Mb/s to 100 Mb/s is still a few years off, althoughthere are a few 50 Mb/s offerings to selected FiOScustomers. TFI’s industry forecast for the transition tohigher data rates is shown in Figure 10.10 Also shown10The forecast reflects the assumption that the average date rateincreases by 42% per year, the typical rate experienced withA New Telecommunications WorldBroadband AccessSource: Media-Screen and Netpop Play 2006Figure 11Trend in Residential Access Data RatesNominal Data Rate (Mb/s)According to Netpop I Play, a new report from Media-Screen, broadbandusers spend an hour and 40 minutes (48% of their spare time) online ina typical weekday, and more than half of that is spent accessingactivities related to entertainment and communication 0198019902000Year20102020Source: Technology Futures , Inc.Figure 12 consolidates the data rate forecast intostandard and very-high-speed (VHS) broadbandanalog modems. This is roughly equivalent to quadrupling everyfour years or doubling every two years. It thus reflects Moore’sLaw, which implies that computer performance doubles every 18months to two years (see Figure 11).11Including cable modems would show a higher penetration of thehigher data rates. We were not able to confirm how close actualexperienced data rates over cable’s shared medium are to theadvertised rates reported to the FCC. For this analysis, whichapplies to ILEC assets, we decided to use the DSL and FTTHpercentages only.5
categories.12 The distinction between standard andVHS broadband is very important from both a serviceand network perspective. From the serviceperspective, VHS is required to provide the Internetvideo applications discussed below, while standardbroadband is sufficient for today’s most-used Internetapplications. From the network perspective, the shiftto VHS requires new fiber-based architectures, suchas Project Lightspeed and FiOS, while standardbroadband can be provided on DSL (although networkupgrades are often required to provide 6 Mb/s onDSL). Overall subscriber penetration cannot exceedavailability (i.e., homes passed), and, in fact, there is aminimum availability to support a given level ofsubcribership. Figure 13 illustrates the minimumavailability for 24 Mb/s service to support thesubscriber forecast shown in Figure 12.13Figure 13Minimum Availability of Very-High-Speed High-SpeedBroadbandSubscribers60%50%40%Broadband AccessPct of 25Source: Technology Futures , Inc.Forecasts for IP VideoFigure 12Adoption of Standard and Very-High-SpeedBroadband (U.S.)Video services are probably the key driver for thedeployment of systems that support increasedsubscriber bandwidth. We distinguish between threebasic types of IP ardBroadbandBroadband AccessPercentage of r201520202025Source: Technology Futures , Inc.12The standard curve is the sum of the 1.5 Mb/s and 6 Mb/scurves in Figure 2.5; the VHS curve is the sum of the 24 Mb/s, 50Mb/s and 100 Mb/s curves in Figure 2.5.13The quantitative relationship is based on analogies to otheradoptions, specifically, cable television, pay cable, and pay-perview. See L. K. Vanston, J. A. Marsh, and S. M. Hinton,Telecommunications for Television/Advanced Television (Austin,TX: Technology Futures, Inc., 1992), pp 123-144.6 Online Video. Video clips over the open Internet.YouTube is an example of online video. Picturesize, resolution, frame rates, quality, and lengthare limited by bandwidth and other factors. IPTV. Carrier-provided television service,competitive with cable television, that uses IPtechnology to deliver programming over adedicated broadband link to the customer. Internet TV. Television, either streaming ordownloaded, over the open Internet. Like onlinevideo, but with TV-like performance and programlength. Like IPTV, but the carrier only providesthe broadband channel not the programming.Online video is an exciting Internet applicationthat has opened a whole new realm of videocommunications, production, and distribution. Forexample, 42% of online U.S. adults say they havewatched a video on YouTube, and 14% say they visitthe site frequently. Almost one in three (32%) of thesefrequent YouTube users say they are watching lessA New Telecommunications World
TV as a result of the time they spend there.14 Figure14 shows the trend in the percentage of broadbandhouseholds using online video (of any type) at leastonce a month. The percentage is currently at about60% and forecast to rise to 80% by 2010.Online video is interesting not only in its ownright, but also as a precursor for Internet television. Ithas proven that people want to acquire televisionprogramming via the Internet. Now, it is a question ofbandwidth (i.e., quality) and digital rightsmanagement. Currently, about 25% of broadbandhouseholds stream TV shows or segments at leastonce a week. If it follows the same trend as onlinevideo, we would expect the level to reach 50% by2010 and 80% by 2015, as shown in Figure 15.One-Third of Frequent YouTube Users are WatchingLess TV to Watch Videos OnlineROCHESTER, N.Y. – January 29, 2007 Few vehicles are aseffective at reaching large segments of the population astelevision Over four in 10 (42%) online U.S. adults say they havewatched a video at YouTube, and 14 percent say they visit the sitefrequently. Almost one in three (32%) of these frequent YouTubeusers say they are watching less TV as a result of the time theyspend there.IPTV is both a way for ILECs to compete withcable television service using limited bandwidth and anew service that can offer features and performancebeyond that of normal cable television. IPTV is mostimportant to those ILECs such as AT&T that aredeploying fiber to the node which, unlike fiber to thepremises, cannot deliver a standard analog RF cabletelevision signal.In the long run we expect the distinction betweenIPTV and Internet TV to blur, especially as thedistinction between computers and televisions blur.Put another way, when people expect to watch TV ontheir computers and access the Internet on their TVs,they will have similar expectations regarding thedelivery channel.100%80%70%60%40%Download orstream videoat least once a month(Gompertz b 0.21)30%20%10%0%20002005Data Source: eMarketer, Nov 20062010Year20152020100%At least oncea week90%Download orstream video80%70%60%50%At least oncea monthInternet Video 200750%Internet Video 2007Percentage of Internet Users90%Percentage of Broadband HouseholdsFigure 14Broadband Households Using Online Video at LeastOnce a MonthFigure 15Broadband Households Using Online Television atLeast Once a Week40%30%Download orstream TV shows or segmentsat least once a week20%10%0%20002005Data Source: eMarketer, Nov 2006 &Online Publishers Assn., Mar 20062010Year20152020Source: Technology Futures, Inc.Source: Technology Futures, Inc.14Harris Interactive, One-Third of Frequent YouTube Users areWatching Less TV to Watch Videos Online, Press Release,Rochester, N.Y., January 29, 2007.A New Telecommunications World7
MEDIACBS to offer its programming free onInternetTV network announces partnership with MSN,AOL and others.Figure 16HDTV Households100%By Bob KeefeWEST COAST BUREAU80%70%60%50%40%30%HDTVHouseholds20%10%Misses the point reconvergenceHDTV 2007Though the vast majority of television viewers wouldprefer to watch shows on a television rather than on acomputer, the TV networks' growing interest in the Web isanother indication that the Internet is coming into its ownas a place for video.90%Percentage of HouseholdsFriday, April 13, 2007In the television industry's latest major push into theInternet, CBS Corp. announced Thursday that it willmake its programming widely available online forfree to consumers willing to watch shows that comewith commercials .The move comes just a fewweeks after NBC Universal and Fox broadcastingowner News Corp. said they were joining forces tosimilarly push their programming on the Internet.Other networks, including Walt Disney Co.'s ABC,are exploring similar moves.(Gompertz b 0.20)0%1995200020052010YearData sources: Various20152020Source: Technology Futures, Inc.High-Definition TelevisionAs HDTV becomes prevalent, consumers willwant to access HD programming via the Internet.Combining the Internet TV forecast and the HDTVforecast provides a forecast of Internet HDTV, asshown in Figure 17. According to this forecast, about20% of households will use Internet HDTV by 2010and over 60% by 2015.8Figure 17Internet HDTV Households100%Percentage of Households90%Internet TVHouseholds80%70%60%HDTVHouseholds50%40%Internet HDTVHouseholds30%HDTV 2007High-definition television (HDTV) has nowpenetrated about 20% of U.S. households and isforecast to approach 50% by 2010, as shown in Figure16. Although HD requires more bandwidth thanstandard video, it is obviously now a requirement forany competitive television delivery system.Ultimately, any video application, whether broadcastor online, will need to deliver HD. As entertainment—e.g., gaming, pay-per-view movies, and sports—continues to shift from broadcast to online delivery,HD will become as much a computer phenomenon asa television one.20%10%0%1995Data sources: Various200020052010Year201520202025Source: Technology Futures, Inc.A New Telecommunications World
Wireless BROADBANDFigure 18Wireless Generations15FCC, Local Telephone Competition: Status as of June 30, 2006.A New Telecommunications World90%80%70%60%Mobile WirelessBroadbandUsers50%40%30%20%10%07For the last decade, the cellular industry has beensteadily upgrading from a voice-only network to avoice and data network with increasing bandwidth.Over this period, the cell phone has evolved frombeing a cordless telephone to a universal device fortalking, texting, photos, videos, music, games,calculating, etc. As shown in Figure 18, there havebeen four major generations of equipment, with themost advanced generation being called 3G. Theprevious generation, 2.5G, enabled narrowbandapplications like picture sharing and downloadingtunes, whereas 3G offers enough bandwidth (400Mb/s to 700 Mb/s) to handle broadband applications.However, system capacity is lot less than DSL andcable modems, meaning that it cannot handle lots ofcustomers using data intensive applications withoutbogging down. It also costs more 60 per month, butit is mobile with lots of coverage, explaining itsrapidly growing popularity (see Figure19). Forexample, mobile wireless data users increased frombelow one million in June 2005 to eleven million inJune 2006.15100%US Broadband AccessCellular 3GFigure 19Wirless Mobile BroadbandPercentage of PopulationWireless broadband allows users to connect to theInternet at speeds comparable to the low end of whatis available with DSL and cable modems. It is comingprimarily from two directions: the cellular telephoneworld and the wireless data world.0%20002005201020152020YearSource: Technology Futures, Inc.WiMAXThe other major wireless broadband technology isWiMAX, which was originally developed as analternative way to provide broadband to stationarycomputers users.16 For example, Clearwire, foundedby in 2003 by Craig McCaw, of early cellular fame,offers service in dozens of mostly smaller markets for 29.99 to 49.99. It uses indoor antennas and off-theshelf customer equipment, provides service up to 1.5Mb/s, and, in most cases, competes directly with DSLand cable modem service. The biggest WiMAXplayer, at least for now, is Sprint/Nextel whichcontrols the lion’s share of the currently availableWiMAX spectrum in the major metropolitan areas(85% of pops in the top 100 BTAs). Sprint/Nextel hascommitted to a new mobile version of WiMAX, called802.16e, making it competitive with 3G cellular. (Aglance at Figure 20 makes clear why it’s the rightchoice.) With its gobs of spectrum (120 MHz in mostareas), the Sprint/Nextel network will have muchlarger capacity than 3G. In fact, Sprint/Nextel iscalling Mobile WiMAX “4G” in reference to thecellular generation that comes after 3G.16For an analysis of the capacity and costs of WiMAX, see L. K.Vanston, Assessment of Wireless Broadband as a Competitor toWireline Broadband (Austin, TX: Technology Futures, Inc., 2006)9
INTERNET VoICE (VoIP)Clearwire Service AreasSource: www.clearnet.comFigure 20Why Mobile WiMAX?201816121086Mobile WirelessBroadbandUsersFixed WirelessBroadbandUsers420701995US Broadband AccessMillions1420002005201020152020YearSource: Technology Futures, Inc.Apparently GOOGLE is interested inWireless Broadband, tooMay 23, 2007VoIP uses Internet technology (packet switching)instead of traditional telephone technology (circuitswitching) to make voice phone calls. There areseveral forms of VoIP. With one form, VoIP is usedinternally by the carrier (or carriers) offering whatotherwise appears to be standard telephone service.For example, the digital telephone service offered bymost cable companies uses VoIP. The carriers use thistechnology because it is more efficient, cutting thecost of switching by at least half compared totraditional circuit switching. Similarly, manyenterprises are also adopting VoIP on their privatenetworks. These developments make voice servicecheaper and make traditional switching obsolete, butthey won’t change the world fundamentally.Another form of VoIP, non-carrier VoIP, willchange the world. Non-carrier VoIP includes peer-topeer services like Skype that run directly on theInternet. It also includes voice services tied to instantmessaging service such as MSN Messenger, AOLMessenger, Yahoo! Messenger Voice Chat, andGoogle Talk. Finally, there are any number ofintegrated applications including interactive games,unified messaging, help desks, net meetings. Althoughnon-carrier VoIP can be used to make cheap calls, thereal potential is in these integrated applications wherevoice is simply an element of a larger experience. Anearly application is eBay using Skype to connectbidders to sellers to ask questions about merchandise.We don’t know whether that particular applicationwill be successful, but it’s a good bet that if it’s not,others will be. VoIP makes voice part of the hyperdynamic Internet world, subject to all the creativity,new ideas, and danger on an international scale.Integrated Applications ExamplesGoogle pitches idea on radio-spectrum auction to FCCGoogle has proposed to the FCC that it allow a "real-timeairwaves auction model" for the radio spectrum that theFCC will auction off. The Google model would allow aholder of a spectrum license to auction off unusedspectrum to other bidders on a wholesale basis. As thebasis for its proposal, Google said that in some casesonly 5% of available spectrum was currently being used.USA TODAY/Associated Press (5/22)10 Network-based meetings, including conferencecalls Unified Messaging Unified Help Desks eBay – contact seller Games, e.g., Counter-Strike A million other applications the Interworld willdream upA New Telecommunications World
Further, this world is not limited to the wirelineInternet, but to wireless as well, especially now thatwe have wireless broadband. Most wireless voicetoday goes through the normal voice channelcontrolled and switched by the cellular carrier.However, sophisticated enough handsets could do theequivalent of wireline non-carrier VoIP. Given thatcellular carriers control much of the handset market inthe United States, this may take some time. However,given that 3G communications are already being usedin laptops and PDAs, and given the convergence ofdevices, it only that a matter of time.A precursor indicating the potential of marryingwireless, voice, and the Internet is an experimentaldirectory assistance service by Google where usersdial an 800 number to reach Google, which recognizeswhat they say and provides information on thebusinesses in the city that fit their criteria. It’s
Internet. The significance of convergence is truly driven home when we consider the convergence of content. Consider each item listed in Figure 2 and how far we have gotten in the transition from traditional standalone content to computer/ Internet-based content. Figure 1 Telecom Convergence Broadband Internet V o i c e D at V i d e o Wi r e l .