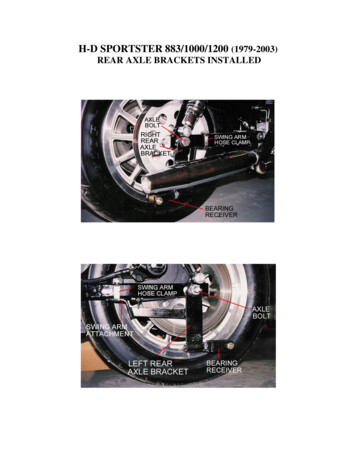
Transcription
Real Wage Trends, 1979 to 2019Updated December 28, 2020Congressional Research Servicehttps://crsreports.congress.govR45090
Real Wage Trends, 1979 to 2019SummaryWage earnings are the largest source of income for many workers, and wage gains are a primarylever for raising living standards. Reports of stagnant median wages have therefore raisedconcerns among some that economic growth over the last several decades has not translated intogains for all worker groups. To shed light on recent patterns, this report estimates real (inflationadjusted) wage trends at the 10th , 50th (median), and 90th percentiles of the wage distributions forthe workforce as a whole and for several demographic groups, and it explores changes ineducational attainment and occupation for these groups over the 1979 to 2019 period.Key findings of this report include the following: Real wages rose at the top of the distribution, whereas wages rose at lowerrates or fell at the middle and bottom. Real (inflation-adjusted) wages at the90th percentile increased over 1979 to 2019 for the workforce as a whole andacross sex, race, and Hispanic ethnicity. However, at the 90th percentile, wagegrowth was much higher for White workers and lower for Black and Hispanicworkers. By contrast, middle (50th percentile) and bottom (10th percentile) wagesgrew to a lesser degree (e.g., women) or declined in real terms (e.g., men).The gender wage gap narrowed, but other gaps did not. From 1979 to 2019,the gap between the women’s median wage and men’s median wage becamesmaller. Gaps expanded between the median wages for Black and White workersand for Hispanic and non-Hispanic workers over the same period.Real wages fell for workers with lower levels of educational attainment androse for highly educated workers. Wages for workers with a high schooldiploma or less education declined in real terms at the top, middle, and bottom ofthe wage distribution, whereas wages rose for workers with at least a c ollegedegree. The wage value of a college degree (relative to a high school education)increased markedly over 1979-2000. The college wage premium has leveledsince that time, but it remains high. High-wage workers, as a group, benefitedmore from the increased payoff to a college degree because they are the besteducated and had the highest gains in educational attainment over the 1979 to2019 period.Education and occupation patterns appear to be important to wage trends.Worker groups studied in this report were more likely to have earned a bachelor’sor advanced degree in 2019 than workers in 1979, with the gains in collegedegree attainment being particularly large for workers in the highest wagegroups. For some low- and middle-wage worker groups, however, theseeducational gains were not sufficient to raise wages. Workers’ occupationalcategories appear to matter as well and may help explain the failure of educationalone to raise wages.The focus of this report is on wage rates and changes at selected wage percentiles, with someattention given to the potential influence of educational attainment and the occupationaldistribution of worker groups on wage patterns. Other factors are likely to contribute to wagetrends over the 1979 to 2019 period as well, including changes in the supply and demand forworkers, labor market institutions, workplace organization and practices, and macroeconomictrends. This report provides an overview of how these broad forces are thought to interact withwage determination, but it does not attempt to measure their contribution to wage patterns overthe last four decades. For example, changes over time in the supply and demand for workers withCongressional Research Service
Real Wage Trends, 1979 to 2019different skill sets (e.g., as driven by technological change and new international trade patterns)are likely to affect wage growth. A declining real minimum wage and decreasing unionizationrates may lead to slower wage growth for workers more reliant on these institutions to providewage protection, whereas changes in pay-setting practices in certain high-pay occupations, theemergence of superstar earners (e.g., in sports and entertainment), and skill-biased technologicalchanges may have improved wage growth for some workers at the top of the wage distribution.Macroeconomic factors, business cycles, and other national economic trends affect the overalldemand for workers, with consequences for aggregate wage growth, and may affect employers’production decisions (e.g., production technology and where to produce) with implications for thedistribution of wage income. These factors are briefly discussed at the end of the report.Congressional Research Service
Real Wage Trends, 1979 to 2019ContentsIntroduction . 1Real Wage Trends . 2Wage Trends for Low, Middle, and High Earners by Sex, Race, Ethnicity, andEducational Attainment . 7Low-Wage Workers . 8Middle-Wage Workers. 9High-Wage Workers . 9Wage Gaps . 9Wages by Educational Attainment: The College Premium . 10Skilled Trades . 13Worker Characteristics by Wage Group . 14Low-Wage Workers . 16Middle-Wage Workers. 17High-Wage Workers . 17Factors Affecting Wage Trends. 21Market Factors . 21Institutional Factors . 23Macroeconomic Factors. 24FiguresFigure 1. Annualized Real Wage Growth by Percentile and Demographic . 6Figure 2. Wages at Selected Percentiles, by Sex, Race, and Ethnicity, in 1979 and 2019 . 8Figure 3. Median Wage Ratios, 1979-2019. 10Figure 4. Median Wage by Educational Attainment . 12Figure 5. College Degree Wage Premium and Advanced Degree Wage Premium, Relativeto a High School Education or Less. 13Figure 6. Median Hourly Wages by Broad Occupation Group, May 2019 . 15TablesTable 1. Real Wage Trends over 1979-2019, by Selected Demographic Characteristics . 4Table 2. Wage Trends by Education and the Higher-Education Wage Premium . 11Table 3. Occupations with High Projected Employment Growth and High AnnualEarnings That Do Not Require a Post-Secondary Degree. 14Table 4. Low-Wage Workers’ Educational Attainment and Occupation, by SelectedDemographics, 1979 and 2019 . 18Table 5. Middle-Wage Workers’ Educational Attainment and Occupation, by SelectedDemographics, 1979 and 2019 . 19Table 6. High-Wage Workers’ Educational Attainment and Occupation, by SelectedDemographics, 1979 and 2019 . 20Congressional Research Service
Real Wage Trends, 1979 to 2019Table B-1. Worker Characteristics by Wage Tercile, 1979 and 2019 . 29AppendixesAppendix A. Data Used in this Report . 26Appendix B. Demographic and Occupational Composition of the Wage Distribution in1979 and 2019 . 28ContactsAuthor Information . 30Congressional Research Service
Real Wage Trends, 1979 to 2019IntroductionWage earnings are the largest source of income for many workers, and wage gains are a primarylever for raising living standards. 1 Evidence that wage growth has stagnated among low- andmiddle-wage workers has therefore been viewed with concern and has raised questions about thepatterns and magnitudes of these trends.This report addresses such questions by examining real (inflation-adjusted) wage trends over the1979 to 2019 period. 2 Specifically, it uses cross-sectional data collected from the CurrentPopulation Survey (CPS), a nationally representative sample of workers, to estimate real hourlywages at the 10th , 50th (median), and 90th percentiles of the wage distribution in each year, andthen explores how those wage levels change over time. 3 The sample comprises employed (fulland part-time), nonmilitary nonfarm wage and salary earners aged 25 to 64 years. Finally, allhourly wages were converted to 2019 dollars using the Consumer Price Index for All UrbanConsumers, U.S. City Average (CPI-U). 4 Appendix A provides details on the methodology usedin this report.While wages are typically the primary component of compensation—accounting for about 70%of compensation for the average worker—non-wage compensation, such as employer-providedhealth insurance, paid leave, and retirement contributions, plays a role in living standards aswell. 5 Workers may experience gains or losses in wages but overall compensation may not trackthese changes exactly because of the cost of non-wage compensation. For example, a 2015 studyfrom the Bureau of Labor Statistics (BLS) found that while the overall median wage fell between2007 and 2014, total compensation was statistically unchanged, mainly due to the rising costs ofhealth insurance. 6 In addition, due to the relative costs and provisions of benefits for workers at1According to Congressional Budget Office (CBO) analysis of incomes in 2017, wage and salary income made up atleast 62% of market income for households in the lower 95 % of the income distribution. Labor income comprisednearly 58% of market income for households in the 96 th to 99 th percentiles. At 31%, labor earnings make up a lower,but still significant, share of household income among the top 1%. CBO defines market income as labor income,business income, capital gains realized from the sale of assets, capital income excluding capital gains, and incomereceived in retirement for past services or from other sources. Conceptually, these percentages underestimate laborincome because they exclude business income, and some business owners contribute labor to their firms and arecompensated in the form of business income in lieu of wages. CBO, The Distribution of Household Income andFederal Taxes, 2017, October 2020, supplementary data, at https://www.cbo.gov/publication/56575.2 T he analysis starts in 1979 because that is the first year for which comparable data to future years are available.3T he data used to create annual hourly wage distributions (1979 -2019) are from the Current Population Survey (CPS)Outgoing Rotation Groups (ORGs). Appendix A documents methods used to address outliers (i.e., implausibly low orhigh wage reports), the Census Bureau’s practice of “top -coding” information on earnings, and other issues.4T he CPI-U, which is a measure of the average change over time in prices paid by consumers for a market basket ofgoods and services, is commonly used to compare the real (inflation-adjusted) value of earnings or spending data atdifferent points in time. T he CPI-U, for example, is the most common index used to adjust state minimum wage rates.Other indices used to adjust for inflation in wage studies include the Consumer Price Index Research Series UsingCurrent Methods (CPI-U-RS) and the Price Index for Personal Consumption Expenditures (PCE). As a point ofcomparison, from 1979 to 2019, the average annual increases in the CPI -U, CPI-U-RS, and PCE were 3.2%, 3.0%, and2.7%, respectively. For a detailed description of indices used to adjust wages and a comparison of the values fordifferent indices, see CRS Report R44667, The Federal Minimum Wage: Indexation, by David H. Bradley. T here is nocorrection for regional price differences.In June 2020, about 32% of the average worker’s total compensation was in the form of employer-provided benefits.See Bureau of Labor Statistics, U.S. Department of Labor, Employer Costs for Employee Compensation – June 20202020, USDL-20-1736, Washington, DC, September 17, 2020, https://www.bls.gov/news.release/pdf/ecec.pdf.6 Kristen Monaco and Brooks Pierce, Compensation Inequality: Evidence from the National Compensation Survey,Bureau of Labor Statistics, U.S. Department of Labor, Monthly Labor Review, Washington, DC, July 2
28.12.2020 · and part-time), nonmilitary nonfarm wage and salary earners aged 25 to 64 years. Finally, all hourly wages were converted to 2019 dollars using the Consumer Price Index for All Urban Consumers, U.S. City Average (CPI-U).4 Appendix A provides details on the methodology used in this report. While wages are typically the primary component of compensation—accounting for about 70%