Transcription
MARCH2018JUNE 20192018Wilmington
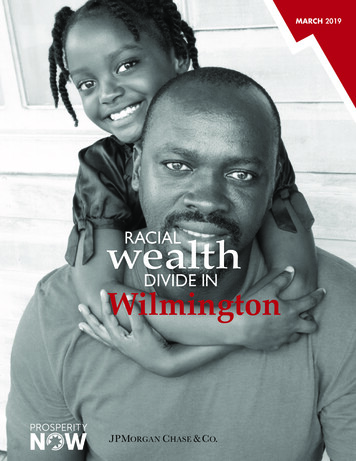
The Racial Wealth Divide in WilmingtonThe Racial Wealth Divide inWilmington, DERacial economic inequality is deeply embedded throughout the United States and profoundly impactscommunities throughout the country. This inequality is so prevalent that it is almost a universal phenomenonin cities across the nation, though it is always shaped by unique local socio-economic conditions. The RacialWealth Divide Initiative at Prosperity Now developed this profile to better understand how racial economicinequality affects the City of Wilmington, Delaware. This profile is also one of the first steps taken under theBuilding High Impact Nonprofits of Color project, funded by JPMorgan Chase. This project aims to advancebest practices and strengthen resources for nonprofits of color to better address racial economic inequality.How Do I Use This Data Profile?The following profile presents data on the economic inequalities within Wilmington. These statistics mayseem overwhelming; however, with more information about the challenges of racial economic inequality,there is greater opportunity to identify best practices and policies that can address racial economic inequalityand its foundation, the racial wealth divide.How Does Wilmington Compare to the Rest of the Nation?Wilmington’s median income of 40,065 is substantially below the national median income of the UnitedStates, which is 55,322. This is attributed to the large population of Black residents (57%) whose medianhousehold income is 30,034, which is half of the White residents’ household income in Wilmington( 60,772). In addition, there is a growing Latino population in Wilmington with a low median householdincome of 32,976. A small but growing population (about 1,000 people) of Asian Americans have a highermedian household income of 70,461. We also see a decline in median household income in Wilmingtonsince 2000 which corresponds with the decline in the higher income White population and the growingmajority of lower-income Black and Latino households. Overall, racial economic inequality in Wilmingtonis worse than what we see nationally for Black and Latino households.What’s Next?Though we understand that nonprofit intervention is not enough to bridge a racial wealth divide thatwas created by national, state and local policies and practices we do believe it is important to build thecapacity of nonprofits of color (see pages 14 and 15 for more information), so they can increase their impactin the communities that need them most. The lack of assets and resources experienced by nonprofits ofcolor reflects the lack of assets and resources facing communities of color as a whole and has been a goodbeginning point for JPMorgan Chase and Prosperity Now to raise awareness about the racial wealth divide.Sincerely,Lillian SinghVice PresidentRacial Wealth Divide InitiativeProsperity Now22MARCH20192019MARCHEbony WhiteSenior Program ManagerRacial Wealth Divide InitiativeProsperity NowForFor moremore information,information, visitvisit www.prosperitynow.orgwww.prosperitynow.org
The Racial Wealth Divide inWilmingtonEconomic inequality has expanded over the past decade, shutting the windowsof opportunity to millions of Americans. In urban centers, this growing inequalityhas manifested through gentrification and the continued concentration of povertyin communities of color.Wilmington is a microcosm of racial inequality in larger cities across the UnitedStates. Despite being a small city, the racial economic inequality seen across thecountry is reflected in Wilmington. Across all economic indicators, Black andLatino residents in Wilmington lag significantly behind their White counterparts.Regarding median income, the disparity between Black and Latino householdsand White households is markedly greater than the disparities at the county,state, and national levels. While White households earn a median income of 60,772, Black households make half of that at 30,034, and Latino householdsearn a median of 32,976. Asian households in Wilmington have the highestmedian income of 70,461. To further highlight how Wilmington reflects nationalracial economic disparity, the city’s White income poverty rate of seven percentis less than a third of the income poverty rate of Black (26.9%) and Latino (25.3%)families, which is also true across the country.One of the key gauges of financial security and wealth building is homeownership.While Wilmington’s Black-White racial divide in homeownership is significant,it is smaller than the national divide. White residents in Wilmington have ahomeownership rate of 58.2% versus the national White homeownership rate of71.4%, while Blacks have a homeownership rate of 40.5%, similar to the nationalBlack homeownership rate of 41.9%. Wilmington’s Latino homeownershiprate of 30.3% diverges the most from the national trend, with national Latinohomeownership at 45.8%. The gap in median property value between Blacks andWhites in Wilmington is nearly the same as the national gap. The median propertyvalue for White homeowners is 189,000 in Wilmington and 200,000 nationally,while the property value for Black homeowners is 125,000 in Wilmington and 138,000 nationwide.The Racial Wealth Divide Initiative of Prosperity Now understands that there willhave to be significant change and commitment in Wilmington if the city wants tobreak away from racial economic inequality. Through work funded by JPMorganChase, the Racial Wealth Divide Initiative has launched the Building High ImpactNonprofits of Color project in Wilmington to strengthen nonprofits of colorthat support economically marginalized communities by creating innovativestrategies to help these communities build wealth.WILMINGTON HIGHLIGHTSPOPULATION1% 2%12% ASIAN OTHERLATINO28%WHITE57%BLACKMEDIAN HOUSEHOLDINCOMEBlack and Latino households' medianincome is1/2of White HouseholdsCOST-BURDENED RENTERS3 in 5 of Black rentersare cost-burdenedINCOME POVERTYOver1/4of Black and Latino familiesare living in income povertyFor more information, visit www.prosperitynow.orgMARCH 20193
The Racial Wealth Divide in WilmingtonGROWING DIVERSITY WITHOUT POPULATION GAINSWilmington’s initial population growth was driven by industrialization and regional connectivity.Wilmington’s industrial legacy began in the early 1800s when the DuPont Chemical Company startedmanufacturing gunpowder in the city. The 1837 completion of the Philadelphia, Wilmington and BaltimoreRailroad made the city accessible by water, road, and rail on the main north-south transportation route,providing easy reach to most markets. The regional economy flourished, and Wilmington steadilydeveloped, providing resources for the growing industries. Economic and population growth wouldcontinue as both World Wars stimulated the city’s industries, in turn attracting more companies andmaking it a national production center for ships, railroad cars, gunpowder, shoes, uniforms, and otherwar-related goods.1 In 1860, there were 21,250 people in Wilmington. By 1920, that number had grown to110,168.After the Civil War, many corporations flocked toWilmington due to Delaware’s corporate-friendlytax laws. Today, more than half of all Fortune 500companies have established offices in Wilmington.While many corporations located themselves inor near Wilmington, the increasing number ofautomobiles and roadways in the 1950s madecommuting from the suburbs into the city possibleand contributed to significant population lossesin Wilmington. Urban renewal projects in the1960s and 1970s—which cleared many blocks ofhousing—and the construction of I-95 also left theirmark on the city.2 Despite substantial investment in central Wilmington, revitalization for communities haslagged, and the overall poverty rate continues to increase.Though Wilmington’s population has been stagnant since 1980, the city has experienced some noticeabledemographic shifts. The White population has consistently declined for decades, from 45.1% in 1980 to27.6% in 2016. Black residents have grown at a modest rate from 51.1% to 56.6% during this period, whileAsian and Latinos grew at a higher rate, going from 0.2% to 1.4% and 4.9% to 12.2%, respectively.The median incomes of different populations have also fluctuated in Wilmington over the last 40 years.Between 1980 and 1990, following the enactment of the Financial Center Development Act of Delaware in1981, Wilmington saw an increase in income across all major racial and ethnic demographic groups. Overallmedian income rose from about 39,000 in 1980 to 51,000 ten years later.3 Between 1990 and 2000, incomestagnated, with White median income staying around 61,000, and Black and Latino income remainingaround 42,000.The Great Recession significantly regressed median incomes for Blacks by 26% and Latinosby 22% compared to median incomes in 2000. White median income in Wilmington only declined by lessthan 5% during this period, and since 2010, Black, Latino and White incomes have remained relativelystagnant.1 “City History,” The City of Wilmington Delaware, ty-of-wilmington/city-history.2 Ibid.3 1980 Census. Washington, DC: U.S. Department of Commerce, Census Bureau, 1980.4MARCH 2019For more information, visit www.prosperitynow.org
The Racial Wealth Divide in WilmingtonHOUSEHOLDS OF COLOR INLIQUID ASSET POVERTY RACIAL WEALTH DIVIDEIN WILMINGTON, DE61.3%Wilmington, DE is an example of how economic insecurity,which is common in Black and Latino households, can be seenclearly in small cities. The challenge for Wilmington, alongwith many majority-minority cities across the country, is asthe population becomes majority Black and Latino the effectsof deep racial economic inequality are more profound for thelocal economy as a whole.POPULATIONLIQUID ASSET IAN28%n/aMEDIAN HOUSEHOLD INCOMEWHITE5 30,03412% 32,976 60,772 70,461LATINO1% 2%BLACKASIAN OTHERHOUSEHOLD WITH ZERO NET WORTHHOMEOWNERSHIP RATELATINOWHITECOST-BURDENED RENTERS62.5%58.2%WHITE40.3%33% 31% BLACK30.3%n/aLATINOLATINOBLACKWHITEASIANNote: Estimates of liquid asset poverty and households with zero net worth not published by Prosperity Now Scorecard are derived from a statistical model to create geographic estimates at the local leveland are not meant to directly reflect the Survey of Income & Program data. Caution should be used in interpreting the local estimates as the statistical model is based on national surveys of fewer than 50,000Wealth estimates based on New Castle County (East Central), Wilmington City, DE PUMA.For more information, visit www.prosperitynow.orgMARCH 20195
The Racial Wealth Divide in WilmingtonHIGH SCHOOL DEGREE OR HIGHERINCOME POVERTY RATEBLACK81.2%LATINOWHITE26.9% 25.3% ks families have the highest incomepoverty rateOver 35% of Latinos do not have at least ahigh school degreePOPULATION GROWTH BROKEN DOWN BY 242016Source: 1990 Census. Washington, DC: U.S. Department of Commerce, Census Bureau, 1990; 2000 Census. Washington, DC: U.S. Department of Commerce, CensusBureau, 2000; 2006-2010 American Community Survey. Washington, DC: U.S. Department of Commerce, Census Bureau, 2011; 2012-2016 American CommunitySurvey. Washington, DC: U.S. Department of Commerce, Census Bureau, 2017.6MARCH 2019For more information, visit www.prosperitynow.org
The Racial Wealth Divide in WilmingtonNEW CASTLE COUNTY VS WILMINGTONWilmington is in New Castle County, one of only three counties that make up the state of Delaware. With atotal population of 551,997, New Castle County has experienced significant population growth since the mid20th century—a very different narrative from Wilmington.During Wilmington’s population peak in 1940, New Castle had a population of 179,562, meaning that 63% ofNew Castle’s population was in Wilmington. But this would change rapidly. By 1980, Wilmington had only18% of New Castle County’s population of 398,115.4Throughout the 1950s and 1960s,RACIAL COMPOSITIONWilmington saw a considerableNEW CASTLE COUNTYWILMINGTONdecrease in its White populationTOTAL POPULATION: 551,997TOTAL POPULATION: 71,502and a significant increase inits Black population. In 1950,326,993there were about 90,000 Whiteresidents in Wilmington andonly 17,000 Black residents. By1970, there were 35,000 Black130,912residents and only 45,000 Whiteresidents. The Black populationgrew more slowly than the White51,91240,436population declined, leading to28,383an overallpopulation decrease19,768 8,73871,024in Wilmington.5 Meanwhile,BLACKLATINOWHITEWHITEASIANBLACK LATINO ASIANNew Castle County experiencedrapid growth until the 1970s,with its population more than doubling to 398,115. This was due to the expansion of roads and highways thatmade it possible for higher-income workers, disproportionately White, to move into the suburbs and commuteto work.Like many former industrial cities driven by their manufacturing sectors, Wilmington never found anindustry to replace the jobs that manufacturing supplied. The Financial Center Development Act of Delawarein 1981 brought many credit card operations to Wilmington, strengthening the economies of Wilmingtonand especially New Castle County. Since 1980, New Castle County’s economy has been much stronger thanWilmington’s overall. The data show that New Castle County residents are better positioned financially thanWilmington’s across all racial groups. In New Castle, median income is 73,539 for White residents, 50,266for Black residents, 46,100 for Latino residents and 93,125 for Asian residents. Wilmington’s median incomeof 40,065 is substantially below the national median income of the United States, which is 55,322. Thelow Wilmington median income can be attributed to the large Black population, whose median income is 30,034 (below the national Black median income of about 36,000), and a growing Latino population inWilmington with a low median income of 32,976. A small but growing population (about 1000 people) ofAsian Americans have a strong median income of 70,461, which is good news for a city that otherwise seesgrowing communities of color with lower incomes.4 Center for Applied Demography and Survey Research, University of Delaware. (1996). Demographic and Commuting Trends in Delaware. Retrievedfrom df.5 David Ames, et al., African American Population of Delaware: 1800 to 1980, 6/CHAD13.pdf;sequence 1For more information, visit www.prosperitynow.orgMARCH 20197
The Racial Wealth Divide in WilmingtonRACIAL BREAKDOWN BY CENSUS TRACT8MARCH 2019For more information, visit www.prosperitynow.org
The Racial Wealth Divide in WilmingtonMEDIAN HOUSEHOLD INCOME9For more information, visit www.prosperitynow.orgMARCH 20199
The Racial Wealth Divide in WilmingtonA SMALL CITY WITH BIG CITY PROBLEMSWith a population of 71,502, Wilmington is one of the smallest cities to be included in a major metro area(Philadelphia-Camden-Wilmington, PA-NJ-DE-MD) in the U.S. While smaller metro areas tend to havelower rates of racial and economic segregation, Wilmington is an outlier, with high rates of concentratedpoverty (racially and geographically), elevated murder rates and limited avenues for economic mobility.6Wilmington has faced a population decline and stagnation similar to larger cities, like Detroit and Chicago.It is not covered as much as other cities, but Wilmington also struggles with high incarceration rates andhigh levels of violence.7 The Center for Disease Control reports that in some of the small city’s more violentneighborhoods 60% of children have experienced trauma while only a fifth of children living in the restof Delaware has this type of experience. Similarly, though only 22% of Delaware residents are Black, theymake up about 60% of the prison population.8Overall, White residents are doing better in educational attainment compared to Whites nationally; thiscannot be said for residents of color. The percentage of White residents in Wilmington with a bachelor'sdegree is 22.9%, which is 2.6 times higher than that of Black resident's bachelor's degree attainment and 3.5times higher compared to Latinos. Asian Americans are performing better at 20.3% than other residents ofcolor. In a time when a college degree is often a minimum requirement to secure a job, it is unsurprisingthat the unemployment rate is two times higher for Black residents.6 Richard Florida, “The U.S. Cities Where the Poor Are Most Segregated From Everyone Else,” City Lab, March 24, 2014, here-poor-are-most-segregated/8655/.7 Delaware Online, “Wilmington: Most Dangers Place in America for Youth,” 8 Delaware Online, “Del. Chief Justice Targets Prison Racial Disparities,” afer/22001803/.10MARCH 2019For more information, visit www.prosperitynow.org
The Racial Wealth Divide in WilmingtonPOPULATION AND DEMOGRAPHICSData MeasuresWilmington, DelawareTotal PopulationWhiteBlack or African AmericanAsianHispanic or LatinoTotal HouseholdsWhiteBlack or African AmericanAsianHispanic or LatinoU.S. Citizenship RateWhiteBlack or African AmericanAsianHispanic or LatinoSpeak English Less Than "Very Well"WhiteBlack or African AmericanAsianHispanic or 5%28.6%New Castle ed 31.6%11HOUSEHOLDFINANCESData MeasuresWilmington, DelawareMedian Household IncomeWhiteBlack or African AmericanAsianHispanic or LatinoIncome Poverty RateWhiteBlack or African AmericanAsianHispanic or LatinoAsset Poverty RateWhiteBlack or African AmericanAsianHispanic or LatinoLiquid Asset Poverty RateWhiteBlack or African AmericanAsianHispanic or LatinoHouseholds with Zero Net WorthWhiteBlack or African AmericanAsianHispanic or Latino 40,065 60,772 30,034 70,461 29.6%61.2%64.7%24.3%14.9%32.6%30.9%New Castle County,Delaware 66,283 73,539 50,266 93,125 .2%Delaware 61,017 66,238 47,450 87,520 44,8358.2%4.8%14.2%4.0%24.9%-United States 55,322 61,018 36,651 76,667 .7%Note: Estimates of liquid asset poverty and households with zero net worth not published by Prosperity Now Scorecard are derived from a statistical model to create geographic estimates at the locallevel and are not meant to directly reflect the Survey of Income & Program data. Caution should be used in interpreting the local estimates as the statistical model is based on national surveys of fewerthan 50,000 households.“-“ indicates that no data is availableFor more information, visit www.prosperitynow.orgMARCH 201911
The Racial Wealth Divide in WilmingtonEMPLOYMENT AND BUSINESS OWNERSHIPData MeasuresWilmington, DelawareLabor Force Participation RateWhiteBlack or African AmericanAsianHispanic or LatinoUnemployment RateWhiteBlack or African AmericanAsianHispanic or LatinoBusinesses W/o Paid EmployeesWhiteBlack or African AmericanAsianHispanic or LatinoBusiness ValueWhiteBlack or African AmericanAsianHispanic or 65.5%92.7%48.3%82.6% 6,593,900 1,022,674 62,127 501,247-New Castle 7%4.7%8.8%3.8%5.0%72.3%73.6%93.6%65.9%88.4% 2,956,280 633,898 46,859 416,193 163,899United %75.2%76.4%93.6%65.0%88.5% 2,059,183 539,731 44,151 392,439 7%80.4%79.4%95.8%74.9%91.3% 1,213,944 508,406 58,119 364,717 143,271HOUSING & HOMEOWNERSHIPData MeasuresWilmington, DelawareHomeownership RateWhiteBlack or African AmericanAsianHispanic or LatinoMedian Property ValueWhiteBlack or African AmericanAsianHispanic or LatinoCost Burdened RentersWhiteBlack or African AmericanAsianHispanic or LatinoCost Burdened OwnersWhiteBlack or African AmericanAsianHispanic or Latino45.9%58.2%40.5%40.3%30.3% 162,400 189,000 125,00056.4%47.8%60.0%62.5%33.1%27.8%40.4%-New Castle County,DelawareDelawareNew Castle County,DelawareDelaware68.7%78.5%50.8%56.1%46.0% 244,300 250,000 185,000 325,000 3%38.3%United States70.9%79.3%52.2%59.1%45.8% 233,100 230,000 180,000 300,000 6%37.0%63.6%71.4%41.9%57.9%45.8% 184,700 200,000 138,000 350,000 7%38.1%EDUCATIONAL ATTAINMENTData MeasuresHigh School Degree or HigherWhiteBlack or African AmericanAsianHispanic or LatinoBachelor's DegreeWhiteBlack or African AmericanAsianHispanic or LatinoGraduate or Professional DegreeWhiteBlack or African AmericanAsianHispanic or LatinoWilmington, ted 6%“-“ indicates that no data is available12MARCH 2019For more information, visit www.prosperitynow.org
The Racial Wealth Divide in WilmingtonDATA MEASURES & SOURCESData MeasureMeasure DescriptionSourceU.S. Census Bureau, 2012-2016 American Community SurveyTotal PopulationU.S. Census Bureau, 2012-2016 American Community SurveyTotal White, non-Hispanic populationU.S. Census Bureau, 2012-2016 American Community SurveyBlack or African AmericanTotal Black or African American alone populationU.S. Census Bureau, 2012-2016 American Community SurveyAsianTotal Asian alone populationU.S. Census Bureau, 2012-2016 American Community SurveyHispanic or LatinoTotal Hispanic or Latino population of any raceU.S. Census Bureau, 2012-2016 American Community SurveyOtherTotal population indentifying as Native Hawaiian and Other Pacific Islander alone,Some other race alone, or Two or more racesU.S. Census Bureau, 2012-2016 American Community SurveyPopulation with DisabilityPercentage of population living with a disabilityU.S. Census Bureau, 2012-2016 American Community SurveyU.S. Citizenship RatePercentage of population that are U.S. citizensU.S. Census Bureau, 2012-2016 American Community SurveySpeak English Less Than"Very Well"Percentage of population that speaks English less than "very well"U.S. Census Bureau, 2012-2016 American Community SurveyMedian Household IncomeMedian household income in the past 12 monthsU.S. Census Bureau, 2012-2016 American Community SurveyIncome Poverty RatePercentage of all families with income in the past 12 months below the federalpoverty thresholdU.S. Census Bureau, 2012-2016 American Community SurveyAsset Poverty RatePercentage of households without enough net worth (the value of all assets minusall debts and liabilities) to replace income at the poverty level for 3 months— 6,275for a family of four in 2018—if they experience a sudden job loss, a medicalemergency or another financial crisis leading to a loss of stable income.Estimates calculated by Marin Economic Consulting, basedon U.S. Census Bureau's 2014 Survey of Income and ProgramParticipation, Wave 1 (2013) and 2011-2015 AmericanCommunity SurveyLiquid Asset Poverty RatePercentage of households without enough savings (money in the bank, cash orfinancial accounts) to replace income at the poverty level for 3 months— 6,275 fora family of four in 2018—if they experience a sudden job loss, a medical emergencyor another financial crisis leading to a loss of stable income.Estimates calculated by Marin Economic Consulting, basedon U.S. Census Bureau's 2014 Survey of Income and ProgramParticipation, Wave 1 (2013) and 2011-2015 AmericanCommunity SurveyHouseholds with Zero NetWorthPercentage of households with zero or negative net worthEstimates calculated by Marin Economic Consulting, basedon U.S. Census Bureau's 2014 Survey of Income and ProgramParticipation, Wave 1 (2013) and 2011-2015 AmericanCommunity SurveyLabor Force ParticipationRatePercentage of civilian labor force who are employed or unemployed but activelysearching for employmentU.S. Census Bureau, 2012-2016 American Community SurveyUnemployment RatePercentage of civilian labor force who are unemployed but actively searching foremploymentU.S. Census Bureau, 2016 American Community SurveyBusinesses Without PaidEmployeesPercentage of total businesses that do not employ paid workersU.S. Census Bureau, 2012 Survey of Business OwnersBusiness ValueAverage sales or reciepts earned per firmU.S. Census Bureau, 2012 Survey of Business OwnersHomeownership RatePercentage of occupied housing units that are owner occupiedU.S. Census Bureau, 2012-2016 American Community SurveyMedian Property ValueMedian value, in 2014 dollars, of owner-occupied housing units.U.S. Census Bureau, 2012-2016 American Community SurveyCost Burdened RentersPercentage of renter-occupied units spending 30% or more of household income onrent and utilitiesU.S. Census Bureau, 2012-2016 American Community SurveyCost Burdened OwnersPercentage of mortgaged owners spending 30% or more of household income onselected monthly owner costsU.S. Census Bureau, 2012-2016 American Community SurveyHigh School Degree orhigherPercentage of population 25 and older who have a high school degree, GED oralternative degree onlyU.S. Census Bureau, 2012-2016 American Community SurveyBachelor's DegreePercentage of population 25 and older who have at least a bachelor's (4 yearcollege) degreeU.S. Census Bureau, 2012-2016 American Community SurveyGraduate or ProfessionalDegreePercentage of population 25 and older who have a graduate or professional degreeU.S. Census Bureau, 2012-2016 American Community SurveyEducationalAttainmentHousehold FinancesPopulation DemographicsTotal populationWhiteEmployment &Business OwnershipTotal number of householdsHousing &HomeownershipTotal Households13For more information, visit www.prosperitynow.orgMARCH 201913
The Racial Wealth Divide in WilmingtonBUILDING HIGH IMPACT NONPROFITS OF COLOR PROJECTTo bridge the national racial wealth divide, the assets of communities of color must grow. Nonprofits of colorare essential institutions that must be strengthened to build assets and advance economic security. ProsperityNow’s Racial Wealth Divide Initiative aims to support nonprofits of color as part of our asset developmentwork targeting communities of color in our Building High Impact Nonprofits of Color project. The project hasthree key goals: to build leadership and organizational capacity, improve organizations’ understanding of theconnection between assets and the racial wealth divide, and provide networking and convening opportunitiesso organizations of color can build strong relationships within and across networks.Building High Impact Nonprofits of Color started in 4 cities: New Orleans, Baltimore, Chicago, and Miami.In 2018 this project also launched in Dallas, Texas and Wilmington, Delaware. This project will equip moreorganizations with strategies and skills to start, expand or improve wealth-building initiatives for communitiesof color across the country. Prosperity Now’s Racial Wealth Divide Initiative will continue partnering withorganizations to support their growth and development, share Prosperity Now resources and analysis, andadvance the development of best practices for addressing racial economic inequality at the local level.Below are the seven nonprofit organizations of color that the Racial Wealth Divide Initiative is working withinWilmington. Each of these organizations is working within their respective communities to help bridge theracial wealth divide and promote financial literacy and capability in their communities. Despite the wideningracial wealth divide, these organizations and others like them are developing, piloting, managing andreplicating programs and best practices to address the inequalities in Wilmington and the nation.BUILDING HIGH IMPACT NONPROFITS OF COLOR IN WILMINGTONCHRISTINA CULTURAL ARTS CENTER (CCAC) (http://www.ccacde.org)Christina Cultural Arts Center’s (CCAC’s) mission is to make affordable arts,education, career training, exhibitions, and live performances accessible to youthand adults in a welcoming learning environment. CCAC has affordable arts,education, career pathways, a gallery and live performance programs available toall in a safe, welcoming atmosphere. The engagement of youth adults from lowto-moderate income families is emphasized. For nearly 70 years, CCAC has beenan anchor in the Delaware arts community and Wilmington's Creative District,focusing on the tenets of Hope, Knowledge, Inspiration, and Passion by providinginstruction and performance/exhibition opportunities in music, dance, drama,visual arts, and poetry.DELAWARE CENTER FOR HOMELESS VETERANS (DCHV) (http://dchv.org)The Delaware Center for Homeless Veterans, Inc., (DCHV) is a 501(c) (3) nonprofitthat has provided veteran-s
Wilmington, DE is an example of how economic insecurity, which is common in Black and Latino households, can be seen clearly in small cities. The challenge for Wilmington, along . Bureau, 2000; 2006-2010 American Community Survey. Washington, DC: U.S. Department of Commerce, Census Bureau, 2011; 2012-2016 American Community Survey. Washington .