Transcription
2/27/2020MicroLenders Forum 2020Profit and Loss AnalysisMarch 11, 20201Welcome P&L OverviewBookkeeping Foundation for Quality P<rend AnalysisMargin AnalysisExercises21
2/27/2020What You Will Leave Knowing Basic P&L Structure Elements of a Quality P&L Bookkeeping Suggestions to Create Quality P&L Key P&L Indicators of Business Health Helping Owners with Management Decisions using P&L Applying Margin and Trend Analysis to three companies3Both Lenders and CoachesBoth community lenders and business coaches should beversed in financial analysis basics Provide better advice to clients when you understandP&L and Balance Sheets – even if client has neitherBoth these financial statements are required forunderwriting larger loans42
2/27/2020What Can Financials Tell Us? Is business profitableBest pricing strategyWhich product or service lines are most profitableIs owner managing inventoryIs the owner managing overheadIs the business growing and how well is it managinggrowth5How Money Works in a BusinessEven if client does not have financials but you understand how: To analyze trends and margins Permanent working capital and operating cycle work Profits get used in fast growth A Balance Sheet works Seasonality and growth impact cashYou will be a better-informed lender or coach.It is hard to give quality advice if you don’t know these financialconcepts.63
2/27/2020What is a Profit & Loss Statement The Profit and Loss Statement measures revenues andexpenses over a defined period of time (month, quarter, year)Measures profitability: Whether the business is making a profiton what it sellsInsights from the P&L can help with reducing expenses,growing revenue, and increasing profit.All businesses need income and expense records to file a taxreturn7Profit and Loss StructureBasic formula Sales Cost of Goods SoldGross Profit OverheadNet Profit84
2/27/2020SalesIncome Sales RevenueThe revenue earned from the sale of goods and services.9Cost of Goods Sold Expenses incurred that are directly associated with theproduction or service delivery for sales in that period.Direct material and labor that went into thegoods/products sold that month/quarter/year.Also called Variable Expense, as it varies with salesvolume105
2/27/2020What is COGS? Manufacturing: Direct materials, direct labor, shipping Retail: Wholesale cost of inventory, shipping Service: Usually don't have COGS, but in some caseslabor and other costs are directly associated with servicedelivery11Microbusinesses and COGS Many microbusinesses cannot track COGSDon’t have inventory & sales tracking technology; time;know-howMight only calculate once per year with year-endinventory count (tax return)It might not matter with businesses that turn overinventory within 30 days (restaurant for example)126
2/27/2020Gross ProfitGross Profit Sales - COGS Demonstrates the ability to control direct production costs:Purchasing, labor and materials Also indicates viability of pricing One of the best measures to help product businessesbecome more profitable 13Overhead Ongoing expenses of operating a business: rent, phone,marketing, website, insurance, etc.Also called Fixed ExpenseDoesn’t vary much (or at all) with changes in salesvolume147
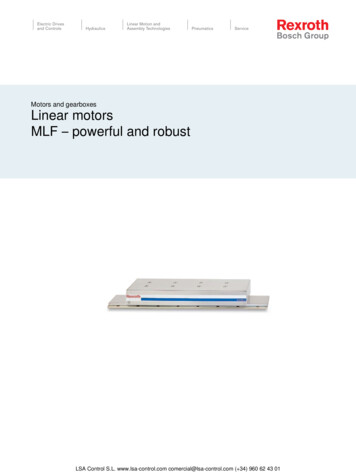
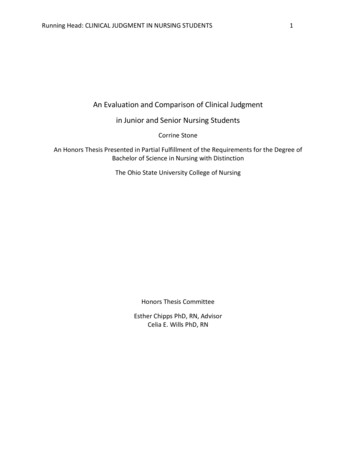
2/27/2020That Leaves Net Profit (or Loss)Net profit pays for (sole proprietor) Owners Draw Future expansion, like new equipment Principal portion of loan payment Income Taxes Inventory purchases, especially if buying in bulk orin high-growth mode Personal expenses15What Should Not Be on P&L* Personal Income Taxes or Personal ExpensesSales TaxOwners Draw (sole proprietorship)Principal portion of debt service (only interest portion is anexpense)Inventory purchases that will last more than 30 daysLoan CapitalEquity infusions*refer to this slide for today’s exercises168
2/27/2020P&L Quality Can’t do today’s analyses on P&L full of errors Common expense errors: See previous slide We’ll look at an error-ridden P&L and a clean one today17It All Starts with Bookkeeping Can’t do analysis without bookkeeping system With bad numbers, or no numbers, company flying blind Can lead to: Poor pricing and product selection Taking on contracts, leases, equipment too expensive ordoesn’t increase profitability Unfortunate financing decisions189
2/27/2020Easy to Fix in QuickBooks Type of AccountMerging AccountsEliminating sub-accountsAdding class or customer: job functionsSplitting transactionsChanging accountsP&L issues in general19Hard to Fix in QuickBooks Sales Tax or Payroll errors Switching to QB payroll mid-year Sales information already deposited Balance Sheet Accounts High volume of errors Errors going back years Equity mistakesJust Start Over2010
2/27/2020Bookkeeping Set up Suggestions* Build your own Chart of Accounts Eliminate all overlapping expense accounts Don’t use expense accounts to create detail Use sub-accounts sparingly Use COGS if applicable and do-able Avoid “Miscellaneous” – becomes a black hole Keep P&L to one page*refer to this slide for today’s exercises21P&L AnalysisAnalyzing historical performance Detects positive or negative trends in a company’s pastperformanceHelps business owner improve performance byidentifying opportunities or issuesHelps determine ability to pay new debt service2211
2/27/2020Key P&L Indicators Sales:Growing COGS:Stable / Falling Gross Profit: Rising Overhead:Stable / Falling Net Profit:Rising Net Profit enough to pay owner’s draw, taxes, expansionplans and existing debt23Insight Successful integration of growth: employees, commercialrent, new large contracts, two locationsOne source for determining Global Cash capacity for newdebtWith proper bookkeeping and report design, can supportstrategic management decisions about pricing andproduct lines2412
2/27/2020Trend AnalysisCompares a business’ progress to itself over time Measures progress by looking at total sales, expenses andnet profit in dollars Analysis comes through comparison of this month/year tolast month/year To conduct trend analysis we create spreadsheets* placingannual P&L’s side by side. * or a report from bookkeeping reporting25Margin Analysis Convert the P&L numbers into percentages of total salesfor more complete analysis* COGS/Sales COGS margin Gross Profit/Sales Gross Profit margin Overhead/Sales Overhead margin Net Profit/Sales Net Profit margin*Also is helpful to compare margins over time in a spreadsheet2613
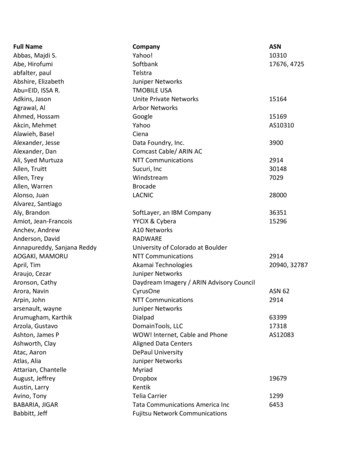
2/27/2020ABC Gift Card CompanyUsing the P&L accounting, bookkeeping and reporting ruleswe’ve reviewed so far Please find the ways this P&L does not comply.What would you recommend to a business owner whocame in with this P&L?27Retail Store with Two LocationsThis P&L was created using QB “Classes” function, thatcan separate income and expense items by location,division, product line, etc. Review the margin analysis for Store 1 and Store 2.What feedback would you give to the business ownerwho brought in this P&L?2814
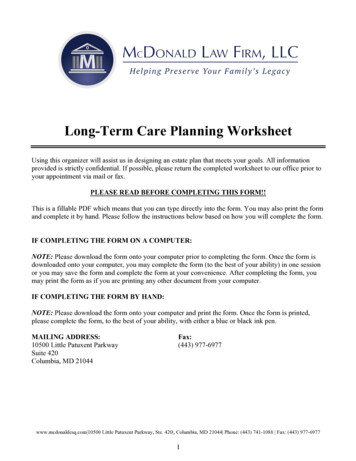
2/27/2020QRS Construction CompanyThis P&L is the sample company in my QB program Please complete the margin percentages Complete the Analysis section at the bottom. Using Key P&L Indicators and Insight, what feedbackwould you give the business owner with this P&L?29Suggestions Become an expert on bookkeeping software/app,accounting rules, financial reportsDevelop expertise on accurate set up, leading to cleanreports tailored for that businessLearn how the P&L, Balance Sheet, Working Capital,Operating Cycle work (NDC Business Credit Analysis)3015
2/27/2020Thank You!Call Us!415-922-4480 Get on CAMEO’s list for greatinfo and opportunities:CameoNetwork.org Contact Heidi Pickman with yourprogram requests and ideas hpickman@cameonetwork.org3116
1:06 PMABC Company01/12/09Profit & LossAccrual BasisJanuary 2006 through December 2008Jan '06 - Dec 08Ordinary Income/ExpenseIncomeReimbursed ExpensesSales157.0795,667.90Total Income95,824.97Cost of Goods SoldCost of Goods Sold10,440.30Total COGS10,440.30Gross ProfitExpenseAdvertizongAutomobile ExpenseBANK FEEBUSINESS LIABILITY INSCapital ioan payment-Owner CCapital loan payment-Owner ACapitol loan payment-Owner Dcommission feesEQUIPMENT REPAIREquipment SupplyFLOAT-PAIDGENERAL SUPPLYInsuranceLiability InsuranceTotal InsuranceINTERNET BANK FEESLOAN REPAYMENTNew Equipmentpetty cashPostage and DeliveryPrinting and ReproductionProfessional FeesAccountingLegal 6,839.72300.001,283.75Total Professional Fees1,583.75REFUNDRentRepairsBuilding Repairs16.505,910.82582.77Total Repairs582.77SALES 5.00Total SuppliesTaxesStateTotal TaxesTelephoneTEXTTravel & EntMealsTotal Travel & EntTRAVEL & ENT.- GASTravel & Ent. LodgingUncategorized 39209.391,011.60948.390.00Page 1
1:06 PMABC Company01/12/09Profit & LossAccrual BasisJanuary 2006 through December 2008Jan '06 - Dec 08UtilitiesGas and ElectricUtilities - OtherTotal Utilities2,807.12VOIDWebsite domain fees0.002,641.04Total ExpenseNet Ordinary IncomeOther Income/ExpenseOther Incomeloose decks sales at SFGSTotal Other IncomeNet Other IncomeNet 52408.52-37,683.57Page 2
Retail Store with Two LocationsCan be created w. "Classes" in QBStore 1Apr 2015Store 2% of IncomeApr 2015TOTAL% of IncomeApr 2015% of 100.0%Total %6,800.0052.31%8,590.0059.49%15,390.0056.09%Total ss leaning service25.000.19%75.000.52%100.000.36%Dues & ment & 002.31%600.004.16%900.003.28%Office & Store 2.08%450.001.64%Travel Expense200.001.54%400.002.77%600.002.19%Total Net t of Goods SoldExpensePayroll Expenses
QRS Construction CompanyJan - Dec 2016Jan - Dec 2017IncomeConstruction IncomeReimbursement IncomeTotal Income164,681447,5378352,120165,516100%449,657Cost of Goods SoldCost of Goods ,0306,7416,845138125Insurance8,84420,125Interest Expense4,4841,996Payroll ools and Machinery1,4582,821Utilities2,7722,269Total 2112,999Job ExpensesTotal COGSGross ProfitExpenseAutomobileBank Service ChargesProfessional FeesNet Ordinary IncomeOther IncomeNet IncomeANALYSISChange in Sales (YR2 - YR1) / YR1Change in GP (YR2 - YR1) / YR1Change in Net Profit (YR2 - YR1) / YR1COGS as % of sales trendProfit trendGrowth trendAbility to repay debtOwner's Draw45,00045,000Taxes15,00025,000Net Cash for DS: Net Profit -Taxes- Draw9,25642,999New Annual Debt Service18,00018,000DS Coverage Net Cash / DS100%
2/27/2020 4 What is a Profit & Loss Statement The Profit and Loss Statement measures revenues and expenses over a defined period of time (month, quarter, year) Measures profitability: Whether the business is making a profit on what it sells Insights from the P&L can help with reducing expenses, growing revenue, and increasing profit.