Transcription
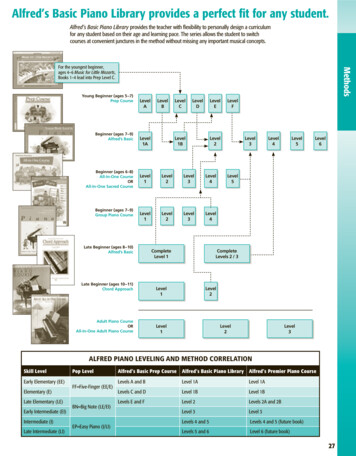
Item 9b, Attachment 2, Page 1 of 9CalPERS Trust Level ReviewRisk Management SummaryPeriod Ending December 31, 2019Investment Belief 9: Risk to CalPERS is multi-faceted and not fully captured through measures such as volatility or tracking error.CalPERS shall develop a broad set of investment and actuarial risk measures and clear processes for managing risk. The path of returnsmatters, because highly volatile returns can have unexpected impacts on contribution rates and funding status.Portfolio Volatility Contribution(%)Total Fund Forecast Volatility Trends (%)TotalBenchmarkTracking ErrorAllocationSelectionPolicy Limitn/an/a 1.5 0.75n/aCurrent12/31/20199.79.40.90.00.8Last Qtr19/30/20199.59.50.90.10.8Private Equity11.5%Public Equity FactorWeighted17.7%Last Year112/31/20189.99.90.90.00.9Income - LongSpread 3.1%Income - LongTreasury -0.1%Income - HighYield 0.9%Public Equity Cap Weighted55.8%Real Assets10.7%Trust Level0.5%Liquidity 0.0%Comments:Forecast Total Volatility of the PERF decreased by 26 bps over the last year. This decrease is primarily a reflection ofrecent low market volatility.Rapid shifts in volatility regime can occur and would not be predicted by this model. The best interpretation of thisestimate is as an indicator of the plan’s volatility given the current market environment.The pie chart above gives a visual representation of portfolio volatility contribution by asset classes (in percent).Market Value( millions)Asset ClassPublic EquityCap WeightedFactor WeightedPrivate EquityIncomeLong SpreadLong TreasuryHigh YieldReal AssetsLiquidityTrust Level2TOTAL FUND 043,5133,8822,070394,844Total Forecast Volatility(%)% Contribution toTotal VolatilityTracking Error .80.30.30.40.32.30.16.10.91PERF Risk model changed to a longer horizon model (from Barra 301L to 301XL). 12/31/2018 and 9/30/2019 risk values have been restated.2Trust Level includes Multi Asset Class, Absolute Return Strategies, and other Total Fund level portfolios.Source: BarraOne, SSB, CalPERSCalPERS Trust Level Appendix
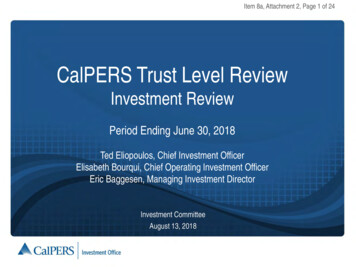
Item 9b, Attachment 2, Page 2 of 9RISK MANAGEMENT TIME SERIES1 Year Forecast Tracking Error1 Year Forecast Total Volatility4.025.03.53.0% Tracking Error% Total l Volatility (BIM 301L)Total Volatility (BIM 301XL)*Policy Volatility (BIM301L)Policy Volatility (BIM301XL)*Total Fund Tracking Error (BIM 301L)Total Fund Tracking Error (BIM 301XL)*Policy Limit (150 bps)Total Volatility and Tracking Error: Forecast vs. Realized Volatility25Total Volatility %20151050Realized Total Volatility One Year TrailingForecast Total Volatility One Year Prior (BIM 301L)Forecast Total Volatility One Year Prior (BIM 301XL)*Realized Tracking Error One Year TrailingForecast Tracking Error One Year Prior (BIM 301L)Forecast Tracking Error One Year Prior (BIM 301 XL)**PERF Risk model changed to a longer horizon model (from Barra 301L to 301XL). Risk values from 7/31/19 onward are reported under 301XL.The bottom chart plots the Forecast Total Volatility and Tracking Error for the Total Fund one year prior to each date vs.the Total Volatility and Tracking Error realized for that date. The graph highlights potential deviations between riskmodel estimates and subsequent realized volatility, due to the lagged and smoothed nature of risk models. In particular,modeled volatility forecasts tend to lag changes in regimes, for example the rapid increase in volatility during the periodof the global financial crisis, and similarly the persistent decline in market volatility in the last few years.Source: BarraOne, SSB, CalPERSCalPERS Trust Level Appendix
Item 9b, Attachment 2, Page 3 of 9STRESS TESTINGHistorical scenarios highlight the sensitivity of the portfolio to past economic regimes or specific events. Thescenarios can be used as a "what if" gauge of current portfolio positioning to understand the potential impactif a similar event or regime were to repeat.Portfolio ReturnPolicy BenchmarkReturnExcess Return2016 Brexit (Jun 2016)-3.2%-3.0%-0.1%2010 Peripheral European Bond Crisis (Mar 2010 - May 2010)-4.8%-4.7%-0.1%1973 - 1974 Oil Crisis (Oct 1973 - Mar 1974)-4.8%-4.8%0.0%2001 Sept 11 (Sep 2001)-7.4%-7.3%-0.1%2011 US Debt Ceiling Act (May 2011 - Sep 2011)-7.5%-7.2%-0.3%1998 Russian Financial Crisis (Jul 1998 - Oct 1998)-7.8%-7.5%-0.3%1987 Market Crash (Aug 1987 to Nov 1987)-9.4%-9.2%-0.2%2007 - 2008 Equity Slow Grind (Sep 2007 - Aug 2008)-10.2%-10.1%-0.1%2000 - 2003 Tech Crash & Recession (Jan 2000 - Mar 2003)-23.0%-22.7%-0.3%2008 - 2009 Global Financial Crisis (Sep 2008 - Mar 2009)-27.9%-27.7%-0.2%ScenarioSource: BarraOne, CalPERSCalPERS Trust Level Appendix
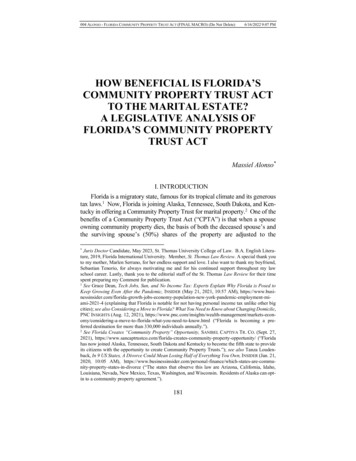
Item 9b, Attachment 2, Page 4 of 9LIQUIDITYLiquidity Analysis: Total PlanLiquidity/CashIncome - Long TreasuryPublic Equity - Cap WeightedPublic Equity - Factor WeightedIncome - Long SpreadIncome - High YieldReal AssetsPrivate Equity0%Less LiquidMore LiquidTotal Plan10%20%30%40%50%60%70%80%90%100%Percent Monetization1 Week1 Month1 Quarter1 YearYear Transactional liquidity is estimated for each asset class/strategy based on the current market environmentSource: SSB, CalPERSwhile also accounting for legal structures or other factors that may impact liquidity.Stress (Current ntingentPrivate Asset FundingPension .510104.5UsesTier 1 30 Day Liquidity Coverage Ratio 4.2x Billions BillionsTier 1 30 Day Liquidity Coverage Ratio 4.7xHistorical 0SourcesLiquidity on DemandInternal FundingPension Contribution & Other InflowsCash Equivalents¹ Stress (Current Regime) - Regime-dependent scenario to capture a "worst contemplated" outcome across liquidity uses and sourcesgiven current market conditions.² Historical Worst - Historical experience for the 30 day period: 9/28/08-10/27/08 (the worst equity drawdown in the past 20 years)applied to current portfolio.Liquidity Coverage is computed from estimates of future cash inflows and outflows. In this table, the 1month forward period is shown with Liquidity Coverage ratios for a stres scenario and for a historical worstexperience. The Liquidity Coverage ratios could be interpreted as how many times available cash / cashequivalents could cover projected cash needs over a 1-month forward period. A ratio of less than oneimplies the Fund could be forced to sell assets to meet liquidity needs in the given scenario.Source: BarraOne, SSB, CalPERSCalPERS Trust Level Appendix
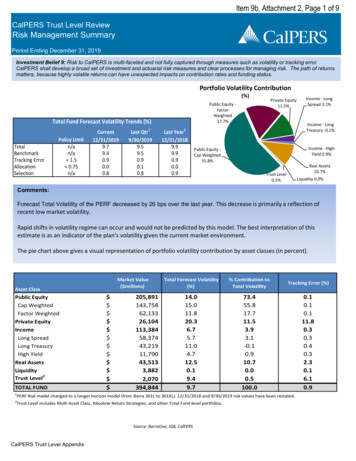
Item 9b, Attachment 2, Page 5 of 9LEVERAGETotal Fund Leverage Reportas of 12/31/19Leverage changes a portfolio's risk profile through both impact on liquidity and amplification of returns volatility. As a metric,leverage has the benefit of being relatively straightforward to calculate, making it a good backstop to more nuanced butcomplex perspectives on risk that could suffer from model errors or flawed assumptions. However, since the leverage metricimplicitly treats all assets as equally risky, and because it does not capture the interrelationships between assets(diversification), leverage should always be viewed in conjunction with other perspectives. For example, a low leverageportfolio could easily be more risky than a better-diversified moderate leverage portfolio.Portfolio View of Plan Leverage:Total portfolio leverage as defined in the Total Fund Investment Policy.Company Embedded Leverage:Some Fund assets embed leverage by their nature (i.e., private and public companies). In this case, leverage is not aportfolio management decision, but does contribute to the assets’ inherent riskiness.Unfunded Commitments:Represent potential draws on Fund liquidity, but are contingent in nature.Portfolio View of Plan LeverageAsset Class/ ProgramNet AssetValue ( Billions)Sources of LeverageDerivativesPublic Equity - Cap WeightedRecourse Debtincluding Repos1-Cash2BenchmarkGross AssetGrossAssetExposure overExposure %Asset - Exposure % ofNAVBenchmark3Exposureof NAVNon RecourseDebt143.83.33.9143.236.3%35.0%Public Equity - Factor Weighted62.10.50.462.215.8%15.0%0.8%Private Equity26.10.027.87.1%8.0%-0.9%Income - Long Spread58.40.00.557.914.7%15.0%-0.3%Income - Long Treasury43.213.61.957.014.4%10.0%4.4%Income - High Yield11.80.011.83.0%3.0%0.0%Real uidity3.93.90.0Trust Level2.10.11.93.30.0 14.7 424.5Securities LendingTotal Fund60.0394.83.3 17.4 1.7 19.8Embedded Leverage in Asset Classes0.5%1.3%0.5%107.5%102.6%4.9%Unfunded CommitmentsImpliedNet MarketValue( B)Leverage7Public Equity1.56Private Equity2.22Real Estate1.28Private EquityReal Assets26.143.5UnfundedCommitments8( B)18.610.8% ofTotal Fund4.7%2.7%1. FX Forwards used for hedging and fixed income duration shifting are not counted as leverage. Options are included based on delta adjusted notional value.2. Cash is defined as assets meeting Liquidity program guidelines.3. Asset class contribution to total plan leverage includes program-level leverage and the difference between actual and target SAA allocation adjusted for benchmark leverage.4. Subscription financing and other liabilities at the fund level (as of 6/30/2019) are shown as recourse, while defined non-recourse for policy definition.5. As of 9/30/19 there is no Recourse Debt in Real Estate. There has been no change from the last reported date of 3/31/19.6. Securities lending includes only securities lent for cash collateral (which creates a source of financing).7. Implied leverage is estimated from either asset class benchmark data or industry research. It represents the Enterprise Value to Equity ratio.8. Unfunded commitments are as of 12/31/2019 for Private Equity and 9/30/2019 for Real Assets. 77% of Real Asset unfunded commitments are revocable atCalPERS' discretion.Source: BarraOne, SSB, Factset, CalPERSCalPERS Trust Level Appendix
Item 9b, Attachment 2, Page 6 of 9CONCENTRATION REPORTTop 20 Global Issuer ExposureFEDERAL NATIONALMORTGAGE ASSN, 3.1%APPLE INC, 0.9%AMAZON.COM INC, 0.5%ALPHABET INC, 0.5%MICROSOFT CORP, 0.8%JOHNSON & JOHNSON,0.4%JPMORGAN CHASE & CO,0.4%FEDERAL HOME LOANMORTGAGE CORP, 3.4%COCA-COLA CO, 0.4%PEPSICO INC, 0.4%VERIZONCOMMUNICATIONS INC,0.3%Rest of PERF, 79%AT&T INC, 0.3%TOP 20ISSUERS,21%VISA INC, 0.3%NESTLE SA, 0.3%GOVERNMENT NATIONALMORTGAGE ASSOCIATION,0.3%UNITED STATES TREASURY,7.2%PROCTER & GAMBLE CO,0.3%FACEBOOK INC, 0.3%BERKSHIRE HATHAWAYINC, 0.3%NY OFFICE PROPERTY, 0.3%Top 10 Industry Exposure6%5%Weight %4%3%2%1%0%BanksThrifts &MortgageFinanceEquity RealEstateInvestmentTrusts (REITs)InsuranceWeight (%)5.5%5.4%3.6%3.3%3.3%Bmk Weight (%)5.0%5.1%2.6%3.3%3.4%CalPERS Trust Level AppendixIT ServicesSoftwareElectricUtilitiesSemiconductors &Semiconductor il Gas &PharmaceuticConsumablealsFuelsSource: BarraOne, CalPERS
Item 9b, Attachment 2, Page 7 of 9CONCENTRATION REPORT80%Regional ExposuresCountry70%PERF Weight(%)Policy BmkWeight (%)Active Weight(%)United d -0.1%Weight %60%30%20%10%0%North America EMEA (Europe,Middle East,Africa)PERF Weight (%)Asia PacificLatin-S America Rest of WorldPolicy Bmk Weight (%)US Dollar WeightsPERF: 72.7%Policy Benchmark: 73.3%CalPERS Trust Level AppendixSource: BarraOne, CalPERS
Item 9b, Attachment 2, Page 8 of 9COUNTERPARTY RISKCDS spreads and othermetrics are regularlymonitored for individualCalPERS counterparties. Inaddition, when aggregatespreads rise above 100 bpsadditional oversightmeasures are taken.NET MTMFORWARDS( )CounterpartyAustralia and New Zealand BankingBank of MontrealBank of AmericaBNP ParibasBarclaysCommonWealth Bank of AustraliaCitigroupCanadian Imperial Bank of CommerceCredit Suisse InternationalDeutsche BankGoldman Sachs Intl.HSBCMorgan Stanley Capital ServiceRBC Capital MarketsStandard Chartered BankSociete GeneraleState StreetToronto DominionUBS AGGWestPac BankGrand 037(186,112)(1,830,199)545,76163,488,259Net MTMOPTIONS( )Net MTMSWAPS( 1138,968,622CalPERSExposure( ,699545,761233,830,688Counter PartyExposure( t MTM Total( )CollateralPosted( )*19,21431,5078,323,883(8,329,604)(3,641,154) 61) 4(3,270,000)50,641,443 (50,671,000)35,061,138 ,289 000)102,456,881 (102,538,677)Net Credit NetExposure( )(8,861)(7,133)3,888(12,688)(104,239)(81,796)*As of 12/31 Counterparties posted 130mm to CalPERS which includes Internal Collateral#Internal Threshold LimitAbove: Total market value exposure and net credit exposures are monitored for all of our OTC (over-the-counter)positions.Source: Blackrock, CalPERSBelow: FCM (Futures Commission Merchant) exposures are monitored for how much margin we have posted withour FCM. Source: CalPERSFUTURES COMMISSION MERCHANT EXPOSUREFutures Commission MerchantCollateral Posted*CITIGROUP GLOBAL MARKETS INC341,774,464MERRILL LYNCH PIERCE FENNER & SMITH INCORPORATED25,196,758*As of December 31, 2019CalPERS Trust Level Appendix
Item 9b, Attachment 2, Page 9 of 9Appendix1. How to interpret the OTC Counterparty Risk Exposure sectionOTC Derivative Counterparty Exposure ReportCounterpartyCounterparty 123NET MTMFORWARDS( )Net MTMOPTIONS( )Net MTMSWAPS( )CalPERSExposure( )Counter PartyExposure( )Net MTM Total( )Collateral Posted( )Net Credit NetExposure( 00NET MTM BY PRODUCT TYPE Columns reflect the net mark to market(MTM) of all OTC trades by product typewith a Counterparty amount CalPERS has a gain on thepositions - amount CalPERS has a loss on thepositionsDirectional Exposure The exposure columns reflect an un-netprofit or loss (P&L) grouping across producttype and is equivalent to the directionalunwind exposure at a point in time Trades with positive P&L are bucketedtogether CalPERS Exposure Trades with negative P&L are bucketedtogether Counterparty ExposureNET MTM TOTAL The net market to market column reflectsthe total current net profit or loss positionacross all open OTC trades with aCounterparty amount CalPERS is owed money - amount CalPERS owes moneyCalPERS Trust Level AppendixNET CREDIT EXPOSURE The net credit exposure columnreflects the open uncollateralizedcredit exposure risk if aCounterparty were to defaultwith no change in mark to marketprices amounts reflect open credit riskwhere CalPERS is owed moneyCOLLATERAL POSTED The collateral posted column reflects thedollar amount of collateral that is eitherposted to CalPERS or that CalPERS hasposted to a Counterparty to offset credit risk amount CalPERS has posted money out - amount Counterparty has posted moneyto CalPERS
PERF Risk model changed to a longer horizon model (from Barra 301L to 301XL). 12/31/2018 and 9/30/2019 risk values have been restated. 2. Trust Level includes Multi Asset Class, Absolute Return Strategies, and other Total Fund level portfolios. Comments: Forecast Total Volatility of the PERF decreased by 26 bps over the last year.