Transcription
F1F9 eBooksA PRACTICAL GUIDE TOOPEXMODELLINGIN OIL & GASWWW.F1F9.COM
IS THIS BOOKRIGHT FOR ME?NOT SURE IF THIS EBOOK IS QUITE RIGHT FOR YOU?SEE IF WHAT YOU ARE ABOUT TO READ MATCHES YOUR REQUIREMENTSFAST FINANCIAL MODELLINGFUseful, practical information about FAST financial modelling, managingmodelling projects and good modelling practice.BAPFTargeted at, but not exclusive to, banking and advisory practice areas,exploring modelling topics like credit analysis, debt structuring etc.PROJECT FINANCEFocussing on the kind of transactional modelling typically associated withthe development of infrastructure, PFI and PPP projects.ENTERPRISE REPORTING & ANALYSISETHISGUIDEBANKING & ADVISORYUseful information and practical guidance on the apllication of modellingdiscipline and standards to improve business decision making.ENENERGY & NATURAL RESOURCESInsight and practical guidance on the aplication of good modelling practicespecifically related to these often complicated business areas.FFAST FINANCIALMODELLINGBA BANKING& ADVISORYEENTERPRISEREPORTING & ANALYSIS&EN ENERGYNATURAL RESOURCESPF PROJECTFINANCE
WWW.F1F9.COMContents2IS THIS BOOK RIGHT FOR ME?6INTRODUCTION7UNDERSTANDING HOW TO MODEL OPEX10MODELLING OPEX IN OIL & GAS11DIRECT PRODUCTION COSTS13TIME DEPENDENT COSTS15FIXED CHARGES17ASSET OVERHEAD COSTS19GENERAL EXPENSES21OPEX MODELLING CHECKLIST24OPEX CASE STUDIES30COURSES & RESOURCES3
4WWW.F1F9.COMWHICH IS MORE IMPORTANT ?CAPEXSHARE THIS eBOOKOPEX
ENABOUT F1F9F1F9 provides financial modelling and business forecasting support to bluechip clients and medium-sized corporates. We also teach financial modellingskills to companies around the world. Our clients have access to high quality,low-cost modelling support delivered by over 40 professional modellers.F1F9 co-developed the FAST Standard that allows modellers and non-modellersto work together and understand financial models. Transparency is the corevalue that drives our modelling and our business activities.F1F9 ENERGY & NATURAL RESOURCES TEAMF1F9’s dedicated Energy & Natural Resources modelling team is led by DanielPrinsloo. Daniel has more than 20 years of Energy & Natural Resourcesexperience. With a strong technical background in chemical and processengineering and a further qualification in computer science, Daniel has workedin a number of major commercial functions and gained extensive experiencein strategy development, project evaluation, business development andcommercial agreements.Daniel’s commercial negotiation and valuation experience covers Algeria,Australia, China, Iran, Latvia, Lithuania, Malaysia, Netherlands, Nigeria, Qatar,Russia, South Africa, Tanzania and the United Kingdom. He has a proven abilityin the development of multibillion dollar energy investment opportunities andproviding the financial models used to support these investments while ensuringhigh standards of quality control are maintained.DANIEL PRINSLOODIRECTOR, ENERGY & NATURAL RESOURCESSHARE THIS eBOOK
WWW.F1F9.COMINTRODUCTIONAsk a modeller in the oil and gas industry about costs and chancesare they will think that capital expenditure (“capex”) is way moreimportant than operating expenditure (“opex”). Yet over the life of theproject, opex is often a much larger number than capex. In addition,it can be difficult to model.This guide will help you understand the types of opex that you arelikely to encounter in oil and gas projects. It will provide you withworked examples. It will help you understand why opex is importantand prompt you to ask questions when you are modelling.SHARE THIS eBOOK6
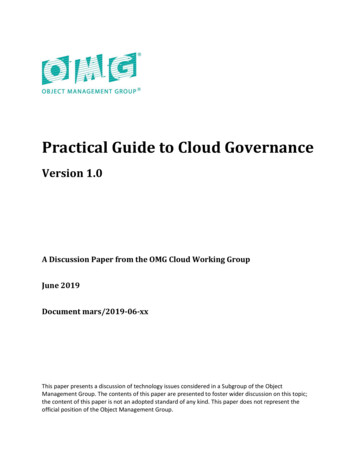
7WWW.F1F9.COMUNDERSTANDING HOWTO MODEL OPEXOil and gas assets take inputs and turn them into products that earnrevenue. Opex is incurred throughout the life of the asset and is significant.Opex is not always charged or paid for on a uniform basis. This can lead tocomplexity in modelling.Figure 1 is a picture of the revenue generation process arising from the capexand opex investment in an oil and gas asset.CAPEXNote: Engineers may not all use thesame definitions and can use differentdefinitions to mean the same thing.E.g. Direct Production Cost iscommonly referred to as VariableProduction Cost. REVENUESO&G ASSETINPUTSVARIABLEREPAIRS & MAINTENANCEFIXEDOVERHEADSPRODUCTSOPERATING COSTS* GENERALEXPENSESOPEX* Sometimes referred to as manufacturing costs.Figure 1: Simplified schematic of revenue generationOperating Costs Direct Production Costs Fixed Charges Asset Overhead CostsTotal Opex (or Total Production Cost) Operating Costs General ExpensesApplications of opex modellingOpex will have a material impact on the potential profitability of a project –and therefore its dividend policy. So opex modelling is key to identifying anoptimal solution from a number of possibilities.Sensitivity analysis on opex will be required to support decision making.Opex modelling will be required to assess the parameters over which theproject can operate and still be sustainable.SHARE THIS eBOOK
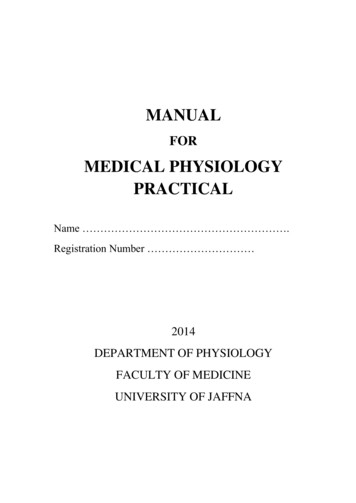
8WWW.F1F9.COMHow and when is opexestimated?As economic and financial modelling is crucial at each phase of projectdevelopment (Figure 2), a key objective of the modeller is to represent thetiming of expenditure as the project develops and data changes.The level of detail in forecast opex increases as the development phasematures. Models will need to accommodate increasing granularity of data.The advantage of a model built to the FAST Standard is that it is simple toadd extra levels of detail whilst maintaining the model’s robust structure.IDENTIFYSELECTphase 11phase 22prefeasibilityDEFINEphase 3phase 43feasibilityEXECUTE4OPERATEphase 55phase 66ProjectCOMMISSIONINGExECUTION (EPC)fEEDevaluation &operationFID POINTIdentify &Assess lopalternatives& select bestalternativedevelop &optimisepreferredalternativeexecute plaNstart upmonitor tsidentify valueaddingopportunitiesFigure 2: Phased development of an oil and gas industry project‘Top-down’ opex estimatesDuring the pre-feasibility and feasibility stages, it is common for engineers toapply a top-down approach to appraising opex. Non-deterministic methodsare usual at this stage and forecasts are often made on a real basis (i.e.excluding inflation).The initial estimate may simply be a single value of total annual expenditure.This may, for example, have been derived from the capex estimate, or bebased on similar projects or a ‘rule of thumb’.During the feasibility stage engineers will create process flow diagrams. Thiswill allow a more detailed opex estimate by enabling estimates to be brokendown by cost category.A licensed commercial tool (such as QUE TOR) will often be used toestimate costs.SHARE THIS eBOOK
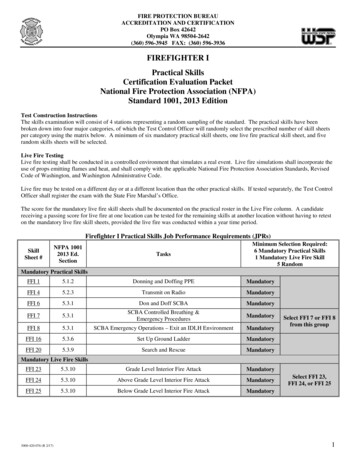
9WWW.F1F9.COM‘Bottom-up’ opex estimateAs the preferred project becomes more clearly defined, greater detailemerges around the operation of the asset. Engineers and design teams: Produce heat and mass balances; Size and generate equipment lists; Optimise inputs and outputs, and Develop philosophy documents such as redundancy and sparing,operating and maintenance, etc.Given the increased detail now available, it is possible to change theapproach to opex estimation: We can start to use deterministic methods; Estimates can be created on a nominal basis; We can estimate individual items of variable and fixed costs withhigher levels of confidence and accuracy.This allows a detailed bottom-up estimate of opex to be generated. This willhave a greater level of detail of the different types, breakdown and categoriesof expenditure.The form in which data will be provided varies according to the type ofcosts. Examples of the different types of basis include annual, per unit ofproduction, per day of operation, and per event or cycle.Annualisation of opexEven during this more detailed ‘bottom-up’ stage, some costs may still beannualised. Annualisation of opex has advantages, chiefly in the early stagesof project development. These include: Seasonal variations are evened out; Onstream factors are considered; Infrequently occurring large expenses are factored in (such asscheduled maintenance shutdowns); Annual basis can be readily converted to other bases;However, annualisation does not represent the reality of cash flow. A typicalmistake, post-feasibility, can be to try to continue to analyse groups of costsinto a single annual figure.Figure 3 shows, in general terms, the timing and the difference betweentop-down and bottom-up estimates.IDENTIFYSELECTTOP-dOWN Initially single figure Later breakdown by category Split out of main items Non-deterministic Real basisDEFINEEXECUTEBOTTOM-UP Breakdown by category & item Different bases for different items Scenarios Deterministic Nominal basisFigure 3: ‘Top-down’ versus ‘Bottom-up’OPERATE
MODELLING OPEX INOIL & GASIn the pages that follow we set out a categorisation of opex. We havealso provided two industry case study examples, with worked solutionsin Excel, containing some of the different types and nature of opexthat you will typically model in oil and gas projects.The categorisation of costs presented is not hard and rigid, andthe division between costs can be somewhat arbitrary and can bedependent upon the interpretation of variable, fixed and overheadcosts. Certain items of expenditure can be classified without question,but the classification of other items can depend on further factors –even the accounting practice of an organisation.It is important that modellers check and clarify assumptions. Makesure that you are clear on the assumptions and the basis for all itemsof opex, and the dependencies and timing of costs.Direct costs are associated with running the asset. Indirect costs areassociated with running the business.SHARE THIS eBOOK
DirectproductioncostsSHARE THIS eBOOK
12WWW.F1F9.COMDirect productioncostsOverviewExamplesIssues to look out forDirect production costs are associated with the level of production.Production volume is a key driver in calculating direct production costs. Feedstock / raw materials Operating labour Operating supervision Power / utilities / services Operating supplies Maintenance and repairs Laboratory charges Royalties / patents / licences Catalysts / chemicals / solventsCommonly referred to as Variable Production Costs – it should be recognisedthat some items of direct costs will have elements of fixed costs in them(not to be confused with fixed charges): for instance, maintenance and repaircosts decrease with reduced production level, but some maintenance andrepair costs still occur when the plant is unavailable.Cost may be directly proportional to production or may benefit fromeconomies of scale.Direct production costs are much less straightforward to model than fixedcharges, asset overhead costs and general expenses: different items withinone individual direct costs element can be dependent on multiple bases—thisis demonstrated in Examples 1 and 2.SHARE THIS eBOOK
TimedependentcostsSHARE THIS eBOOK
14WWW.F1F9.COMTime dependentcostsOverviewExamplesIssues to look out forThere are items of operating costs that are triggered by a timing assumptionrather than being driven directly by the level of throughput or production. Major shutdowns for maintenance and repair Catalyst change-out / replacement Operating supplies / spares replacement Equipment inspection / overhaul Routine maintenance (e.g. painting)Is the cost cyclical with a set pattern (as may be the case with majorshutdown)? Or is the item of cost driven by time elapsed or total numberof hours of operation, etc. (as may be the case for maintenance of items ofequipment)?Do distinct periods or durations occur that have to be flagged and modelledseparately?Check whether engineers have used published values for mean time toequipment failure, for individual equipment costs.Example 2 in this ebook demonstrates solutions for modelling timedependent costs.SHARE THIS eBOOK
FIXEDCHARGESSHARE THIS eBOOK
16WWW.F1F9.COMFIXED CHARGESOverviewExamplesIssues to look out forFixed charges are incurred regardless of the level of production. Depreciation Local taxes (property) Asset insurance Rent Financing (interest) Lump sum royalties, etc.Depreciation, property taxes and insurance are costs related to the capitalinvestment in the project / asset.Interest may be included as a fixed charge but because of its importance maybe treated separately.Engineers concentrate on direct production costs and may not provide anyestimates of these charges. Where estimates have been made, they mayhave been made using arbitrary factors, taken from published sources orobtained from a commercial package.SHARE THIS eBOOK
AssetoverheadcostsSHARE THIS eBOOK
18WWW.F1F9.COMAsset overheadcostsOverviewExamplesIssues to look out forSHARE THIS eBOOKThese are expenses incurred to allow the asset to function as an efficientunit. The nature of these costs is similar to fixed charges in that they do notvary widely with change in production. HSE and protection Medical General plant overhead Payroll overhead Recreation Restaurant, etc Salvage Control laboratories Plant superintendence Storage facilitiesMay be categorised as indirect costs or indirect production costs. Initialestimates likely to be factored as a percentage of the direct production costs.
GENERALEXPENSESSHARE THIS eBOOK
20WWW.F1F9.COMGeneral expensesOverviewGeneral expenses relate to the operations of the company. There are threemain categories of general expenses: administrative, sales and marketing,and research and development.Examples Administrative expenses Executive salaries Clerical wages Central engineering and technical Legal costs Office maintenance Communications Sales and marketing Sales office Personnel expenses Shipping Research and developmentIssues to look out forHow have the elements been estimated? Be clear what the dependencies ofdifferent elements are.Check which categories of general expenses should be included and whichare not relevant – e.g. is an allowance required for R&D?SHARE THIS eBOOK
21WWW.F1F9.COMOPEX MODELLINGCHECKLISTDefinitions and basisof assumptionsCheck the definitions used by the engineers – do you really understand them?Clarify anything that is not clear or has not been explicitly specified.Helpful Modelling Guide: Using PlaceholdersTiming and datesConfirm the timing of each item of opex.Check the base date and base index for to be used for each item.Cost driversIf a cost is variable, what drives it? Does it vary with production, an input,time, or another metric?If a cost is fixed, is it time dependent, cyclic, etc.? Is it linked to anotherevent such as a shutdown?Overlooked ormissing itemsThe largest source of error in opex estimation can come from overlookingone or more elements of cost. If you cannot identify an element of cost —check it, as it might have been omitted or lumped with other items.Have engineers used a proforma, checklists, or other aids? If so, it canbe useful to obtain copies as these might help to identify missing costs, andhelp in checking definitions, etc.AnnualisationHave engineers annualised any major cyclic cost items?If so, obtain details and check whether the timing of the actual cashflow willhave an impact.SHARE THIS eBOOK
22WWW.F1F9.COMFeedstock / raw materialcostsFeedstock / materials costs are commonly the largest operating cost. Do youknow how feedstock prices have been obtained? Prices may be projected,have a dependency on commodities, or have been obtained from suppliers orfrom published data.Have you checked how the cost basis may change during the project?For example, the price of a gas feedstock may be fixed, subject to normalescalation, for the first five years of operations, but thereafter switch toanother basis such as a function of dated Brent crude oil price.Do raw material costs vary depending on quality delivered or qualityrequired?Are there any by-products or scrap costs to take into account? (Notethese can also sometimes represent an income line item.)Are there any quantity discounts?What other supplies, catalysts or chemicals should be considered as rawmaterials?Have fuels been categorised as raw materials or utilities?Catalysts & chemicalsCatalysts and chemicals, unlike raw materials, usually refer to those materialsthat are not directly consumed in making the final product but which arenecessary to carry out the process operations of the oil and gas asset.Check the basis of catalysts and chemicals usage – items may be consumed in proportion to feedstock throughput or production rate, but may bereplaced on a cyclic basis such as catalyst beds.Operating labourDo you know the basis and breakdown of the estimate?In preliminary cost analyses, the quantity of operating labour can often beestimated from company experience of similar projects or assets, or frompublished information.Do you know what the relationship is between labour requirements andproduction rate? It is unusual to be linear and a power factor is common.Is operating labour divided into skilled and unskilled labour? Dosub-classes of labour apply?As more detailed engineering takes place, has account been taken of thetypes of worker required, geographic location of the asset, prevailingwage rates, and worker productivity factors?SHARE THIS eBOOK
23WWW.F1F9.COMOperating supervisionHow has this item been derived? Has it been factored from the OperatingLabour, as typically is the case in the feasibility stages?Supervision may remain fixed in the event of reduced capacity of the asset.UtilitiesThe cost for utilities vary widely depending on the amount of each utilityneeded, asset location, and source.Make sure you determine and understand how the estimate has beenderived by engineers (since this will change during the project).A utility may be purchased at a predetermined rate from an outside source,or may be a service with the company. If the latter, is it a shared service?Maintenance & repairsAnnual costs for maintenance and repairs can vary from as low as 1-2% ofcapex for a simple process to up to around 20% as complexity, corrosiveconditions etc. increase.Does a split between labour and materials exist? Initial estimates mayassume a 50:50 split.Maintenance varies with rate of operation but not in a linear fashion. Havecosts as a percentage of 100% of capacity been estimated by engineers?Maintenance costs tend to increase with equipment or asset age.Check whether average values have been used or whether there is anelement of time in costs.Capex vsroutine expense?SHARE THIS eBOOKConfirm what is being categorised as capex vs routine expense.(As a rule: if the expenditure increases the value of the asset, it is capex; whileif it simply keeps the asset in working condition, it is a routine expense.)
24WWW.F1F9.COMOPEXCASE STUDIESCASE STUDYWORKING FILESDownload and review the worked example Excel filesThe worked examples have been built to the FAST Modelling Standard.SHARE THIS eBOOK
25WWW.F1F9.COMUSEFUL INFORMATION2D calculation blocksThe worked example files have been prepared according tothe FAST Standard. In particular, a structure has been used thatis known as a “2D calculation block”.If you are not familiar with this structure you should check out this guide from theFinancial Modelling Handbook.2D calculationblocksfinancialmodellinghandbook.comThe following might also be useful if you are new to FAST:calculationblocksCalculation BlocksFASTFINANCIALMODEL DESIGNFAST Model Design31 Day Modelling Course
26WWW.F1F9.COMOPEX CASE STUDYEXAMPLESIn Example 1, you are faced with modellinga variable opex cost element, ‘Catalysts andChemicals’, which also features two cyclical costcomponents, the period of each cyclical costcomponent being different.Example 2 features the requirement to modelmaintenance costs that consist of a mix of directproduction costs, having both a fixed and variableelement, with individual components that vary withtime period, vary with cycle, have a dependency onan event, are of different duration and / or changeincrementally.Example 1:Floating LiquefactionProjectYour company is assessing an opportunity to monetise a stranded offshoregas resource by investing in a Floating LNG (‘FLNG’) project to process wellfluids and produce liquefied natural gas (LNG) for export plus by-productliquids (condensate and LPG). The project is at the stage of selecting the bestalternative and a decision to commit to a front-end engineering design studyis under contemplation.Initially, you had been provided with a single, annualised opex value that youapplied in your model, subject to the appropriate escalation.Following further engineering, estimates have been made for the fixed andvariable components of opex. One item of the variable costs is Catalystsand Chemicals which is currently estimated as a cost per unit of flowrate ofwell fluids into the FLNG vessel: the cost being ‘guesstimated’ by processengineers based on ‘rules of thumb’ for onshore plants. Consequently, thefinancial model has a single input for Catalysts and Chemicals.The senior process engineer has been assessing different options for thedesign, for the topsides equipment of the FLNG, to process and treat wellfluids (including acid gas removal, dehydration and mercury removal) priorto liquefaction. Annual quantities of consumable chemicals have beenestimated for the base-case design scenario (at the current status of projectdevelopment, quantities are not yet available as a function of production).Mol sieve and mercury removal beds are not consumables but are replacedat fixed cycles of 3 years and 7 years, respectively.SHARE THIS eBOOK
27WWW.F1F9.COMExample 1:You have been asked to model the annual cost of Catalysts and Chemicalsfor a 25 year operational life of the base-case FLNG project based on theinformation provided in Table 1 and, for simplicity, assuming a start date of1st January 2014. Mol sieve and Hg removal bed costs are not to be modelledas averaged annualised values, and the cost of the first cycle of each is tobe included in Year 1 of operations. There is no need, at the present level ofdetail, to structure the model to deal with partial periods. Costs are assumedto escalate at 2.5% per annum.QuantityDurationCostAmine1,000m3Per annum 10.0/litreMono-ethylene glycol3,800m3Per annum Per annumPer annumPer annum 4.0/litre 4.2/litre 3.8/litrePer annum 60,000Misc. chemicals& lubricants, etc-Mol sieve320m3Replaced on a 3year cycle 4.4/litreHg removal bed50m3Replaced on a 7year cycle 24.0/litreTable 1: Catalysts & ChemicalsModelThe key to modelling the cyclical costs is to generate flags to represent theyear in which each item of cost is incurred. In the Excel file, Rows 116-122of the opex sheet of Example 1 demonstrates a solution for setting up therequired frequency flags for each of the different items constituting Catalystsand Chemicals.SHARE THIS eBOOK
28WWW.F1F9.COMExample 2:Onshore Oil & GasProcessing FacilityYour company is looking at a new prospect for an onshore facility. At thepre-FEED stage, the current version of the financial model has been basedon the overall capex being 3.6 billion with annual opex for the onshorefacility (excluding offshore) having been factored at 5% of overall capex, i.e. 180 million per year. Of the opex figure, engineers have to date, assumedmaintenance costs to be 20% of the total annual operating costs based onprevious experience, i.e. 36 million. Cost of maintenance, consequently, iscurrently modelled as the all-inclusive annual figure of 36 million includingmaintenance staff, outside contractors and materials, and includes allowancefor the costs of maintenance shutdowns.The Operating and Maintenance Philosophy is under development andincludes the requirement to ‘ use a minimum manpower and achieve anas low as practical life cycle cost .’. Maintenance requirements are dividedinto three areas: scheduled maintenance, routine maintenance and correctivemaintenance. There is planned to be a dedicated Maintenance Team.However, it is the philosophy that the project Shift Operators will berequired to undertake many of the maintenance tasks including routinemaintenance (and this cost is to be allocated under Operations rather thanMaintenance). Specialist contractors and contractor services are utilised formajor overhauls within the annual scheduled maintenance and during majormaintenance shutdowns.The engineering department is assessing the lifecycle costs of maintenancecovering the project’s permanent Maintenance Team and buying in ofspecialist contractor and contractor services to cover scheduled maintenance.You have been asked to provide additional granularity in the financial model forMaintenance costs, and to ensure that your model is flexible enough to copewith additional cost breakdown as it becomes available, based on the informationbelow. Instructions are to model maintenance costs for 25 years of continuousoperations, on an annual basis, from a start date of 1st January 2020 (all costs areprovided on a 2014 basis and the escalation factor to be used is 3.5%). Maintenance Team: 1 x Maintenance Manager, annual salary 200,000. 1 x Maintenance Planner, annual salary 80,000. 8 x Maintenance Engineers (all disciplines inc. supervisory), annual salary 130,000 per Engineer. 12 x Maintenance Technicians (all disciplines), annual salary 90,000 perTechnician. Major Maintenance Shutdown Costs: Cyclical – every 5 years. 60 million 1st major shutdown. 55 million 2nd major shutdown (building on lessons learnt from 1st shutdown). 50 million 3rd and subsequent major shutdown.SHARE THIS eBOOK
29WWW.F1F9.COMExample 2: Maintenance Materials and Spares: Includes items such as consumable materials, spares, specialistcontractors and contractor services, outside maintenance service andvendor services. 0-2 years: Equipment new and spares available from Owners cost. 4million per year. 3-5 years: Some equipment needs to be replaced / overhauled. 10 million per year. Year 6 onwards: All equipment needs maintenance. 14 million per year,increasing by 1 million year-on-year except for years when a majormaintenance shutdown is scheduled to occur (in which case no increaseon the previous year).ModelThe Opex sheet consists of: Inputs (Rows 7-47) Timing (Rows 50-171) Escalation (Rows 174-179) Operating Cost (Rows 182-262)A key part of the solution is the setting up of the timing flags for the differentelement of the Maintenance costs: Operational period flags and period of operations.Row 84 sets up the first operations flag.Row 88 sets up the last operations flag (for a 25 year period of operations). Maintenance shutdown period flag.Three flags are required to represent (i) the 1st, (ii) the 2nd and (iii) the 3rdand subsequent shutdowns.Rows 98-135 set up the relevant maintenance shutdown period flags. Maintenance equipment replacement flags.Flags are required to identify the three distinct durations so that thedifferent opex cost rules can be applied for each duration.Rows 137-171 set up the relevant maintenance equipment replacementflags covering each duration.It is necessary to apply an annual increase in the cost of maintenancematerials and spares for duration 3 (i.e. Year 6 ), provided a majormaintenance shutdown is not scheduled for that year. Rows 236-245 showhow the relevant duration 3 and major maintenance shutdown flags have beenused to apply the required increase in maintenance material and spares costs.SHARE THIS eBOOK
30WWW.F1F9.COMCHECK OUT OUR ADVANCED COURSEON FINANCIAL MODELLING IN OIL & GAS Public In-house“Great course, extremelyworthwhile, packed withvaluable insights and tips.”Stirling HabbittsVice President Structured FinanceING Commercial BankingA three day advanced course focusing on financialmodelling for the oil and gas industry.Build up your theoretical knowledge alongside practical modelling sessions:Gain a thorough understanding of how to structure your spreadsheet model to helpyour analysis processTuition from industry experts: Learn to model the key features of oil and gas projectsincluding the main parameters and termsA hands-on course based on real industry case studies: Speed up your decisionmaking process by building a financial model that meets the needs of your sectorEnhance your commercial knowledge along with your modelling skills: Learn thelanguage of project commercial decision making and how it relates to the spreadsheetmodelBenefit from using FAST techniques: Create robust oil and gas models that are built toan internationally-recognised standardSHARE THIS eBOOK
31WWW.F1F9.COMcheck out our other ebooks.10 PRINCIPLES OFAGILE FINANCIAL MODELLINGHOW TO STANDARDISE MODELLING:5 LESSONS LEARNED THE HARD WAYWHY FIXED PRICE CONTRACTSARE BAD FOR EVERYONES-CURVE (CAPEX) MODELLINGIN OIL & GASTHE DIRTY DOZEN:12 MODELLING HORROR STORIESOIL & GASMODELLING CHECKLISTTHE BUSINESSANALYSIS LIFECYCLEESSENTIALMODEL OPTIMISATIONCOPYRIGHTThis ebook is licensed under a Creative Commons Attribution-NoDerivs 3.0 Unported License.You areactively encouraged to copy, distribute and share this ebook provided that you provide proper attribution.
F1F9 eBooksF1F9 builds and maintains financial models usedby leading companies and advisors in the Oil andGas sector.We also train our clients to build better modelsthemselves through courses delivered worldwide.To find out more about how we help you increasethe efficiency of your modelling, and reduce modelling risk, call Lynn Martin on 44 203 239 8575or email lynn.martin@f1f9.com20-22 Bedford Row,London WC1R 4JS 44 20 3322 2722www.f1f9.com
Oil and gas assets take inputs and turn them into products that earn revenue. Opex is incurred throughout the life of the asset and is significant. Opex is not always charged or paid for on a uniform basis. This can lead to complexity in modelling. Figure 1 is a picture of the revenue generation process arising from the capex