Transcription
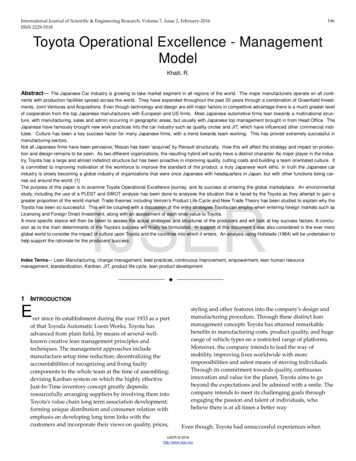
Presentation Materials for InvestorsJuly 2015
Disclaimer This presentation includes certain “forward-looking statements” within the meaning of The U.S.Private Securities Litigation Reform Act of 1995. These statements are based on current expectations and currently available information. Actual results may differ materially from these expectations due to certain risks, uncertainties andother important factors, including the risk factors set forth in the most recent annual and periodicreports of Toyota Motor Corporation and Toyota Motor Credit Corporation. We do not undertake to update the forward-looking statements to reflect actual results or changesin the factors affecting the forward-looking statements. This presentation does not constitute an offer to sell or a solicitation of an offer to purchase anysecurities. Any offer or sale of securities will be made only by means of a prospectus and relateddocumentation. Investors and others should note that we announce material financial information using the investorrelations section of our corporate website (http://www.toyotafinancial.com) and SEC filings. Weuse these channels, press releases, as well as social media to communicate with our investors,customers and the general public about our company, our services and other issues. While not all ofthe information that we post on social media is of a material nature, some information could bematerial. Therefore, we encourage investors, the media, and others interested in our company toreview the information we post on the Toyota Motor Credit Corporation Twitter Feed(http://www.twitter.com/toyotafinancial). We may update our social media channels from time totime on the investor relations section of our corporate website.2
Disclaimer This presentation includes certain “forward-looking statements” within the meaning of The U.S. Private Securities Litigation Reform Act of 1995. These statements are based on current expectations and currently available information. Actual results may differ materially from these expectations due to certain risks, uncertainties and other important factors, including the risk factors setforth in the most recent annual and periodic reports of Toyota Motor Corporation and Toyota Motor Credit Corporation. We do not undertake to update the forward-looking statements to reflect actual results or changes in the factors affecting the forward-lookingstatements. This presentation does not constitute or form part of and should not be construed as, an offer to sell or issue or the solicitation of an offer to purchase orsubscribe for securities of TMCC in any jurisdiction or an inducement to enter into investment activity in any jurisdiction. Neither this presentation norany part thereof, nor the fact of its distribution, shall form the basis of, or be relied on in connection with, any contract or commitment or investmentdecision whatsoever. Any offer or sale of securities by TMCC will be made only by means of a prospectus and related documentation. Investors and prospective investors in securities of TMCC are required to make their own independent investigation and appraisal of the business andfinancial condition of TMCC and the nature of its securities. This presentation does not constitute a recommendation regarding securities of TMCC.Any prospective purchaser of securities in TMCC is recommended to seek its own independent financial advice. This presentation is made to and directed only at (i) persons outside the United Kingdom, or (ii) qualified investors or investment professionals fallingwithin Article 19(5) and Article 49(2)(a) to (d) of the Financial Services and Markets Act 2000 (Financial Promotion) Order 2005 (the “Order”), or(iii) high net worth individuals, and other persons to whom it may lawfully be communicated, falling within Article 49(2)(a) to (d) of the Order, and (iv)persons who are “qualified investors” within the meaning of Article 2(1)(e) of the Prospectus Directive (Directive 2003/71/EC) as amended (suchpersons collectively being referred to as “Relevant Persons”). This presentation must not be acted or relied on by persons who are not RelevantPersons. Any investment or investment activity to which this presentation relates is available only to Relevant Persons and will be engaged in only withRelevant Persons. This presentation is an advertisement and not a prospectus and investors should not subscribe for or purchase any securities of TMCC referred to inthis presentation or otherwise except on the basis of information in the base prospectus of Toyota Motor Finance (Netherlands) B.V., Toyota CreditCanada Inc., Toyota Finance Australia Limited and Toyota Motor Credit Corporation dated 12 September 2014 as supplemented from time to timetogether with the applicable final terms which are or will be, as applicable, available on the website of the London Stock Exchange plc -news/market-news-home.html. Investors and others should note that we announce material financial information using the investor relations section of our corporate website(http://www.toyotafinancial.com) and SEC filings. We use these channels, press releases, as well as social media to communicate with our investors,customers and the general public about our company, our services and other issues. While not all of the information that we post on social media is of amaterial nature, some information could be material. Therefore, we encourage investors, the media, and others interested in our company to reviewthe information we post on the Toyota Motor Credit Corporation Twitter Feed (http://www.twitter.com/toyotafinancial). We may update our socialmedia channels from time to time on the investor relations section of our corporate website.3
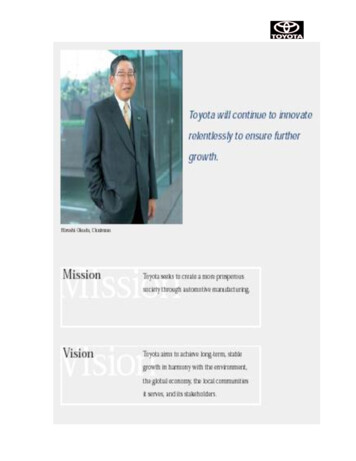
Toyota’s Global Businesses4
TMC Consolidated Financial Results(JPY billions)Net RevenuesOperating IncomeNet IncomeSource: TMC FY2013, FY2014 & FY2015 Financial Summary201322,064.21,320.9962.2Fiscal Year Ended March 173.35
TMC Consolidated Balance Sheet(JPY billions)Current assetsNoncurrent finance receivables, netInvestment & other assetsProperty, plant & equipment, netTotal AssetsLiabilitiesShareholders' equityTotal Liabilities & Shareholders' EquitySource: TMC FY2013, FY2014 & FY2015 Financial SummaryFY2013As of March 31, 201313,784.96,943.87,903.46,851.235,483.3FY2014As of March 31, 201415,717.78,102.39,976.27,641.341,437.5FY2015As of March 31, ,647.347,729.86
Toyota Across the United StatesOperations Overview7
Toyota Motor Sales, USA TMS sold 2.37 million vehicles in 2014; the highest sales volume since 2007 and up 6.2% from 2013– Toyota division is the #1 US retail brand in 2014– Camry was the best-selling passenger car in America for the 13th consecutive year Industry-leading investment in next-generation technologies in power-train, safety and production– TMS has one of the most fuel-efficient line-ups of any full-line OEM– Over 2.4 million hybrids sold in the US(1) and over 7.7 million worldwide(2)– 12 hybrid models(3) and 1 plug-in model across the TMS line-up– Mirai is Toyota’s first mass-produced hydrogen fuel cell vehicle For 2015, TMS will launch 12 new or refreshed models. Recent and upcoming vehicle launches:- Mirai (FCV)- Scion iM- Scion iA- Tacoma- Avalon- RAV4- Lexus NX- Lexus RX- Lexus RC(1) As of November 2014(2) As of March 2015(3) Includes cars and light trucksSource: TMS Reports8
Toyota Motor Sales, USA(2) Quality, dependability, safety and product appeal remain high as reflectedby numerous 3rd party accolades2015 ForbesToyota ranked No. 1 most valuableautomotive brand2015 U.S. NewsBest Cars for the MoneyCamry Hybrid, Highlander Hybrid,RX3502015 Fortune MagazineToyota ranked 24th in world’s mostadmired company list2015 U.S. NewsBest Cars for FamiliesHighlander, Highlander Hybrid,RX3502015 NHSTA 5-StarCrash Test RatingRAV4, Scion FR-S and tC2015 Kelley Blue Book’sBest Mid-Size Pickup TruckTacomaKelley Blue Book’sTop 10 Best Resale Value of 2015Tacoma, Tundra, 4Runner2015 Fast CompanyToyota ranked among World’s 50 MostInnovative Companies2015 Consumer Reports GreatestLikelihood of Turning Over 200K MilesToyota Prius, Camry, Corolla, Sienna,and Highlander2015 J.D. Power and AssociatesCustomer Service IndexLexus ranked 2nd overall2015 Kelley Blue Book10 Best Green CarsToyota Prius and Camry Hybrid2014 InterbrandBest Global Green BrandsToyota ranked 2nd9
Toyota Motor Sales, USARAV4 Hybrid(3)Toyota Mirai (FCV)10
Toyota Motor Sales, USA(4)Scion iMLexus LF-C211
Toyota Motor Sales, USA(5)Lexus RX350 F SportLexus RC F12
Toyota Financial Services13
TFS Group Global Presence14
Toyota Motor Credit Corporation (TMCC)Toyota Motor Corporation (TMC)Toyota Financial Services Corporation (TFSC)Toyota Motor Credit Corporation (TMCC) Over 4.3 million active finance contracts(1) AA-(2)/Aa3(2) rated captive finance company by S&P/Moody’s Credit support agreement structure with TFSC/TMC(3)(1) As of April 2015(2) Outlook stable(3) The Credit Support Agreements do not apply to securitization transactions15
Credit Support Agreements Securities* issued by TMCC (and various other TFSC subsidiaries) have the benefit ofa credit support agreement with TFSC– TFSC will own 100% of TMCC– TFSC will cause TMCC to maintain a tangible net worth of at least 100,000 as long as coveredsecurities are outstanding– If TMCC determines it will be unable to meet its payment obligations on any securities, TFSC will makesufficient funds available to TMCC to ensure that all such payment obligations are paid as due– Agreement cannot be terminated until (1) repayment of all outstanding securities or (2) each ratingagency requested by Toyota to provide a rating has confirmed no change in rating of all such securities TFSC in turn has the benefit of a credit support agreement with TMC– Same key features as TFSC/TMCC credit support agreement– TMC will cause TFSC to maintain a tangible net worth of at least JPY10mm as long as coveredsecurities are outstanding TFSC’s and/or TMC's credit support obligations will rank pari passu with all othersenior unsecured debt obligations* “Securities” defined as outstanding bonds, debentures, notes and other investment securities and commercial paper, but does not include asset-backed securitiesissued by TMCC’s securitization trusts.16
TMCC Products and ServicesConsumer Finance Retail Lease(1)Dealer Finance WholesaleReal EstateWorking CapitalRevolving Credit LinesInsurance Service AgreementsPrepaid MaintenanceGuaranteed Auto ProtectionExcess Wear & UseTire & Wheel(1) In December 2014, TMCC entered into an agreement for the sale of certain assets relating to its commercial finance business to a newly-formed subsidiary ofToyota Industries Corporation, which forms part of the group of companies known as the Toyota Group. The closing date of the transaction has not yet beendetermined and the assets to be sold are not available for immediate sale in their present condition, as the transaction is subject to several closing conditions thathave not yet been satisfied. The assets represent approximately 984 million of finance receivables, net and 923 million of investments in operating leases, net asof March 31, 2015.Source: TMCC March 31, 2015 10-K17
Extensive Field Organization Decentralized dealer and field support Centralized servicing and collections (circled)18
Recent TMCC Business Highlights In excess of 10.8 billion pre-tax income over the past 5 years(1) TFS is the top U.S. auto lender in all new vehicles(2) Strong market share continues to drive solid financing revenuesand sales support Low net charge-off ratio driven by prudent underwriting standardsand proactive servicing practices High insurance penetration and growing insurance volume(1) For the five year period from FY11 through FY15; 3.003mm 2.423mm 2.155mm 1.354mm 1.926 10,861mm(2) Source: AutoCount as of April 201519
TMCC Earning Asset CompositionManaged Assets(USD billions) 89.9 76.8 76.815.6 83.015.814.912.1 Mar-11Mar-12Mar-13LeaseRetailSold (ABS)39.624.9Mar-1438.530.2Mar-15Wholesale & OtherSource: TMCC March 31, 2011 10-K, March 31, 2012 10-K , March 31, 2013 10-K , March 31, 2014 10-K & March 31, 2015 10-K20
TMCC Financial Performance - Select DataFiscal Year Ended March 31,(USD ,3107797177447028324,9674,6394,5085,3525,593Net Financing Revenuesand Other Revenues3,8763,5073,4802,7473,549Net Income1,8531,4861,3318571,197Total Financing Revenuesadd: Other Incomeless: Interest Expenseand DepreciationSource: TMCC March 31, 201 5 10-K21
TMCC Financial Performance - Select DataFiscal Year Ended March 31,(USD millions)20112012201320142015Over 60 Days Delinquent (1)0.26%0.18%0.19%0.18%0.21%Allowance for Credit Losses (1) (2)1.13%0.80%0.63%0.50%0.50%Net Credit Losses0.52%0.21%0.27%0.28%0.29%(1) Percentage of gross earning assets(2) The quotient of allowance for credit losses divided by the sum of gross finance receivables (net finance receivables less allowance for credit losses) plus gross investments inoperating leases (net investments in operating leases less allowance for credit losses)Note: All percentage figures calculated were based on a 120-day charge-off policySource: TMCC March 31, 2014 10-K & March 31, 2015 10-K22
TMCC Funding Programs23
Exceptional Liquidity A-1 /P-1 rated direct commercial paper program 20.7 billion committed credit facilities(1) 7.5 billion short-term liquidity investment portfolio(2) Over 60 billion in readily salable consumer retail loan & lease receivables Access to various domestic and international markets Billions of additional capacity in global benchmark markets Extensive inter-company lending infrastructure Credit support agreements: TMCC TFSC TMC(1) As of March 31, 2015(2) Average balance for quarter ended March 31, 2015Source: TMCC March 31, 2015 10-K24
TMCC Funding Program Objectives TMCC is committed to:– Maintaining funding diversity and exceptional liquidity– Issuing into strong demand with attractive deals– Identifying & developing new markets and investor relationships– Responding quickly to opportunities with best-in-class execution– Managing our business and stakeholder relationships with a long-term view25
New Funding Vehicles Auto industry’s first ever Green Bond ABS Diversity and Inclusion (D&I) bond syndicates led by diversity firms Competitive, innovative and socially responsible26
TMCC FY15 Funding Overview 25.7 billion of long term debt funded in FY2015EMTN14%Public/Private ABS29%MTN22%Other8%Global MTN26% 18.2 billion in unsecured debt 7.5 billion in secured debt (net of amount retained)– 2.6 billion comprised of public term secured funding (net of amount retained)Source: Company Reports27
Diversification in Debt OfferingsTMCC Long Term Debt Outstanding (USD millions)By CurrencyBy Deal TypeGBP OtherAUD JPY 1,210 9072,180 1,408EUR 8,689EMTN/Eurobonds 14,046Global MTN 24,100Other 7,557Public/Private ABS 10,837As of March 31, 2015Source: Company ReportsMTN 8,621USD 50,76728
Funding Flexibility And ResponsivenessDiversification Across USD Curve %0%FY 10FY 111yrFY 1218mth2yr(1) Unsecured U.S. MTN issuance, excluding Structured Notes and Retail NotesPercentages may not add to 100% due to roundingAs of March 31, 2015Source: Company Reports3yrFY 135yr7yrFY14FY'1510yr29
Key Investment Highlights Financial strength supported by strong credit ratings Transparent business model with exceptional liquidity Rational funding programs with long term perspective– Diversification in bond offerings– Focus on proactively meeting needs of market– Strong emphasis placed on flexibility and responsiveness Industry-leading in:– Liquidity management framework– Balance sheet strength– Business model resiliency30
TMCC Retail Loan Collateral &ABS Transactions31
Credit Decisioning & Collections Recent consistent, conservative underwriting standards have producedlow levels of delinquencies and credit losses– Identification & minimization of least desirable segments– Ongoing focus on Toyota and Lexus business Optimization of collections strategy and staff supports loss mitigationwhile enabling portfolio growth– Emphasis on early intervention– Reinforcement of strong compliance management system3.0%2.0%Delinquency (1)1.0%Credit loss (2)0.0%FY2009FY2010FY2011FY2012FY2013(1) Delinquency is 30 day delinquencies as a percentage of retail receivables outstanding(2) Credit loss is annual net credit loss as a percentage of retail receivables outstandingFY2014FY201532
Credit: Results* Retail loan credit performance has shown significant improvement– Portfolio-level performance trends show general improvement– Recent vintages outperforming older cohortsCumulative Net losses: Annual Origination 012482013525660646872Month* Abbreviated for presentation purposesSource: Company Reports33
Managed Portfolio PerformanceTMCC Retail Loan Delinquency Experience (1)At March 3,119,7813,189,591Number of Accounts Past Duein the following categories30 - 59 days60 - 89 daysOver 89 6235,1626,7865,87043,0708,5889,153Delinquencies as a Percentageof Contracts Outstanding (3)30 - 59 days60 - 89 daysOver 89 .13%0.22%0.19%1.35%0.27%0.29%Outstanding Contracts (2)(1) The historical delinquency data reported in this table includes all retail vehicle installment sales contracts purchased by TMCC, excluding thosepurchased by a subsidiary of TMCC operating in Puerto Rico. Includes contracts that have been sold but are still being serviced by TMCC.(2) Number of contracts outstanding at end of period.(3) The period of delinquency is based on the number of days payments are contractually past due. A payment is deemed to be past due if less than 90%of such payment is made.Source: Company Reports34
Performance – Retail LoanTMCC Managed Portfolio Net Loss and Repossession Experience (dollars in thousands) (1)For the Fiscal Years Ended2015Principal Balance Outstanding (2)Average Principal Balance Outstanding (3)Number of Contracts OutstandingAverage Number ofContracts Outstanding (3)Number of Repossessions (4)Number of Repossessions as a Percent ofthe Average Number of Contracts OutstandingGross Charge-Offs (5)Recoveries (6)Net LossesNet Losses as a Percentage of AveragePrincipal Balance Outstanding2014201320122011 49,645,354 49,203,2593,209,872 48,761,164 47,846,9423,220,641 46,932,720 45,790,3703,156,247 44,648,020 44,850,6613,119,781 45,053,303 ,138,01434,3533,154,68642,9373,141,74364,7101.08% 267,835 59,931 207,9041.10% 257,586 62,714 194,8721.09% 244,432 69,088 175,3441.36% 240,736 78,593 162,1432.06% 447,159 98,105 349,0540.42%0.41%0.38%0.36%0.79%(1) The net loss and repossession data reported in this table includes all retail installment sales contracts purchased by TMCC, excluding those purchased by a subsidiary of TMCCoperating in Puerto Rico. Includes contracts that have been sold but are still being serviced by TMCC.(2) Principal Balance Outstanding includes payoff amount for simple interest contracts and net principal amount for actuarial contracts. Actuarial contracts do not comprise any of theReceivables.(3) Average of the principal balance or number of contracts outstanding as of the beginning and end of the indicated periods.(4) Includes bankrupt cy-related repossessions but excludes bankruptcies.(5) Amount charged-off is the net remaining principal balance, including earned but not yet received finance charges, repossession expenses and unpaid extension fees, less anyproceeds from the liquidation of the related vehicle. Also includes dealer reserve charge-offs.(6)Includes all recoveries from post-disposition monies received on previously charged-off contracts including any proceeds from the liquidation of the related vehicle after the relatedcharge-off. Also includes recoveries for dealer reserve charge-offs and chargebacks.Source: Company Reports35
Origination ProfileTMCC Retail Auto Loan OriginationsOriginal Summary Characteristicsby Vintage Origination Year2011Number of Pool AssetsOriginal Pool BalanceAverage Initial Loan BalanceWeighted Average Interest RateWeighted Average Original TermWeighted Average FICOGeographic Distribution of Receivables representing the 5states with the greatest aggregate original principal balancesState 1State 2State 3State 4State 5Distribution of Receivables by Contract Rate:Less than 11.99%12.0%-13.99%14.0%-15.99%16.0% and 8143.47%64720CA - 18.9%TX - 12.6%NY - 5.4%NJ - 4.9%IL - 4.1%CA - 19.3%TX - 14.1%NY - 5.1%NJ - 4.5%VA - 4.2%CA - 21.4%TX - 13.3%NY - 4.6%NJ - 4.4%IL - 3.9%CA - 21.0%TX - 14.0%NY - 4.7%NJ - 4.0%IL - 4.2%CA - 21.87%TX - 15.2%NY - 4.77%NJ - 3.69%IL - (2)Share of Original Assets:Percentage of Non-Toyota, Non-LexusPercentage of 72 Month TermPercentage of Used Vehicles(1)2012As of March 31, 2015(2) Percentages may not add to 100.0%Source: Company Reportsdue to rounding36
Origination CharacteristicsAPR DistributionWeighted Average FICO100%74080%72070060%68040%66020%6400%CY2011 2.0%201220132.0%-3.99%20146202015*CY2011 4.0%2012201320142015*Weighted Average FICOWeighted Average Original TermNew vs. ighted Average Original Term*As of March 31, 2015Source: Company Reports2015*0%CY20112012New2013Used2014201537
ABS Deal Comparison(*)Toyota Auto Owner Trust (TAOT)Original Summary Characteristics by Prior Securitization:Number of Pool AssetsOriginal Pool BalanceAverage Principal BalanceWeighted Average Interest RateWeighted Average Original TermWeighted Average FICOMinimum FICOMaximum FICOGeographic Distribution of Receivables representing the 5 stateswith the greatest aggregate original principal balance:State 1State 2State 3State 4State 5Distribution of Receivables by Contract Rate:Less than 2.0%2.0% - 3.99%4.0% - 5.99%6.0% - 7.99%8.0% - 9.99%10.0% - 11.99%12.0% - 13.99%14.0% - 15.99%16.0% and greaterTotalTAOT 2013-ATAOT 2013-BTAOT 2014-ATAOT 2014-BTAOT 2014-CTAOT 2015-A84,513 1,301,545,574 15,4012.56%6175662088666,096 1,054,454,801 15,9532.24%61757620883115,093 1,845,073,346 16,0312.10%6175762088698,798 1,583,044,330 16,023.042.09%6175662088480,419 1,321,305,071 16,4302.01%6175862088696,067 1,598,310,293 16,6371.97%61757620886CA - 20.0%TX - 13.3%VA - 4.3%IL - 4.3%NJ - 4.2%CA - 21.3%TX - 13.4%IL - 4.2%VA - 4.1%PA - 4.0%CA - 22.6%TX - 13.4%IL - 4.6%PA - 4.3%NJ - 4.2%CA - 26.3%TX - 12.9%IL - 4.4%PA - 4.0%VA - 3.9%CA- 23.3%TX - 13.3%IL - 4.7%PA - 4.3%VA - 4.0%CA- 23.2%TX - 13.7%IL - 4.7%PA - 4.3%VA - 5%0.0%0.0%19.40%(1)Share of Original Assets:Percentage of Non-Toyota/Non-LexusPercentage of 72 Month TermPercentage of Used Vehicles* Abbreviated for presentation purposes(1) Percentages may not add to 100.00% due to roundingSource: Company Reports38
TAOT Deal Performance0.40%As of March 31, 2015 Payment Date0.35%TAOT 2010-ATAOT 2010-BTAOT 2010-CTAOT 2011-ATAOT 2011-BTAOT 2012-ATAOT 2012-BTAOT 2013-ATAOT 2013-BTAOT 2014-ATAOT 2014-BTAOT 2014-CTAOT TransactionTAOT 2010-ATAOT 2010-BTAOT 2010-CTAOT 2011-ATAOT 2011-BTAOT 2012-ATAOT 2012-BTAOT 2013-ATAOT 2013-BTAOT 2014-ATAOT 2014-BTAOT 2014-CTAOT 2015-ASource: Company Reports19Initial 0%0.40%0.40%0.40%2225Moody'sUpdated EL0.45% - 0.70%0.45% - 0.70%0.35% - 0.40%28313437S&PInitial ELUpdated EL1.70% - 1.90%0.30% - 0.35%1.50% - 1.70%0.25% - 0.30%1.40% - 1.60%0.20% - 0.25%1.40% - 1.60%0.20% - 0.25%1.15% - 1.35%0.17% - 0.20%0.85% - 1.00%0.30% - 0.35%0.75% - 0.90%0.30% - 0.35%0.65% - 0.80%0.30% - 0.35%0.55% - 0.70%0.30% - 0.35%0.55% - 0.70%0.55% - 0.70%0.55% - 0.70%0.55% - 0.70%0.55% - 0.70%0.55% - 0.70%0.50% - 0.60%0.50% - 0.60%40434649FinalActual CNL0.32%0.23%0.19%0.18%0.16%39
Sales & Trading Update40
Commercial Paper Programs Highlights A-1 /P-1 Direct Commercial Paper Programs–3 distinct USD commercial paper programs (TMCC, TCPR, TCCI)– 15.0 billion multi-party committed credit facilities– 5.7 billion bilateral committed credit facilities– 27.2 billion USCP combined average outstanding for TMCC and TCPR–Over 600 diverse institutional investors– State and local municipalities Large corporations Pension and retirement funds Financial institutions Money managers and mutual fund companiesRates are posted daily on Bloomberg DOCP screenSource: TMCC March 31, 2015 10-K41
2015 Fast Company Toyota ranked among World’s 50 Most Innovative Companies 2015 Consumer Reports Greatest Likelihood of Turning Over 200K Miles Toyota Prius, Camry, Corolla, Sienna, and Highlander 2015 J.D. Power and Associates Customer Service Index Lexus ranked 2nd overall 2015 Kelley Blue Book 10 Be